South Africa Biological Data Visualization Market Size & Outlook
Related Markets
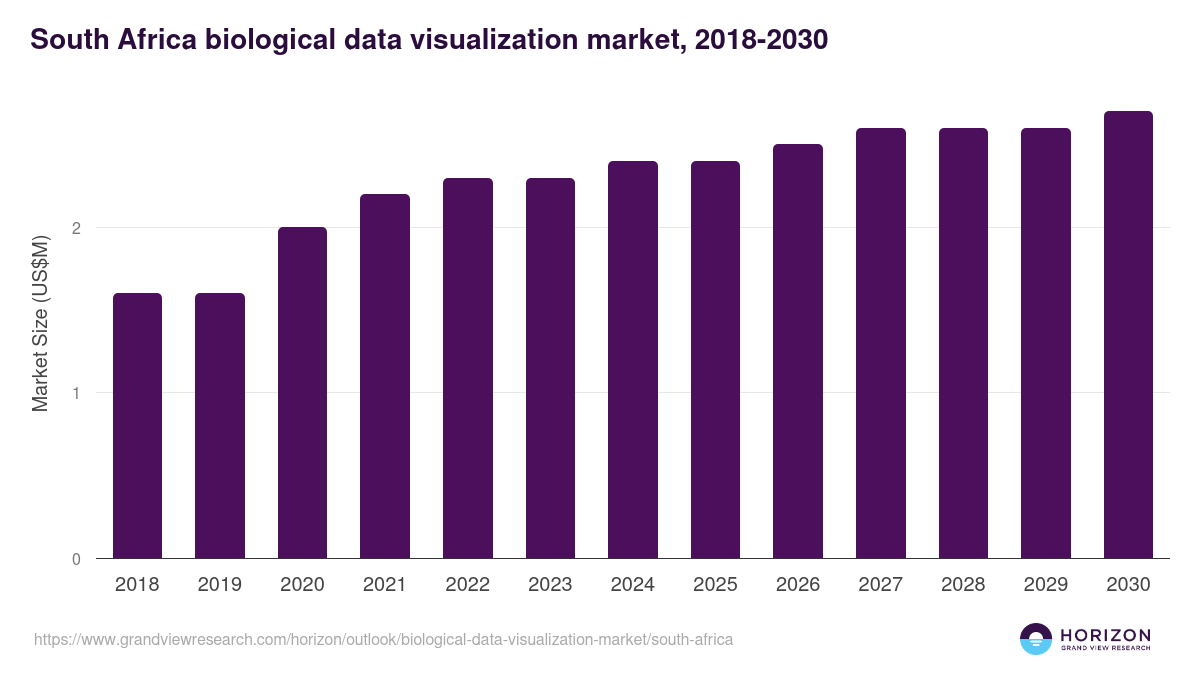
South Africa biological data visualization market highlights
- The South Africa biological data visualization market generated a revenue of USD 2.4 million in 2024 and is expected to reach USD 2.7 million by 2030.
- The South Africa market is expected to grow at a CAGR of 2% from 2025 to 2030.
- In terms of segment, sequencing was the largest revenue generating technique in 2024.
- Magnetic Resonance Imaging is the most lucrative technique segment registering the fastest growth during the forecast period.
Biological data visualization market data book summary
| Market revenue in 2024 | USD 2.4 million |
| Market revenue in 2030 | USD 2.7 million |
| Growth rate | 2% (CAGR from 2024 to 2030) |
| Largest segment | Sequencing |
| Fastest growing segment | Magnetic Resonance Imaging |
| Historical data | 2018 - 2023 |
| Base year | 2024 |
| Forecast period | 2025 - 2030 |
| Quantitative units | Revenue in USD million |
| Market segmentation | Microscopy, Magnetic Resonance Imaging, Sequencing, X-ray Crystallography |
| Key market players worldwide | Thermo Fisher Scientific Inc, 3M Co, Salesforce Inc, Qiagen NV, ZEISS Group, Oxford Instruments PLC, Olympus Corp, GE Aerospace, Agilent Technologies Inc, Clarivate PLC Ordinary Shares |
Other key industry trends
- In terms of revenue, South Africa accounted for 0.4% of the global biological data visualization market in 2024.
- Country-wise, U.S. is expected to lead the global market in terms of revenue in 2030.
- In Middle East & Africa, Saudi Arabia biological data visualization market is projected to lead the regional market in terms of revenue in 2030.
- UAE is the fastest growing regional market in Middle East & Africa and is projected to reach USD 1.8 million by 2030.
No credit card required*
Horizon in a snapshot
- 30K+ Global Market Reports
- 120K+ Country Reports
- 1.2M+ Market Statistics
- 200K+ Company Profiles
- Industry insights and more
Biological Data Visualization Market Scope
Biological Data Visualization Market Companies
| Name | Profile | # Employees | HQ | Website |
|---|---|---|---|---|
| Clarivate PLC Ordinary Shares | View profile | 12000 | 70 St. Mary Axe, London, United Kingdom, EC3A 8BE | https://www.clarivate.com |
| Oxford Instruments PLC | View profile | 1871 | Tubney Woods, Abingdon, Oxfordshire, United Kingdom, OX13 5QX | https://www.oxinst.com |
| Salesforce Inc | View profile | 72682 | 415 Mission Street, 3rd Floor, Salesforce Tower, San Francisco, CA, United States, 94105 | https://www.salesforce.com |
| ZEISS Group | View profile | 10001+ | Oberkochen, Baden-Wurttemberg, Germany, Europe | http://www.zeiss.com |
| Qiagen NV | View profile | 5900 | Hulsterweg 82, Venlo, LI, Netherlands, 5912 PL | https://www.qiagen.com |
| Agilent Technologies Inc | View profile | 17700 | 5301 Stevens Creek Boulevard, Santa Clara, CA, United States, 95051 | https://www.agilent.com |
| Thermo Fisher Scientific Inc | View profile | 122000 | 168 Third Avenue, Waltham, MA, United States, 02451 | https://www.thermofisher.com |
| GE Aerospace | View profile | 125000 | One Financial Center, Suite 3700, Boston, MA, United States, 02111 | https://www.geaerospace.com |
| Olympus Corp | View profile | 33629 | Shinjuku Monolith, 2-3-1 Nishi-Shinjuku, Shinjuku-ku, Tokyo, Japan, 163-0914 | http://www.olympus.co.jp |
| 3M Co | View profile | 85000 | 3M Center, St. Paul, MN, United States, 55144 | https://www.3m.com |
South Africa biological data visualization market outlook
The databook is designed to serve as a comprehensive guide to navigating this sector. The databook focuses on market statistics denoted in the form of revenue and y-o-y growth and CAGR across the globe and regions. A detailed competitive and opportunity analyses related to biological data visualization market will help companies and investors design strategic landscapes.
Sequencing was the largest segment with a revenue share of 37.5% in 2024. Horizon Databook has segmented the South Africa biological data visualization market based on microscopy, magnetic resonance imaging, sequencing, x-ray crystallography covering the revenue growth of each sub-segment from 2018 to 2030.
Reasons to subscribe to South Africa biological data visualization market databook:
-
Access to comprehensive data: Horizon Databook provides over 1 million market statistics and 20,000+ reports, offering extensive coverage across various industries and regions.
-
Informed decision making: Subscribers gain insights into market trends, customer preferences, and competitor strategies, empowering informed business decisions.
-
Cost-Effective solution: It's recognized as the world's most cost-effective market research database, offering high ROI through its vast repository of data and reports.
-
Customizable reports: Tailored reports and analytics allow companies to drill down into specific markets, demographics, or product segments, adapting to unique business needs.
-
Strategic advantage: By staying updated with the latest market intelligence, companies can stay ahead of competitors, anticipate industry shifts, and capitalize on emerging opportunities.
Target buyers of South Africa biological data visualization market databook
-
Our clientele includes a mix of biological data visualization market companies, investment firms, advisory firms & academic institutions.
-
30% of our revenue is generated working with investment firms and helping them identify viable opportunity areas.
-
Approximately 65% of our revenue is generated working with competitive intelligence & market intelligence teams of market participants (manufacturers, service providers, etc.).
-
The rest of the revenue is generated working with academic and research not-for-profit institutes. We do our bit of pro-bono by working with these institutions at subsidized rates.
Horizon Databook provides a detailed overview of country-level data and insights on the South Africa biological data visualization market, including forecasts for subscribers. This country databook contains high-level insights into South Africa biological data visualization market from 2018 to 2030, including revenue numbers, major trends, and company profiles.
Partial client list
South Africa biological data visualization market size, by application, 2018-2030 (US$M)

South Africa Biological Data Visualization Market Share, 2024 & 2030 (US$M)


Related industry reports
Related statistics
Sign up - it's easy, and free!
Sign up and get instant basic access to databook, upgrade
when ready, or enjoy our
free plan indefinitely.
Included in Horizon account
- 30K+ Global Market Reports
- 120K+ Country Reports
- 1.2M+ Market Statistics
- 200K+ Company Profiles
- Industry insights and more