U.S. Business To Business E-commerce Market Size & Outlook
Related Markets
U.S. business to business e-commerce market highlights
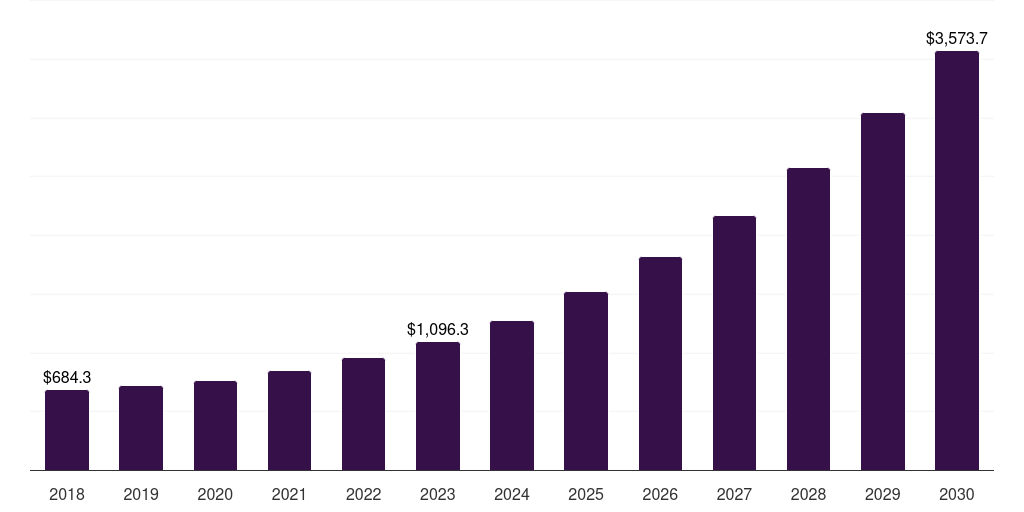
- The U.S. business to business e-commerce market generated a revenue of USD 1,096.3 billion in 2023 and is expected to reach USD 3,573.7 billion by 2030.
- The U.S. market is expected to grow at a CAGR of 18.4% from 2024 to 2030.
- In terms of segment, intermediary-oriented was the largest revenue generating deployment in 2023.
- Intermediary-oriented is the most lucrative deployment segment registering the fastest growth during the forecast period.
Business to business e-commerce market data book summary
| Market revenue in 2023 | USD 1,096.3 billion |
| Market revenue in 2030 | USD 3,573.7 billion |
| Growth rate | 18.4% (CAGR from 2024 to 2030) |
| Largest segment | Intermediary-oriented |
| Fastest growing segment | Intermediary-oriented |
| Historical data | 2018 - 2022 |
| Base year | 2023 |
| Forecast period | 2024 - 2030 |
| Quantitative units | Revenue in USD billion |
| Market segmentation | Buyer-oriented, Supplier-oriented, Intermediary-oriented |
| Key market players worldwide | Amazon.com Inc, Alibaba Group Holding Ltd ADR, ASOS PLC, Costco Wholesale Corp, EBay Inc, Walmart Inc, JD.com Inc ADR, MercadoLibre Inc, Shopify Inc Registered Shs -A- Subord Vtg, Sea Ltd ADR, Wayfair Inc Class A, Zalando SE, DangDang.com |
Other key industry trends
- In terms of revenue, U.S. accounted for 11.9% of the global business to business e-commerce market in 2023.
- Country-wise, China is expected to lead the global market in terms of revenue in 2030.
- In North America, U.S. business to business e-commerce market is projected to lead the regional market in terms of revenue in 2030.
- Canada is the fastest growing regional market in North America and is projected to reach USD 757.5 billion by 2030.
No credit card required*
Horizon in a snapshot
- 30K+ Global Market Reports
- 120K+ Country Reports
- 1.2M+ Market Statistics
- 200K+ Company Profiles
- Industry insights and more
Business To Business E-Commerce Market Scope
Business To Business E-Commerce Market Companies
| Name | Profile | # Employees | HQ | Website |
|---|---|---|---|---|
| DangDang.com | View profile | 5001-10000 | Beijing, Beijing, China, Asia | http://www.dangdang.com |
| Shopify Inc Registered Shs -A- Subord Vtg | View profile | 11600 | 151 O'Connor Street, Ground Floor, Ottawa, ON, Canada, K2P 2L8 | https://www.shopify.com |
| Zalando SE | View profile | 15497 | Valeska-Gert-Strabe 5, Berlin, Germany, 10243 | https://corporate.zalando.com |
| Sea Ltd ADR | View profile | 62700 | 1 Fusionopolis Place, No. 17-10, Galaxis, Singapore, Singapore, 138522 | https://www.sea.com |
| MercadoLibre Inc | View profile | 58313 | WTC Free Zone, Dr. Luis Bonavita 1294, Of. 1733, Tower II, Montevideo, Uruguay, 11300 | https://www.mercadolibre.com |
| JD.com Inc ADR | View profile | 517124 | No. 18 Kechuang 11 Street, 20th Floor, Building A, Yizhuang Economic & Technological Development Zone, Beijing, China, People's Republic of, 101111 | https://www.jd.com |
| Costco Wholesale Corp | View profile | 316000 | 999 Lake Drive, Issaquah, WA, United States, 98027 | https://www.costco.com |
| EBay Inc | View profile | 12300 | 2025 Hamilton Avenue, San Jose, CA, United States, 95125 | https://www.ebay.com |
| ASOS PLC | View profile | 3352 | Hampstead Road, Greater London House, London, United Kingdom, NW1 7FB | https://www.asosplc.com |
| Walmart Inc | View profile | 2100000 | 702 S.W. 8th Street, Bentonville, AR, United States, 72716 | https://stock.walmart.com |
| Alibaba Group Holding Ltd ADR | View profile | 204891 | 1 Matheson Street, Causeway Bay, 26th Floor, Tower One, Times Square, Hong Kong, Hong Kong, | https://www.alibabagroup.com |
| Wayfair Inc Class A | View profile | 14400 | 4 Copley Place, Boston, MA, United States, 02116 | https://www.wayfair.com |
| Amazon.com Inc | View profile | 1525000 | 410 Terry Avenue North, Seattle, WA, United States, 98109-5210 | https://www.amazon.com |
U.S. business to business e-commerce market outlook
The databook is designed to serve as a comprehensive guide to navigating this sector. The databook focuses on market statistics denoted in the form of revenue and y-o-y growth and CAGR across the globe and regions. A detailed competitive and opportunity analyses related to business to business e-commerce market will help companies and investors design strategic landscapes.
Intermediary-oriented was the largest segment with a revenue share of 60.77% in 2023. Horizon Databook has segmented the U.S. business to business e-commerce market based on buyer-oriented, supplier-oriented, intermediary-oriented covering the revenue growth of each sub-segment from 2018 to 2030.
The U.S. witnessed the largest market share of around 85.8% in 2022 of the North American B2B ecommerce market. The adoption of digital solutions in the U.S. is driven by the increasing demand for convenience and ease of using digital platforms from B2B buyers.
With the proliferation of technology, U.S. consumers can conduct product research, place orders, and manage bank accounts by placing orders via self-service shopping carts and other online platforms. B2B e-commerce platforms in the U.S. offer enterprises an affordable way to buy the required goods and services.
U.S. businesses can access various goods and services from multiple suppliers in one location by providing digital storefronts such as an inventory tracker, online ordering system, and billing tracker. The U.S. government has been actively promoting digital trade through initiatives such as the Digital Trade Agreements Act and the United States-Mexico-Canada Agreement (USMCA), which include measures to facilitate cross-border ecommerce.
Reasons to subscribe to U.S. business to business e-commerce market databook:
-
Access to comprehensive data: Horizon Databook provides over 1 million market statistics and 20,000+ reports, offering extensive coverage across various industries and regions.
-
Informed decision making: Subscribers gain insights into market trends, customer preferences, and competitor strategies, empowering informed business decisions.
-
Cost-Effective solution: It's recognized as the world's most cost-effective market research database, offering high ROI through its vast repository of data and reports.
-
Customizable reports: Tailored reports and analytics allow companies to drill down into specific markets, demographics, or product segments, adapting to unique business needs.
-
Strategic advantage: By staying updated with the latest market intelligence, companies can stay ahead of competitors, anticipate industry shifts, and capitalize on emerging opportunities.
Target buyers of U.S. business to business e-commerce market databook
-
Our clientele includes a mix of business to business e-commerce market companies, investment firms, advisory firms & academic institutions.
-
30% of our revenue is generated working with investment firms and helping them identify viable opportunity areas.
-
Approximately 65% of our revenue is generated working with competitive intelligence & market intelligence teams of market participants (manufacturers, service providers, etc.).
-
The rest of the revenue is generated working with academic and research not-for-profit institutes. We do our bit of pro-bono by working with these institutions at subsidized rates.
Horizon Databook provides a detailed overview of country-level data and insights on the U.S. business to business e-commerce market , including forecasts for subscribers. This country databook contains high-level insights into U.S. business to business e-commerce market from 2018 to 2030, including revenue numbers, major trends, and company profiles.
Partial client list
U.S. business to business e commerce market size, by deployment, 2018-2030 (US$B)

U.S. Business To Business E-Commerce Market Outlook Share, 2023 & 2030 (US$B)


Related industry reports
Related statistics
Sign up - it's easy, and free!
Sign up and get instant basic access to databook, upgrade
when ready, or enjoy our
free plan indefinitely.
Included in Horizon account
- 30K+ Global Market Reports
- 120K+ Country Reports
- 1.2M+ Market Statistics
- 200K+ Company Profiles
- Industry insights and more