Asia Pacific Commercial Vehicles Market Size & Outlook
Related Markets
Asia Pacific commercial vehicles market highlights
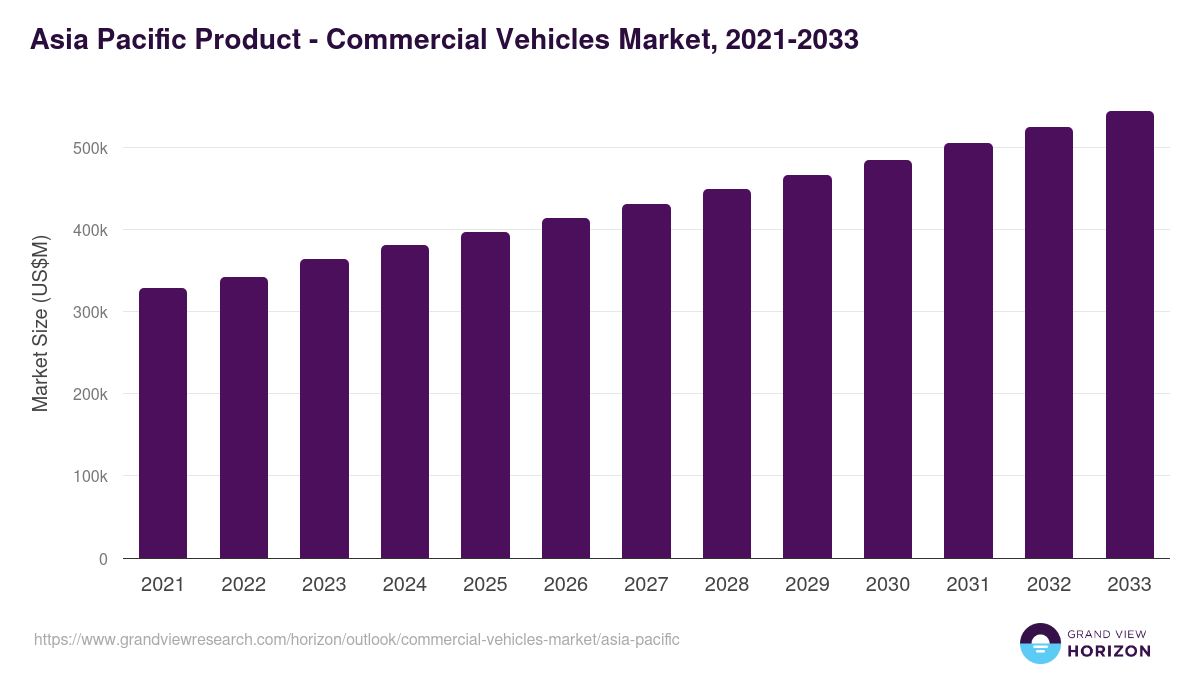
- The Asia Pacific commercial vehicles market generated a revenue of USD 397,613.2 million in 2025.
- The market is expected to grow at a CAGR of 4% from 2026 to 2033.
- In terms of segment, light commercial vehicle was the largest revenue generating product in 2025.
- Light Commercial Vehicle is the most lucrative product segment registering the fastest growth during the forecast period.
- Country-wise, India is expected to register the highest CAGR from 2026 to 2033.
Asia Pacific data book summary
| Market revenue in 2025 | USD 397,613.2 million |
| Market revenue in 2033 | USD 544,437.7 million |
| Growth rate | 4% (CAGR from 2026 to 2033) |
| Largest segment | Light commercial vehicle |
| Fastest growing segment | Light Commercial Vehicle |
| Historical data covered | 2021 - 2024 |
| Base year for estimation | 2025 |
| Forecast period covered | 2026 - 2033 |
| Quantitative units | Revenue in USD million |
| Market segmentation | Light Commercial Vehicle, Heavy Trucks, Buses & Coaches |
| Key market players worldwide | Bosch, Daimler Truck Holding AG ADR, Volkswagen AG, Toyota Motor Corp, Mahindra & Mahindra Ltd DR, Volvo AB ADR, General Motors Co |
Other key industry trends
- In terms of revenue, Asia Pacific region accounted for 24.6% of the global commercial vehicles market in 2025.
- Globally, North America is projected to lead the regional market in terms of revenue in 2033.
- Asia Pacific is the fastest growing regional market and is projected to reach USD 544,437.7 million by 2033.
No credit card required*
Horizon in a snapshot
- 30K+ Global Market Reports
- 120K+ Country Reports
- 1.2M+ Market Statistics
- 200K+ Company Profiles
- Industry insights and more
Commercial Vehicles Market Scope
Commercial Vehicles Market Companies
| Name | Profile | # Employees | HQ | Website |
|---|---|---|---|---|
| Daimler Truck Holding AG ADR | View profile | 104213 | Fasanenweg 10, Leinfelden-Echterdingen, BW, Germany, 70771 | https://www.daimlertruck.com |
| Mahindra & Mahindra Ltd DR | View profile | 61874 | Dr. G. M. Bhosale Marg, Mahindra Towers, 5th Floor, Worli, Mumbai, MH, India, 400 018 | https://www.mahindra.com |
| Bosch | View profile | 10001+ | Stuttgart, Baden-Wurttemberg, Germany, Europe | http://www.bosch.com |
| General Motors Co | View profile | 163000 | 300 Renaissance Center, Detroit, MI, United States, 48265-3000 | https://www.gm.com |
| Volkswagen AG | View profile | 656134 | Berliner Ring 2, Wolfsburg, NI, Germany, 38440 | https://www.volkswagenag.com |
| Toyota Motor Corp | View profile | 380793 | 1 Toyota-cho, Aichi Prefecture, Toyota, Japan, 471-8571 | https://www.global.toyota |
| Volvo AB ADR | View profile | 104905 | Gropegardsgatan 2, Gothenburg, Sweden, 417 15 | https://www.volvogroup.com |
Asia Pacific commercial vehicles market outlook
The databook is designed to serve as a comprehensive guide to navigating this sector. The databook focuses on market statistics denoted in the form of revenue and y-o-y growth and CAGR across the globe and regions. A detailed competitive and opportunity analyses related to commercial vehicles market will help companies and investors design strategic landscapes.
Light commercial vehicle was the largest segment with a revenue share of 48.23% in 2025. Horizon Databook has segmented the Asia Pacific commercial vehicles market based on light commercial vehicle, heavy trucks, buses & coaches covering the revenue growth of each sub-segment from 2021 to 2033.
The robust trade, economic growth, and liberalization policies adopted by several Asian countries such as India, China, Indonesia have resulted in increased trade volumes. The subsequent growth in transportation and warehousing facilities has led to an increase in demand for unified logistics solutions in the region, thereby, driving the sales of commercial vehicles.
China is the one of the world’s largest manufacturing hub and also has a large consumer base. The country is one of the fastest-growing economies which has driven towards large infrastructure projects. Such favorable circumstances provide an opportunity for the Chinese commercial vehicles market.
The Indian commercial vehicles market is expected to grow at a CAGR of 13.8% owing to the implementation of vehicle scrappage program, coupled with stringent implementation of regulatory norms, particularly related to vehicle length and overloading.
Reasons to subscribe to Asia Pacific commercial vehicles market databook:
-
Access to comprehensive data: Horizon Databook provides over 1 million market statistics and 20,000+ reports, offering extensive coverage across various industries and regions.
-
Informed decision making: Subscribers gain insights into market trends, customer preferences, and competitor strategies, empowering informed business decisions.
-
Cost-Effective solution: It's recognized as the world's most cost-effective market research database, offering high ROI through its vast repository of data and reports.
-
Customizable reports: Tailored reports and analytics allow companies to drill down into specific markets, demographics, or product segments, adapting to unique business needs.
-
Strategic advantage: By staying updated with the latest market intelligence, companies can stay ahead of competitors, anticipate industry shifts, and capitalize on emerging opportunities.
Target buyers of Asia Pacific commercial vehicles market databook
-
Our clientele includes a mix of commercial vehicles market companies, investment firms, advisory firms & academic institutions.
-
30% of our revenue is generated working with investment firms and helping them identify viable opportunity areas.
-
Approximately 65% of our revenue is generated working with competitive intelligence & market intelligence teams of market participants (manufacturers, service providers, etc.).
-
The rest of the revenue is generated working with academic and research not-for-profit institutes. We do our bit of pro-bono by working with these institutions at subsidized rates.
Horizon Databook provides a detailed overview of continent-level data and insights on the Asia Pacific commercial vehicles market , including forecasts for subscribers. This continent databook contains high-level insights into Asia Pacific commercial vehicles market from 2021 to 2033, including revenue numbers, major trends, and company profiles.
Partial client list
Asia Pacific commercial vehicles market size, by country, 2021-2033 (US$M)

Asia Pacific Commercial Vehicles Market Outlook Share, 2025 & 2033 (US$M)


Related industry reports
Related statistics
Sign up - it's easy, and free!
Sign up and get instant basic access to databook, upgrade
when ready, or enjoy our
free plan indefinitely.
Included in Horizon account
- 30K+ Global Market Reports
- 120K+ Country Reports
- 1.2M+ Market Statistics
- 200K+ Company Profiles
- Industry insights and more