Asia Pacific Cosmetics Market Size & Outlook, 2026-2033
Related Markets
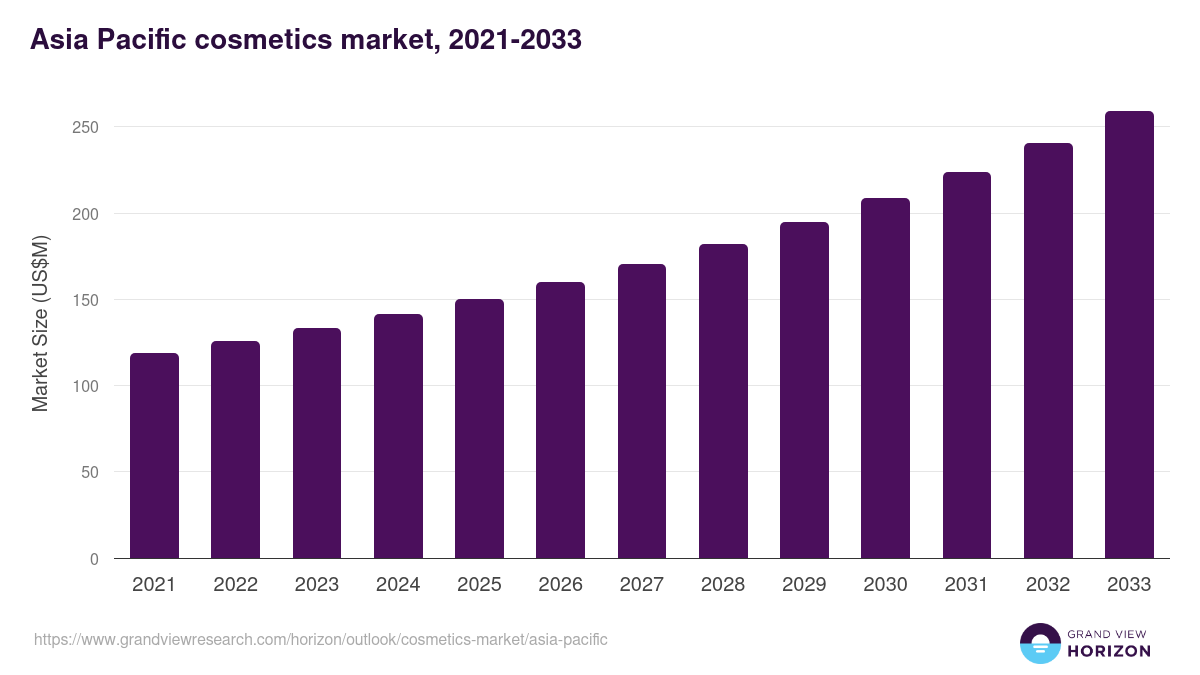
Asia Pacific cosmetics market highlights
- The Asia Pacific cosmetics market generated a revenue of USD 150.2 million in 2025.
- The market is expected to grow at a CAGR of 7.1% from 2026 to 2033.
- In terms of segment, skin care was the largest revenue generating product in 2025.
- Hair Care is the most lucrative product segment registering the fastest growth during the forecast period.
- Country-wise, India is expected to register the highest CAGR from 2026 to 2033.
Asia Pacific data book summary
| Market revenue in 2025 | USD 150.2 million |
| Market revenue in 2033 | USD 259.0 million |
| Growth rate | 7.1% (CAGR from 2026 to 2033) |
| Largest segment | Skin care |
| Fastest growing segment | Hair Care |
| Historical data covered | 2021 - 2024 |
| Base year for estimation | 2025 |
| Forecast period covered | 2026 - 2033 |
| Quantitative units | Revenue in USD million |
| Market segmentation | Skin Care, Hair Care, Makeup, Fragrance |
| Key market players worldwide | Coty Inc Class A, L'Oreal SA, The Estee Lauder Companies Inc Class A, Revlon, Avon Products, Unilever PLC, Seven & i Holdings Co Ltd, Godrej, Procter & Gamble Co, Beiersdorf AG, Henkel AG & Co KGaA, Kao Corp, Mizuno Corp |
Other key industry trends
- In terms of revenue, Asia Pacific region accounted for 45.5% of the global cosmetics market in 2025.
- Globally, Asia Pacific is projected to lead the regional market in terms of revenue in 2033.
- Asia Pacific is the fastest growing regional market and is projected to reach USD 259.0 million by 2033.
No credit card required*
Horizon in a snapshot
- 30K+ Global Market Reports
- 120K+ Country Reports
- 1.2M+ Market Statistics
- 200K+ Company Profiles
- Industry insights and more
Cosmetics Market Scope
Cosmetics Market Companies
| Name | Profile | # Employees | HQ | Website |
|---|---|---|---|---|
| Seven & i Holdings Co Ltd | View profile | 157177 | 8-8, Nibancho, Chiyoda-ku, Tokyo, Japan, 102-8452 | http://www.7andi.com |
| Revlon | View profile | 1001-5000 | New York, New York, United States, North America | https://www.revlonanz.com |
| Avon Products | View profile | 10001+ | London, England, United Kingdom, Europe | https://www.avon.co.in |
| Godrej | View profile | 10001+ | Mumbai, Maharashtra, India, Asia | https://www.godrej.com |
| Mizuno Corp | View profile | 5310 | 1-12-35 Nanko-Kita Suminoe-ku, Osaka-shi, Japan, 559-8510 | http://www.mizuno.co.jp |
| Kao Corp | View profile | 42450 | 14-10, Nihonbashi Kayabacho 1-chome, Chuo-ku, Tokyo, Japan, 103-8210 | http://www.kao.com |
| Henkel AG & Co KGaA | View profile | 48000 | Henkelstrasse 67, Duesseldorf, NW, Germany, 40589 | https://www.henkel.com |
| The Estee Lauder Companies Inc Class A | View profile | 62000 | 767 Fifth Avenue, New York, NY, United States, 10153 | https://www.elcompanies.com |
| L'Oreal SA | View profile | 94605 | 41, Rue Martre, Clichy Cedex, Paris, France, 92117 | https://www.loreal.com |
| Coty Inc Class A | View profile | 11350 | 350 Fifth Avenue, New York, NY, United States, 10118 | https://www.coty.com |
| Beiersdorf AG | View profile | 21958 | Unnastrasse 48, Hamburg, Germany, 22529 | https://www.beiersdorf.com |
| Unilever PLC | View profile | 128377 | 100 Victoria Embankment, London, United Kingdom, EC4Y 0DY | https://www.unilever.com |
| Procter & Gamble Co | View profile | 107000 | One Procter and Gamble Plaza, Cincinnati, OH, United States, 45202 | https://www.pginvestor.com |
Asia Pacific cosmetics market outlook
The databook is designed to serve as a comprehensive guide to navigating this sector. The databook focuses on market statistics denoted in the form of revenue and y-o-y growth and CAGR across the globe and regions. A detailed competitive and opportunity analyses related to cosmetics market will help companies and investors design strategic landscapes.
Skin care was the largest segment with a revenue share of 46.14% in 2025. Horizon Databook has segmented the Asia Pacific cosmetics market based on skin care, hair care, makeup, fragrance covering the revenue growth of each sub-segment from 2021 to 2033.
With growing global environmental consciousness, many consumers in Asia seek sustainable and ecofriendly alternatives. As a result, cosmetic brands across the region are incorporating a wide range of natural ingredients in beauty care products, like green tea, ginseng, rice, aloe vera, and various botanical extracts, to cater to the demand for more sustainable and holistic beauty options.
For example, Unilever’s Indian headquarters is involved in formulating beauty products that consist of natural ingredients. Also, L’Oréal’s Innovation Runway offers beauty industry start-ups a platform to create sustainable and environmentally friendly products.
Regional players in the cosmetics market are expanding their reach by distributing products through local retailers while employing diverse marketing strategies. These efforts aim to capture a broader consumer audience, allowing them to compete effectively in the market.
Reasons to subscribe to Asia Pacific cosmetics market databook:
-
Access to comprehensive data: Horizon Databook provides over 1 million market statistics and 20,000+ reports, offering extensive coverage across various industries and regions.
-
Informed decision making: Subscribers gain insights into market trends, customer preferences, and competitor strategies, empowering informed business decisions.
-
Cost-Effective solution: It's recognized as the world's most cost-effective market research database, offering high ROI through its vast repository of data and reports.
-
Customizable reports: Tailored reports and analytics allow companies to drill down into specific markets, demographics, or product segments, adapting to unique business needs.
-
Strategic advantage: By staying updated with the latest market intelligence, companies can stay ahead of competitors, anticipate industry shifts, and capitalize on emerging opportunities.
Target buyers of Asia Pacific cosmetics market databook
-
Our clientele includes a mix of cosmetics market companies, investment firms, advisory firms & academic institutions.
-
30% of our revenue is generated working with investment firms and helping them identify viable opportunity areas.
-
Approximately 65% of our revenue is generated working with competitive intelligence & market intelligence teams of market participants (manufacturers, service providers, etc.).
-
The rest of the revenue is generated working with academic and research not-for-profit institutes. We do our bit of pro-bono by working with these institutions at subsidized rates.
Horizon Databook provides a detailed overview of continent-level data and insights on the Asia Pacific cosmetics market , including forecasts for subscribers. This continent databook contains high-level insights into Asia Pacific cosmetics market from 2021 to 2033, including revenue numbers, major trends, and company profiles.
Partial client list
Asia Pacific cosmetics market size, by country, 2021-2033 (US$M)

Asia Pacific Cosmetics Market Outlook Share, 2025 & 2033 (US$M)


Related industry reports
Related statistics
Sign up - it's easy, and free!
Sign up and get instant basic access to databook, upgrade
when ready, or enjoy our
free plan indefinitely.
Included in Horizon account
- 30K+ Global Market Reports
- 120K+ Country Reports
- 1.2M+ Market Statistics
- 200K+ Company Profiles
- Industry insights and more