U.S. Iot Devices Market Size & Outlook, 2025-2030
Related Markets
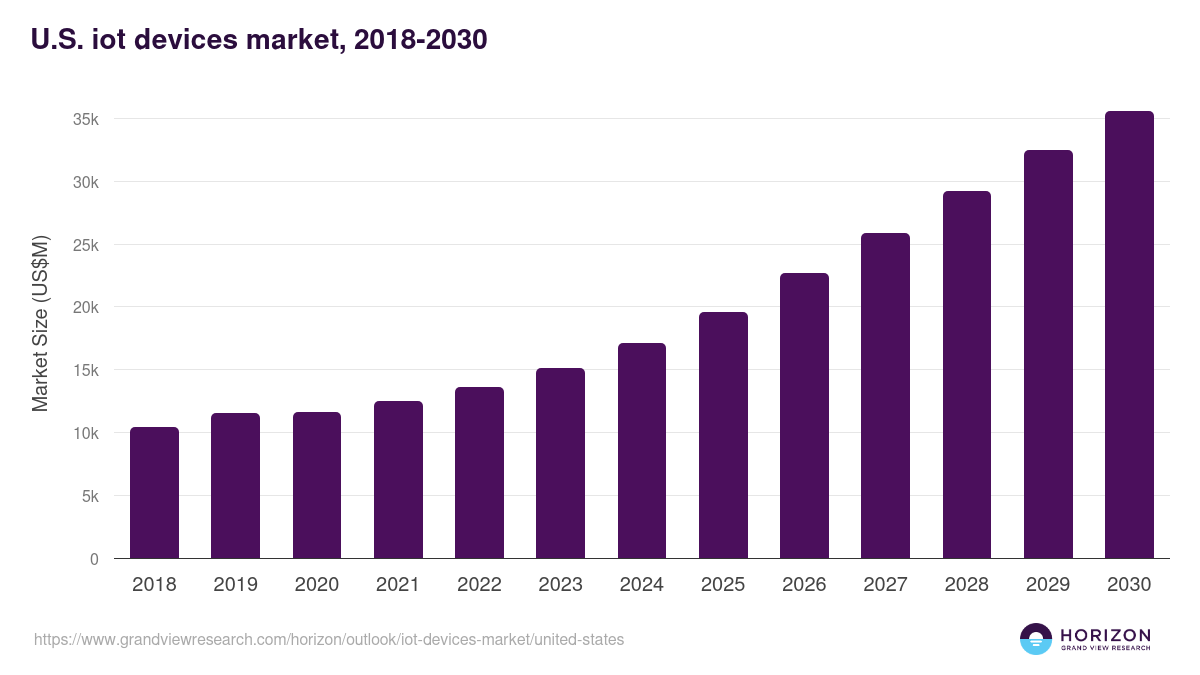
U.S. iot devices market highlights
- The U.S. iot devices market generated a revenue of USD 17,105.8 million in 2024 and is expected to reach USD 35,580.7 million by 2030.
- The U.S. market is expected to grow at a CAGR of 12.7% from 2025 to 2030.
- In terms of segment, sensors was the largest revenue generating component in 2024.
- Edge Devices is the most lucrative component segment registering the fastest growth during the forecast period.
Iot devices market data book summary
| Market revenue in 2024 | USD 17,105.8 million |
| Market revenue in 2030 | USD 35,580.7 million |
| Growth rate | 12.7% (CAGR from 2025 to 2030) |
| Largest segment | Sensors |
| Fastest growing segment | Edge Devices |
| Historical data | 2018 - 2023 |
| Base year | 2024 |
| Forecast period | 2025 - 2030 |
| Quantitative units | Revenue in USD million |
| Market segmentation | Sensors, Actuators, Processors, Edge Devices |
Other key industry trends
- In terms of revenue, U.S. accounted for 24.3% of the global iot devices market in 2024.
- Country-wise, U.S. is expected to lead the global market in terms of revenue in 2030.
- In North America, U.S. iot devices market is projected to lead the regional market in terms of revenue in 2030.
- Canada is the fastest growing regional market in North America and is projected to reach USD 12,730.2 million by 2030.
No credit card required*
Horizon in a snapshot
- 30K+ Global Market Reports
- 120K+ Country Reports
- 1.2M+ Market Statistics
- 200K+ Company Profiles
- Industry insights and more
IoT Devices Market Scope
IoT Devices Market Companies
| Name | Profile | # Employees | HQ | Website |
|---|---|---|---|---|
| Robert Bosch GmbH | View profile | - | - | - |
| ABB Group | View profile | - | - | - |
| PTC Inc | View profile | 7231 | 121 Seaport Boulevard, Boston, MA, United States, 02210 | https://www.ptc.com |
| Huawei Technologies | View profile | 10001+ | Shenzhen, Guangdong, China, Asia | http://huawei.com |
| Sierra Wireless | View profile | 1001-5000 | Richmond, British Columbia, Canada, North America | http://www.sierrawireless.com |
| Silicon Laboratories Inc | View profile | 1846 | 400 West Cesar Chavez, Austin, TX, United States, 78701 | https://www.silabs.com |
| Cisco Systems Inc | View profile | 84900 | 170 West Tasman Drive, San Jose, CA, United States, 95134-1706 | https://www.cisco.com |
| NXP Semiconductors NV | View profile | 34200 | 60 High Tech Campus, Eindhoven, NB, Netherlands, 5656 AG | https://www.nxp.com |
| Qualcomm Inc | View profile | 50000 | 5775 Morehouse Drive, San Diego, CA, United States, 92121-1714 | https://www.qualcomm.com |
| Texas Instruments Inc | View profile | 34000 | 12500 TI Boulevard, Dallas, TX, United States, 75243 | https://www.ti.com |
| Samsung Electronics Co Ltd | View profile | 124804 | 129, Samsung-ro, Yeongtong-gu, Gyeonggi-do, Suwon-si, Korea, Republic of, 443-742 | https://www.samsung.com |
| Honeywell International Inc | View profile | 95000 | 855 South Mint Street, Charlotte, NC, United States, 28202 | https://www.honeywell.com |
| STMicroelectronics NV | View profile | 51323 | 39, Chemin du Champ des Filles, Plan-Les-Ouates, Geneva, Switzerland, 1228 | https://www.st.com |
| Siemens Healthineers AG ADR | View profile | 71400 | Siemensstr. 3, Forchheim, BY, Germany, 91301 | https://www.siemens-healthineers.com |
| Intel Corp | View profile | 124800 | 2200 Mission College Boulevard, Santa Clara, CA, United States, 95054-1549 | https://www.intel.com |
U.S. iot devices market outlook
The databook is designed to serve as a comprehensive guide to navigating this sector. The databook focuses on market statistics denoted in the form of revenue and y-o-y growth and CAGR across the globe and regions. A detailed competitive and opportunity analyses related to iot devices market will help companies and investors design strategic landscapes.
Sensors was the largest segment with a revenue share of 37.06% in 2024. Horizon Databook has segmented the U.S. iot devices market based on sensors, actuators, processors, edge devices covering the revenue growth of each sub-segment from 2018 to 2030.
IoT device adoption trends in the U.S. have been growing steadily across various sectors, driven by advancements in connectivity, data analytics, and automation. The increasing integration of IoT devices is reshaping industries such as healthcare, manufacturing, agriculture, smart cities, and transportation.
The U.S. has witnessed a surge in the adoption of IoT devices in healthcare, especially with the rise of telemedicine and remote patient monitoring.
Devices such as smartwatches, blood pressure monitors, glucose monitors, and smart pill bottles are enabling patients to manage chronic conditions and improve health outcomes. These devices allow healthcare providers to monitor patients remotely and provide timely interventions.
Reasons to subscribe to U.S. iot devices market databook:
-
Access to comprehensive data: Horizon Databook provides over 1 million market statistics and 20,000+ reports, offering extensive coverage across various industries and regions.
-
Informed decision making: Subscribers gain insights into market trends, customer preferences, and competitor strategies, empowering informed business decisions.
-
Cost-Effective solution: It's recognized as the world's most cost-effective market research database, offering high ROI through its vast repository of data and reports.
-
Customizable reports: Tailored reports and analytics allow companies to drill down into specific markets, demographics, or product segments, adapting to unique business needs.
-
Strategic advantage: By staying updated with the latest market intelligence, companies can stay ahead of competitors, anticipate industry shifts, and capitalize on emerging opportunities.
Target buyers of U.S. iot devices market databook
-
Our clientele includes a mix of iot devices market companies, investment firms, advisory firms & academic institutions.
-
30% of our revenue is generated working with investment firms and helping them identify viable opportunity areas.
-
Approximately 65% of our revenue is generated working with competitive intelligence & market intelligence teams of market participants (manufacturers, service providers, etc.).
-
The rest of the revenue is generated working with academic and research not-for-profit institutes. We do our bit of pro-bono by working with these institutions at subsidized rates.
Horizon Databook provides a detailed overview of country-level data and insights on the U.S. iot devices market , including forecasts for subscribers. This country databook contains high-level insights into U.S. iot devices market from 2018 to 2030, including revenue numbers, major trends, and company profiles.
Partial client list
U.S. iot devices market size, by component, 2018-2030 (US$M)

U.S. IoT Devices Market Outlook Share, 2024 & 2030 (US$M)


Related statistics
Sign up - it's easy, and free!
Sign up and get instant basic access to databook, upgrade
when ready, or enjoy our
free plan indefinitely.
Included in Horizon account
- 30K+ Global Market Reports
- 120K+ Country Reports
- 1.2M+ Market Statistics
- 200K+ Company Profiles
- Industry insights and more