Asia Pacific Licensed Sports Merchandise Market Size & Outlook
Related Markets
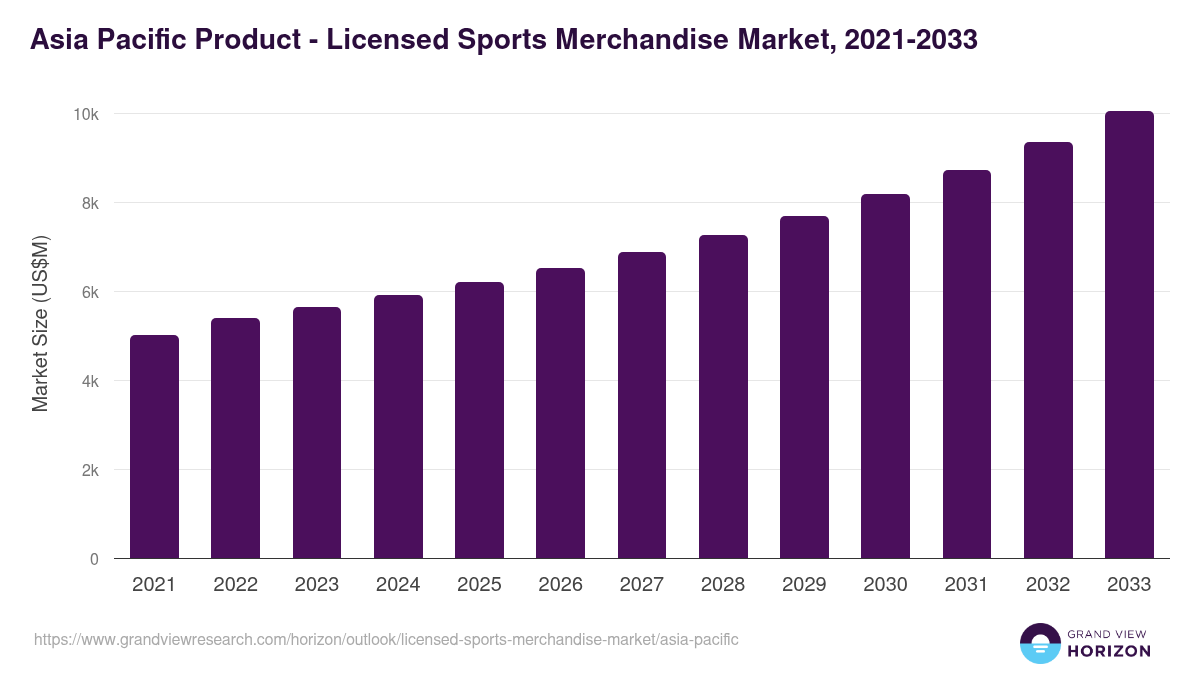
Asia Pacific licensed sports merchandise market highlights
- The Asia Pacific licensed sports merchandise market generated a revenue of USD 6,209.6 million in 2025.
- The market is expected to grow at a CAGR of 6.4% from 2026 to 2033.
- In terms of segment, toys and games was the largest revenue generating product in 2025.
- Sports Footwear is the most lucrative product segment registering the fastest growth during the forecast period.
- Country-wise, China is expected to register the highest CAGR from 2026 to 2033.
Asia Pacific data book summary
| Market revenue in 2025 | USD 6,209.6 million |
| Market revenue in 2033 | USD 10,050.6 million |
| Growth rate | 6.4% (CAGR from 2026 to 2033) |
| Largest segment | Toys and games |
| Fastest growing segment | Sports Footwear |
| Historical data covered | 2021 - 2024 |
| Base year for estimation | 2025 |
| Forecast period covered | 2026 - 2033 |
| Quantitative units | Revenue in USD million |
| Market segmentation | Sports Apparel, Sports Footwear, Toys and Games |
| Key market players worldwide | VF Corp, Nike Inc Class B, Adidas AG, Puma SE, Under Armour Inc Class A, Hanesbrands Inc, Dick's Sporting Goods Inc, MASH Holdings Japan, G-III Apparel Group Ltd, Kynetic |
Other key industry trends
- In terms of revenue, Asia Pacific region accounted for 16.4% of the global licensed sports merchandise market in 2025.
- Globally, North America is projected to lead the regional market in terms of revenue in 2033.
- Asia Pacific is the fastest growing regional market and is projected to reach USD 10,050.6 million by 2033.
No credit card required*
Horizon in a snapshot
- 30K+ Global Market Reports
- 120K+ Country Reports
- 1.2M+ Market Statistics
- 200K+ Company Profiles
- Industry insights and more
Licensed Sports Merchandise Market Scope
Licensed Sports Merchandise Market Companies
| Name | Profile | # Employees | HQ | Website |
|---|---|---|---|---|
| Kynetic | View profile | 501-1000 | Conshohocken, Pennsylvania, United States, North America | http://www.kynetic.com |
| G-III Apparel Group Ltd | View profile | 4600 | 512 Seventh Avenue, New York, NY, United States, 10018 | https://www.g-iii.com |
| MASH Holdings Japan | View profile | - | Tokyo, Tokyo, Japan, Asia | http://www.mash-holdings.com/ |
| Dick's Sporting Goods Inc | View profile | 55500 | 345 Court Street, Coraopolis, PA, United States, 15108 | https://www.dickssportinggoods.com |
| Hanesbrands Inc | View profile | 48000 | 1000 East Hanes Mill Road, Winston-Salem, NC, United States, 27105 | https://www.hanes.com |
| Puma SE | View profile | 21164 | Puma Way 1, Herzogenaurach, BY, Germany, 91074 | https://www.puma.com |
| Adidas AG | View profile | 59030 | Adi-Dassler-Strasse 1, Herzogenaurach, BY, Germany, 91074 | https://www.adidas-group.com |
| Nike Inc Class B | View profile | 83700 | One Bowerman Drive, Beaverton, OR, United States, 97005-6453 | https://www.nike.com |
| VF Corp | View profile | 33000 | 1551 Wewatta Street, Denver, CO, United States, 80202 | https://www.vfc.com |
| Under Armour Inc Class A | View profile | 14800 | 1020 Hull Street, Baltimore, MD, United States, 21230 | https://www.underarmour.com |
Asia Pacific licensed sports merchandise market outlook
The databook is designed to serve as a comprehensive guide to navigating this sector. The databook focuses on market statistics denoted in the form of revenue and y-o-y growth and CAGR across the globe and regions. A detailed competitive and opportunity analyses related to licensed sports merchandise market will help companies and investors design strategic landscapes.
Toys and games was the largest segment with a revenue share of 33.16% in 2025. Horizon Databook has segmented the Asia Pacific licensed sports merchandise market based on sports apparel, sports footwear, toys and games covering the revenue growth of each sub-segment from 2021 to 2033.
Several factors contribute to the popularity of licensed sports merchandise and market growth in Asia Pacific. The increasing popularity and fan base of different sports in the region play a significant role. Asia Pacific is home to numerous passionate sports enthusiasts who closely follow various sports, including football, cricket, and basketball.
Reasons to subscribe to Asia Pacific licensed sports merchandise market databook:
-
Access to comprehensive data: Horizon Databook provides over 1 million market statistics and 20,000+ reports, offering extensive coverage across various industries and regions.
-
Informed decision making: Subscribers gain insights into market trends, customer preferences, and competitor strategies, empowering informed business decisions.
-
Cost-Effective solution: It's recognized as the world's most cost-effective market research database, offering high ROI through its vast repository of data and reports.
-
Customizable reports: Tailored reports and analytics allow companies to drill down into specific markets, demographics, or product segments, adapting to unique business needs.
-
Strategic advantage: By staying updated with the latest market intelligence, companies can stay ahead of competitors, anticipate industry shifts, and capitalize on emerging opportunities.
Target buyers of Asia Pacific licensed sports merchandise market databook
-
Our clientele includes a mix of licensed sports merchandise market companies, investment firms, advisory firms & academic institutions.
-
30% of our revenue is generated working with investment firms and helping them identify viable opportunity areas.
-
Approximately 65% of our revenue is generated working with competitive intelligence & market intelligence teams of market participants (manufacturers, service providers, etc.).
-
The rest of the revenue is generated working with academic and research not-for-profit institutes. We do our bit of pro-bono by working with these institutions at subsidized rates.
Horizon Databook provides a detailed overview of continent-level data and insights on the Asia Pacific licensed sports merchandise market , including forecasts for subscribers. This continent databook contains high-level insights into Asia Pacific licensed sports merchandise market from 2021 to 2033, including revenue numbers, major trends, and company profiles.
Partial client list
Asia Pacific licensed sports merchandise market report size, by country, 2021-2033 (US$M)

Asia Pacific Licensed Sports Merchandise Market Outlook Share, 2025 & 2033 (US$M)


Related statistics
Sign up - it's easy, and free!
Sign up and get instant basic access to databook, upgrade
when ready, or enjoy our
free plan indefinitely.
Included in Horizon account
- 30K+ Global Market Reports
- 120K+ Country Reports
- 1.2M+ Market Statistics
- 200K+ Company Profiles
- Industry insights and more