Asia Pacific Non-alcoholic Beverages Market Size & Outlook
Related Markets
Asia Pacific non-alcoholic beverages market highlights
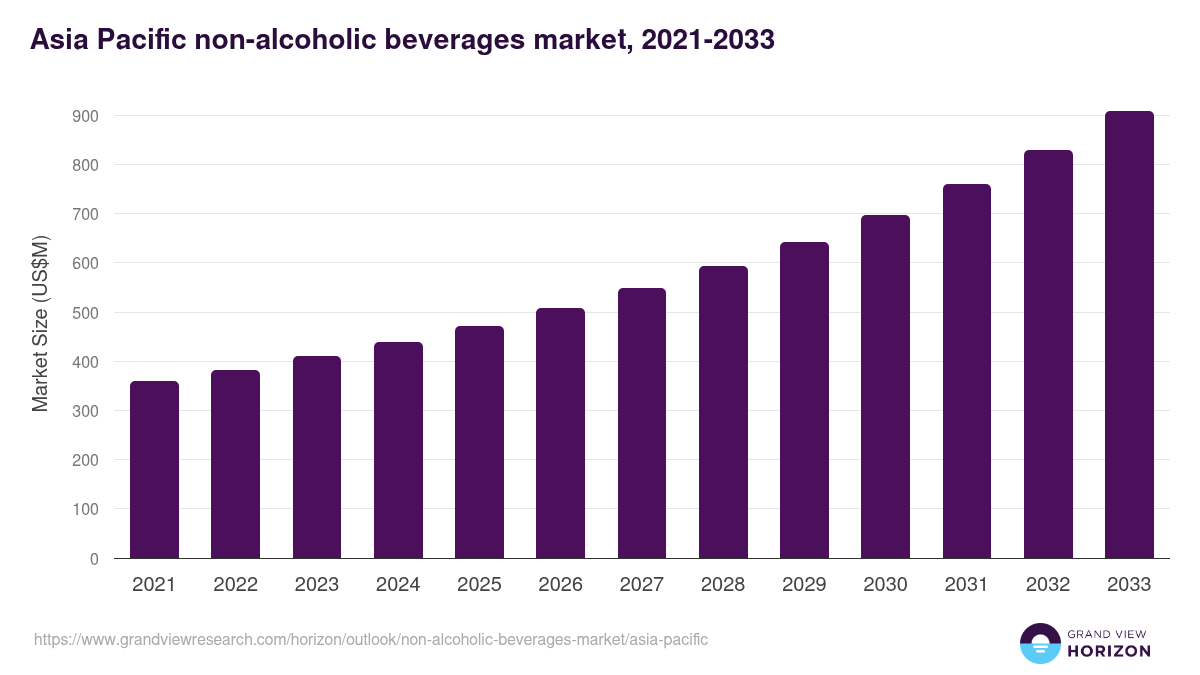
- The Asia Pacific non-alcoholic beverages market generated a revenue of USD 471.5 million in 2025.
- The market is expected to grow at a CAGR of 8.7% from 2026 to 2033.
- In terms of segment, carbonated soft drinks was the largest revenue generating product in 2025.
- Functional Beverages is the most lucrative product segment registering the fastest growth during the forecast period.
- Country-wise, China is expected to register the highest CAGR from 2026 to 2033.
Asia Pacific data book summary
| Market revenue in 2025 | USD 471.5 million |
| Market revenue in 2033 | USD 907.9 million |
| Growth rate | 8.7% (CAGR from 2026 to 2033) |
| Largest segment | Carbonated soft drinks |
| Fastest growing segment | Functional Beverages |
| Historical data covered | 2021 - 2024 |
| Base year for estimation | 2025 |
| Forecast period covered | 2026 - 2033 |
| Quantitative units | Revenue in USD million |
| Market segmentation | Carbonated Soft Drinks, Bottled Water, RTD Tea & Coffee, Functional Beverages, Juices, Dairy based Beverages |
| Key market players worldwide | Nestle SA, PepsiCo Inc, Unilever PLC, Keurig Dr Pepper Inc, Coca-Cola Co, Jones Soda Co, Danone SA, Suntory Beverage & Food Ltd, Asahi Group Holdings Ltd, Red Bull |
Other key industry trends
- In terms of revenue, Asia Pacific region accounted for 33.9% of the global non-alcoholic beverages market in 2025.
- Globally, Asia Pacific is projected to lead the regional market in terms of revenue in 2033.
- Asia Pacific is the fastest growing regional market and is projected to reach USD 907.9 million by 2033.
No credit card required*
Horizon in a snapshot
- 30K+ Global Market Reports
- 120K+ Country Reports
- 1.2M+ Market Statistics
- 200K+ Company Profiles
- Industry insights and more
Non-alcoholic Beverages Market Scope
Non-alcoholic Beverages Market Companies
| Name | Profile | # Employees | HQ | Website |
|---|---|---|---|---|
| Red Bull | View profile | 10001+ | Fuschl Am See, Salzburg, Austria, Europe | https://redbull.com |
| Coca-Cola Co | View profile | 79100 | One Coca-Cola Plaza, Atlanta, GA, United States, 30313 | https://www.coca-colacompany.com |
| Jones Soda Co | View profile | 27 | 4786 1st Avenue South, Suite 103, Seattle, WA, United States, 98134 | https://www.jonessoda.com |
| Keurig Dr Pepper Inc | View profile | 28100 | 53 South Avenue, Burlington, MA, United States, 01803 | https://www.keurigdrpepper.com |
| Asahi Group Holdings Ltd | View profile | 34728 | 1-23-1, Azumabashi, Sumida-ku, Tokyo, Japan, 130-8602 | http://www.asahigroup-holdings.com |
| Suntory Beverage & Food Ltd | View profile | 24641 | 3-1-1 Kyobashi, Tokyo Square Garden, Chuo-ku, Tokyo, Japan, 104-0031 | http://www.suntory.co.jp |
| Unilever PLC | View profile | 128377 | 100 Victoria Embankment, London, United Kingdom, EC4Y 0DY | https://www.unilever.com |
| PepsiCo Inc | View profile | 318000 | 700 Anderson Hill Road, Purchase, NY, United States, 10577 | https://www.pepsico.com |
| Danone SA | View profile | 88843 | 17, Boulevard Haussmann, Paris, France, 75009 | https://www.danone.com |
| Nestle SA | View profile | 270000 | Avenue Nestle 55, Vevey, Switzerland, CH-1800 | https://www.nestle.com |
Asia Pacific non-alcoholic beverages market outlook
The databook is designed to serve as a comprehensive guide to navigating this sector. The databook focuses on market statistics denoted in the form of revenue and y-o-y growth and CAGR across the globe and regions. A detailed competitive and opportunity analyses related to non-alcoholic beverages market will help companies and investors design strategic landscapes.
Carbonated soft drinks was the largest segment with a revenue share of 24.77% in 2025. Horizon Databook has segmented the Asia Pacific non-alcoholic beverages market based on carbonated soft drinks, bottled water, rtd tea & coffee, functional beverages, juices, dairy based beverages covering the revenue growth of each sub-segment from 2021 to 2033.
The Asia Pacific region, particularly its emerging and developing markets, is a significant contributor to the volume and value growth of the non-alcoholic drinks market. This growth spans various categories, including soft and hot drinks and dairy and its alternatives.
The growing awareness of the need for an active lifestyle, given the prevalence of lifestyle diseases, has encouraged consumers to opt for healthy and sugar-free drinks. In addition, the high prevalence of lactose intolerance in countries like Japan and South Korea has driven the demand for alternative dairy beverages.
A large group of millennials and Gen Z population across Asia tends to favor unique and innovative non-alcoholic beverage choices like bubble tea, energy drinks, artisanal coffees, and juices. For instance, in September 2022, Taiwanese instant DIY bubble tea brand BOBA CHiC expanded its operations internationally.
Reasons to subscribe to Asia Pacific non-alcoholic beverages market databook:
-
Access to comprehensive data: Horizon Databook provides over 1 million market statistics and 20,000+ reports, offering extensive coverage across various industries and regions.
-
Informed decision making: Subscribers gain insights into market trends, customer preferences, and competitor strategies, empowering informed business decisions.
-
Cost-Effective solution: It's recognized as the world's most cost-effective market research database, offering high ROI through its vast repository of data and reports.
-
Customizable reports: Tailored reports and analytics allow companies to drill down into specific markets, demographics, or product segments, adapting to unique business needs.
-
Strategic advantage: By staying updated with the latest market intelligence, companies can stay ahead of competitors, anticipate industry shifts, and capitalize on emerging opportunities.
Target buyers of Asia Pacific non-alcoholic beverages market databook
-
Our clientele includes a mix of non-alcoholic beverages market companies, investment firms, advisory firms & academic institutions.
-
30% of our revenue is generated working with investment firms and helping them identify viable opportunity areas.
-
Approximately 65% of our revenue is generated working with competitive intelligence & market intelligence teams of market participants (manufacturers, service providers, etc.).
-
The rest of the revenue is generated working with academic and research not-for-profit institutes. We do our bit of pro-bono by working with these institutions at subsidized rates.
Horizon Databook provides a detailed overview of continent-level data and insights on the Asia Pacific non-alcoholic beverages market , including forecasts for subscribers. This continent databook contains high-level insights into Asia Pacific non-alcoholic beverages market from 2021 to 2033, including revenue numbers, major trends, and company profiles.
Partial client list
Asia Pacific non-alcoholic beverages market size, by country, 2021-2033 (US$M)

Asia Pacific Non-alcoholic Beverages Market Outlook Share, 2025 & 2033 (US$M)


Related statistics
Sign up - it's easy, and free!
Sign up and get instant basic access to databook, upgrade
when ready, or enjoy our
free plan indefinitely.
Included in Horizon account
- 30K+ Global Market Reports
- 120K+ Country Reports
- 1.2M+ Market Statistics
- 200K+ Company Profiles
- Industry insights and more