U.S. Physical Vapor Deposition Market Size & Outlook
Related Markets
U.S. physical vapor deposition market highlights
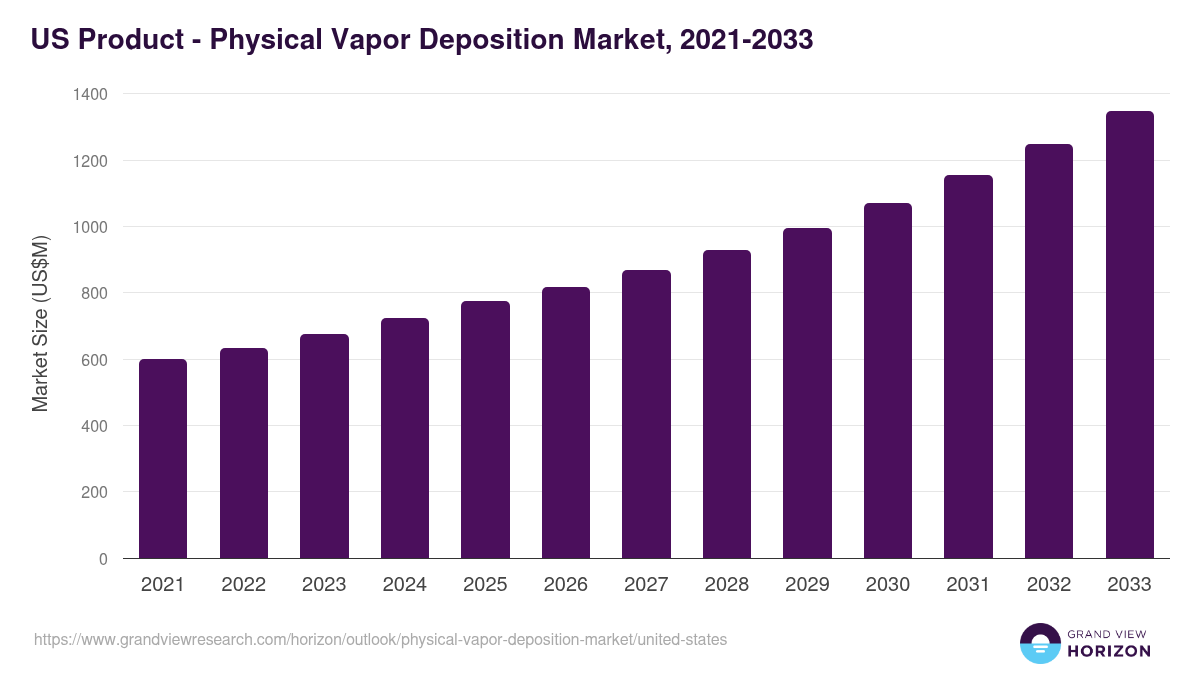
- The U.S. physical vapor deposition market generated a revenue of USD 774.2 million in 2025 and is expected to reach USD 1,347.2 million by 2033.
- The U.S. market is expected to grow at a CAGR of 7.4% from 2026 to 2033.
- In terms of segment, sputter deposition was the largest revenue generating product in 2025.
- Arc Vapor Deposition is the most lucrative product segment registering the fastest growth during the forecast period.
Physical vapor deposition market data book summary
| Market revenue in 2025 | USD 774.2 million |
| Market revenue in 2033 | USD 1,347.2 million |
| Growth rate | 7.4% (CAGR from 2026 to 2033) |
| Largest segment | Sputter deposition |
| Fastest growing segment | Arc Vapor Deposition |
| Historical data | 2021 - 2024 |
| Base year | 2025 |
| Forecast period | 2026 - 2033 |
| Quantitative units | Revenue in USD million |
| Market segmentation | Thermal Evaporation, Sputter Deposition, Arc Vapor Deposition |
| Key market players worldwide | Applied Materials Inc, Advanced Energy Industries Inc, OC Oerlikon Corp AG, Pfaffikon ADR, Angstrom Engineering, Kurt J. Lesker Company, Voestalpine AG, IHI Corp, Kobe Steel Ltd |
Other key industry trends
- In terms of revenue, U.S. accounted for 22.4% of the global physical vapor deposition market in 2025.
- Country-wise, China is expected to lead the global market in terms of revenue in 2033.
- In North America, U.S. physical vapor deposition market is projected to lead the regional market in terms of revenue in 2033.
- Mexico is the fastest growing regional market in North America and is projected to reach USD 107.3 million by 2033.
No credit card required*
Horizon in a snapshot
- 30K+ Global Market Reports
- 120K+ Country Reports
- 1.2M+ Market Statistics
- 200K+ Company Profiles
- Industry insights and more
Physical Vapor Deposition Market Scope
Physical Vapor Deposition Market Companies
| Name | Profile | # Employees | HQ | Website |
|---|---|---|---|---|
| Angstrom Engineering | View profile | 101-250 | Kitchener, Ontario, Canada, North America | https://www.angstromengineering.com |
| Kurt J. Lesker Company | View profile | 251-500 | Pennsylvania Furnace, Pennsylvania, United States, North America | http://lesker.com |
| Advanced Energy Industries Inc | View profile | 10000 | 1595 Wynkoop Street, Suite 800, Denver, CO, United States, 80202 | https://www.advancedenergy.com |
| Voestalpine AG | View profile | 50712 | Voestalpine-Strasse 1, Linz, Austria, 4020 | https://www.voestalpine.com |
| Kobe Steel Ltd | View profile | 44938 | 2-4, Wakinohama-Kaigandori 2-chome, Chuo-ku, Kobe, Hyogo, Japan, 651-8585 | http://www.kobelco.co.jp |
| IHI Corp | View profile | 28486 | 1-1, Toyosu 3-chome, Koto-ku, Tokyo, Japan, 135-8710 | http://www.ihi.co.jp |
| Applied Materials Inc | View profile | 34000 | 3050 Bowers Avenue, P.O. Box 58039, Santa Clara, CA, United States, 95052-8039 | https://www.appliedmaterials.com |
| OC Oerlikon Corp AG, Pfaffikon ADR | View profile | 12620 | Churerstrasse 120, Pfaffikon, Switzerland, 8808 | https://www.oerlikon.com |
U.S. physical vapor deposition market outlook
The databook is designed to serve as a comprehensive guide to navigating this sector. The databook focuses on market statistics denoted in the form of revenue and y-o-y growth and CAGR across the globe and regions. A detailed competitive and opportunity analyses related to physical vapor deposition market will help companies and investors design strategic landscapes.
Sputter deposition was the largest segment with a revenue share of 50.41% in 2025. Horizon Databook has segmented the U.S. physical vapor deposition market based on thermal evaporation, sputter deposition, arc vapor deposition covering the revenue growth of each sub-segment from 2021 to 2033.
The increasing demand for high-quality and high-performance materials in the aerospace industry has been a significant driver for using PVD. The aerospace industry in the U.S. constantly pushes the boundaries of innovation to enhance aircraft performance, reduce fuel consumption, and improve overall efficiency.
PVD techniques are essential for depositing thin films of material onto semiconductor wafers, a process crucial for the fabrication of integrated circuits and other electronic components. The demand for PVD is further amplified by the global surge in consumer electronics, electric vehicles, and renewable energy technologies, all of which rely heavily on semiconductors.
Governments and regulatory bodies in North America introduced favorable policies and incentives to promote the adoption of solar energy. Subsidies, tax credits, and feed-in tariffs have significantly boosted the installation of solar products, stimulating the demand for high-quality and cost-efficient thin-film solar cells manufactured using PVD technology.
Reasons to subscribe to U.S. physical vapor deposition market databook:
-
Access to comprehensive data: Horizon Databook provides over 1 million market statistics and 20,000+ reports, offering extensive coverage across various industries and regions.
-
Informed decision making: Subscribers gain insights into market trends, customer preferences, and competitor strategies, empowering informed business decisions.
-
Cost-Effective solution: It's recognized as the world's most cost-effective market research database, offering high ROI through its vast repository of data and reports.
-
Customizable reports: Tailored reports and analytics allow companies to drill down into specific markets, demographics, or product segments, adapting to unique business needs.
-
Strategic advantage: By staying updated with the latest market intelligence, companies can stay ahead of competitors, anticipate industry shifts, and capitalize on emerging opportunities.
Target buyers of U.S. physical vapor deposition market databook
-
Our clientele includes a mix of physical vapor deposition market companies, investment firms, advisory firms & academic institutions.
-
30% of our revenue is generated working with investment firms and helping them identify viable opportunity areas.
-
Approximately 65% of our revenue is generated working with competitive intelligence & market intelligence teams of market participants (manufacturers, service providers, etc.).
-
The rest of the revenue is generated working with academic and research not-for-profit institutes. We do our bit of pro-bono by working with these institutions at subsidized rates.
Horizon Databook provides a detailed overview of country-level data and insights on the U.S. physical vapor deposition market , including forecasts for subscribers. This country databook contains high-level insights into U.S. physical vapor deposition market from 2021 to 2033, including revenue numbers, major trends, and company profiles.
Partial client list
US Product - Physical Vapor Deposition Market size, 2025 - 2033 (US$M)

U.S. Physical Vapor Deposition Market Outlook Share, 2025 & 2033 (US$M)


Related statistics
Sign up - it's easy, and free!
Sign up and get instant basic access to databook, upgrade
when ready, or enjoy our
free plan indefinitely.
Included in Horizon account
- 30K+ Global Market Reports
- 120K+ Country Reports
- 1.2M+ Market Statistics
- 200K+ Company Profiles
- Industry insights and more