Asia Pacific Poly-l-lactic Acid (plla) Filler Market Size & Outlook
Related Markets
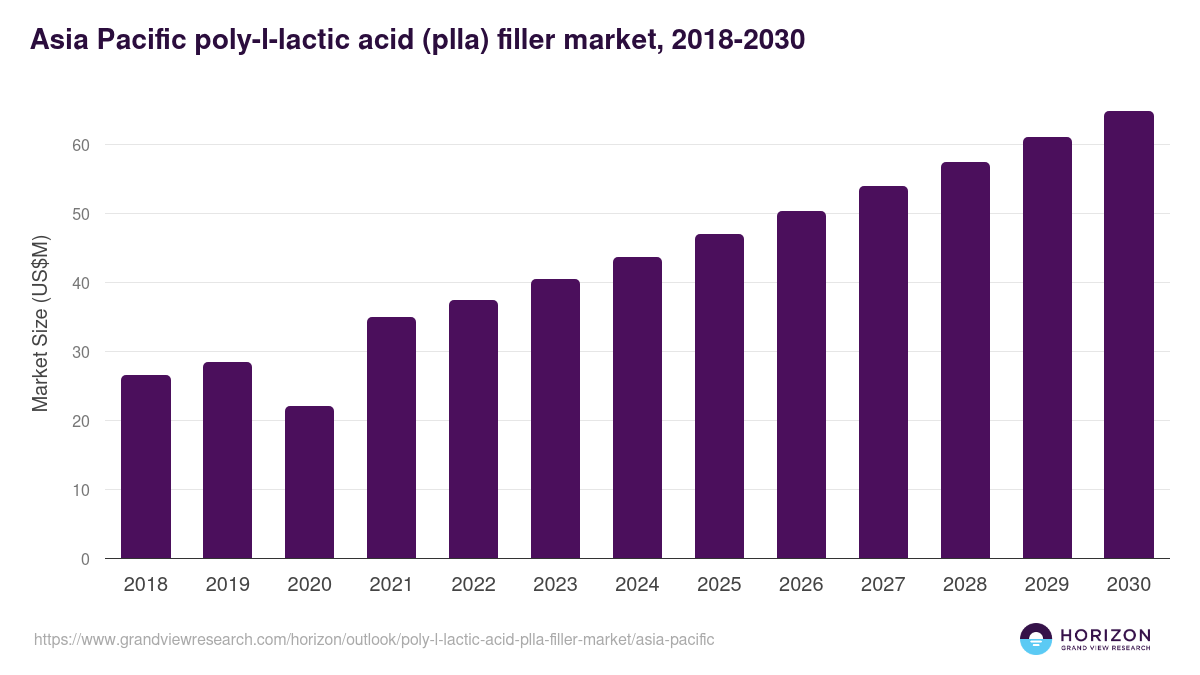
Asia Pacific poly-l-lactic acid (plla) filler market highlights
- The Asia Pacific poly-l-lactic acid (plla) filler market generated a revenue of USD 43.7 million in 2024.
- The market is expected to grow at a CAGR of 6.6% from 2025 to 2030.
- In terms of segment, face was the largest revenue generating application in 2024.
- Face is the most lucrative application segment registering the fastest growth during the forecast period.
- Country-wise, China is expected to register the highest CAGR from 2025 to 2030.
Asia Pacific data book summary
| Market revenue in 2024 | USD 43.7 million |
| Market revenue in 2030 | USD 64.8 million |
| Growth rate | 6.6% (CAGR from 2025 to 2030) |
| Largest segment | Face |
| Fastest growing segment | Face |
| Historical data covered | 2018 - 2023 |
| Base year for estimation | 2024 |
| Forecast period covered | 2025 - 2030 |
| Quantitative units | Revenue in USD million |
| Market segmentation | Face, Neck, Abdomen, Knees, Thighs |
| Key market players worldwide | Galderma, Sinclair Pharma plc, GANA, PRP Concepts, Hymax |
Other key industry trends
- In terms of revenue, Asia Pacific region accounted for 22.6% of the global poly-l-lactic acid (plla) filler market in 2024.
- Globally, North America is projected to lead the regional market in terms of revenue in 2030.
- Asia Pacific is the fastest growing regional market and is projected to reach USD 64.8 million by 2030.
No credit card required*
Horizon in a snapshot
- 30K+ Global Market Reports
- 120K+ Country Reports
- 1.2M+ Market Statistics
- 200K+ Company Profiles
- Industry insights and more
Poly-L-lactic Acid (PLLA) Filler Market Scope
Poly-L-lactic Acid (PLLA) Filler Market Companies
| Name | Profile | # Employees | HQ | Website |
|---|---|---|---|---|
| Hangzhou Singclean Medical Products Co. | View profile | 101-250 | Hangzhou, Zhejiang, China, Asia | https://www.singclean.net |
| Dermax | View profile | 51-100 | Shijiazhuang, Hebei, China, Asia | https://dermaxmed.com |
| Galderma | View profile | 10001+ | Lausanne, Vaud, Switzerland, Europe | http://www.galderma.com |
| PRP Concepts | View profile | 11-50 | Middletown, New Jersey, United States, North America | https://prpconcepts.com/ |
| Sinclair Pharma plc | View profile | 501-1000 | London, England, United Kingdom, Europe | http://www.sinclairpharma.com/ |
Asia Pacific poly-l-lactic acid (plla) filler market outlook
The databook is designed to serve as a comprehensive guide to navigating this sector. The databook focuses on market statistics denoted in the form of revenue and y-o-y growth and CAGR across the globe and regions. A detailed competitive and opportunity analyses related to poly-l-lactic acid (plla) filler market will help companies and investors design strategic landscapes.
Face was the largest segment with a revenue share of 49.2% in 2024. Horizon Databook has segmented the Asia Pacific poly-l-lactic acid (plla) filler market based on face, neck, abdomen, knees, thighs covering the revenue growth of each sub-segment from 2018 to 2030.
Reasons to subscribe to Asia Pacific poly-l-lactic acid (plla) filler market databook:
-
Access to comprehensive data: Horizon Databook provides over 1 million market statistics and 20,000+ reports, offering extensive coverage across various industries and regions.
-
Informed decision making: Subscribers gain insights into market trends, customer preferences, and competitor strategies, empowering informed business decisions.
-
Cost-Effective solution: It's recognized as the world's most cost-effective market research database, offering high ROI through its vast repository of data and reports.
-
Customizable reports: Tailored reports and analytics allow companies to drill down into specific markets, demographics, or product segments, adapting to unique business needs.
-
Strategic advantage: By staying updated with the latest market intelligence, companies can stay ahead of competitors, anticipate industry shifts, and capitalize on emerging opportunities.
Target buyers of Asia Pacific poly-l-lactic acid (plla) filler market databook
-
Our clientele includes a mix of poly-l-lactic acid (plla) filler market companies, investment firms, advisory firms & academic institutions.
-
30% of our revenue is generated working with investment firms and helping them identify viable opportunity areas.
-
Approximately 65% of our revenue is generated working with competitive intelligence & market intelligence teams of market participants (manufacturers, service providers, etc.).
-
The rest of the revenue is generated working with academic and research not-for-profit institutes. We do our bit of pro-bono by working with these institutions at subsidized rates.
Horizon Databook provides a detailed overview of continent-level data and insights on the Asia Pacific poly-l-lactic acid (plla) filler market , including forecasts for subscribers. This continent databook contains high-level insights into Asia Pacific poly-l-lactic acid (plla) filler market from 2018 to 2030, including revenue numbers, major trends, and company profiles.
Partial client list
Asia Pacific poly-l-lactic acid (plla) filler market size, by country, 2018-2030 (US$M)

Asia Pacific Poly-L-lactic Acid (PLLA) Filler Market Outlook Share, 2024 & 2030 (US$M)


Related industry reports
Related statistics
Sign up - it's easy, and free!
Sign up and get instant basic access to databook, upgrade
when ready, or enjoy our
free plan indefinitely.
Included in Horizon account
- 30K+ Global Market Reports
- 120K+ Country Reports
- 1.2M+ Market Statistics
- 200K+ Company Profiles
- Industry insights and more