Middle East & Africa Quantum Dots Market Size & Outlook
Related Markets
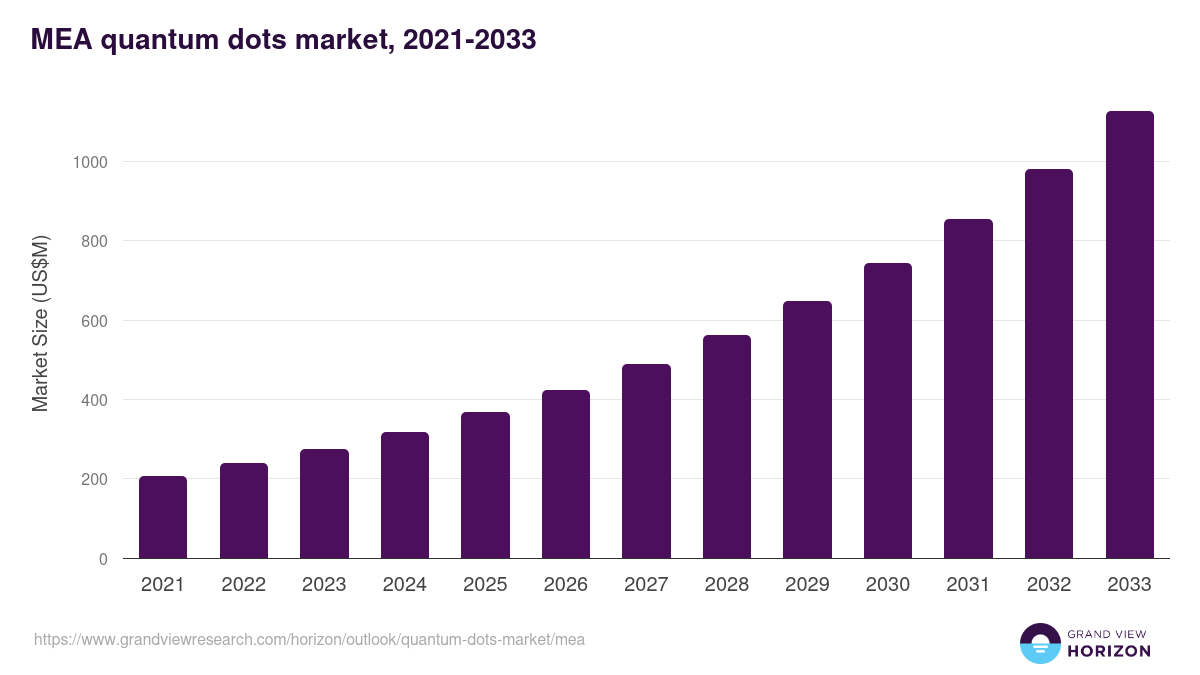
MEA quantum dots market highlights
- The MEA quantum dots market generated a revenue of USD 318.8 million in 2024.
- The market is expected to grow at a CAGR of 15% from 2025 to 2033.
- In terms of segment, core type qds was the largest revenue generating product in 2024.
- Core shell QDs is the most lucrative product segment registering the fastest growth during the forecast period.
MEA data book summary
| Market revenue in 2024 | USD 318.8 million |
| Market revenue in 2033 | USD 1,126.6 million |
| Growth rate | 15% (CAGR from 2025 to 2033) |
| Largest segment | Core type qds |
| Fastest growing segment | Core shell QDs |
| Historical data covered | 2021 - 2023 |
| Base year for estimation | 2024 |
| Forecast period covered | 2025 - 2033 |
| Quantitative units | Revenue in USD million |
| Market segmentation | Core type QDs, Core shell QDs |
Other key industry trends
- In terms of revenue, MEA region accounted for 3.2% of the global quantum dots market in 2024.
- Globally, Asia Pacific is projected to lead the regional market in terms of revenue in 2033.
- Asia Pacific is the fastest growing regional market and is projected to reach USD 13,133.0 million by 2033.
No credit card required*
Horizon in a snapshot
- 30K+ Global Market Reports
- 120K+ Country Reports
- 1.2M+ Market Statistics
- 200K+ Company Profiles
- Industry insights and more
Quantum Dots Market Scope
Quantum Dots Market Companies
| Name | Profile | # Employees | HQ | Website |
|---|---|---|---|---|
| eBioscience | View profile | 1001-5000 | San Diego, California, United States, North America | http://www.ebioscience.com |
| Nanosys | View profile | 101-250 | Milpitas, California, United States, North America | https://nanosys.com |
| InVisage Technologies | View profile | 51-100 | Menlo Park, California, United States, North America | http://www.invisage.com |
| Nexxus Lighting | View profile | 51-100 | Stamford, Connecticut, United States, North America | http://www.nexxuslighting.com |
| Samsung Electronics | View profile | 10001+ | Seoul, Seoul-t'ukpyolsi, South Korea, Asia | https://www.samsung.com/ |
| Altair | View profile | 1001-5000 | Troy, Michigan, United States, North America | http://www.altair.com |
| Life Technologies | View profile | 5001-10000 | Carlsbad, California, United States, North America | http://www.lifetechnologies.com |
| Sony Corporation | View profile | - | - | - |
| LG Display Co., Ltd. | View profile | - | - | - |
| Sigma-Aldrich | View profile | 5001-10000 | St Louis, Missouri, United States, North America | https://www.sigmaaldrich.com |
| QD Laser, Inc. | View profile | 11-50 | Kawasaki, Kanagawa, Japan, Asia | https://www.qdlaser.com/en/ |
| Quantum | View profile | 1001-5000 | San Jose, California, United States, North America | http://www.quantum.com |
| Microvision Inc | View profile | 340 | 18390 NE 68th Street, Redmond, WA, United States, 98052 | https://www.microvision.com |
| Evident | View profile | 5001-10000 | Tokyo, Tokyo, Japan, Asia | https://www.evidentscientific.com |
Middle East & Africa quantum dots market outlook
The databook is designed to serve as a comprehensive guide to navigating this sector. The databook focuses on market statistics denoted in the form of revenue and y-o-y growth and CAGR across the globe and regions. A detailed competitive and opportunity analyses related to quantum dots market will help companies and investors design strategic landscapes.
Core type qds was the largest segment with a revenue share of 56.4% in 2024. Horizon Databook has segmented the Middle East & Africa quantum dots market based on core type qds, core shell qds covering the revenue growth of each sub-segment from 2021 to 2033.
Reasons to subscribe to Middle East & Africa quantum dots market databook:
-
Access to comprehensive data: Horizon Databook provides over 1 million market statistics and 20,000+ reports, offering extensive coverage across various industries and regions.
-
Informed decision making: Subscribers gain insights into market trends, customer preferences, and competitor strategies, empowering informed business decisions.
-
Cost-Effective solution: It's recognized as the world's most cost-effective market research database, offering high ROI through its vast repository of data and reports.
-
Customizable reports: Tailored reports and analytics allow companies to drill down into specific markets, demographics, or product segments, adapting to unique business needs.
-
Strategic advantage: By staying updated with the latest market intelligence, companies can stay ahead of competitors, anticipate industry shifts, and capitalize on emerging opportunities.
Target buyers of Middle East & Africa quantum dots market databook
-
Our clientele includes a mix of quantum dots market companies, investment firms, advisory firms & academic institutions.
-
30% of our revenue is generated working with investment firms and helping them identify viable opportunity areas.
-
Approximately 65% of our revenue is generated working with competitive intelligence & market intelligence teams of market participants (manufacturers, service providers, etc.).
-
The rest of the revenue is generated working with academic and research not-for-profit institutes. We do our bit of pro-bono by working with these institutions at subsidized rates.
Horizon Databook provides a detailed overview of continent-level data and insights on the Middle East & Africa quantum dots market , including forecasts for subscribers. This continent databook contains high-level insights into Middle East & Africa quantum dots market from 2021 to 2033, including revenue numbers, major trends, and company profiles.
Partial client list

Middle East & Africa Quantum Dots Market Outlook Share, 2024 & 2033 (US$M)


Related statistics
Sign up - it's easy, and free!
Sign up and get instant basic access to databook, upgrade
when ready, or enjoy our
free plan indefinitely.
Included in Horizon account
- 30K+ Global Market Reports
- 120K+ Country Reports
- 1.2M+ Market Statistics
- 200K+ Company Profiles
- Industry insights and more