North America Quantum Dots Market Size & Outlook, 2025-2033
Related Markets
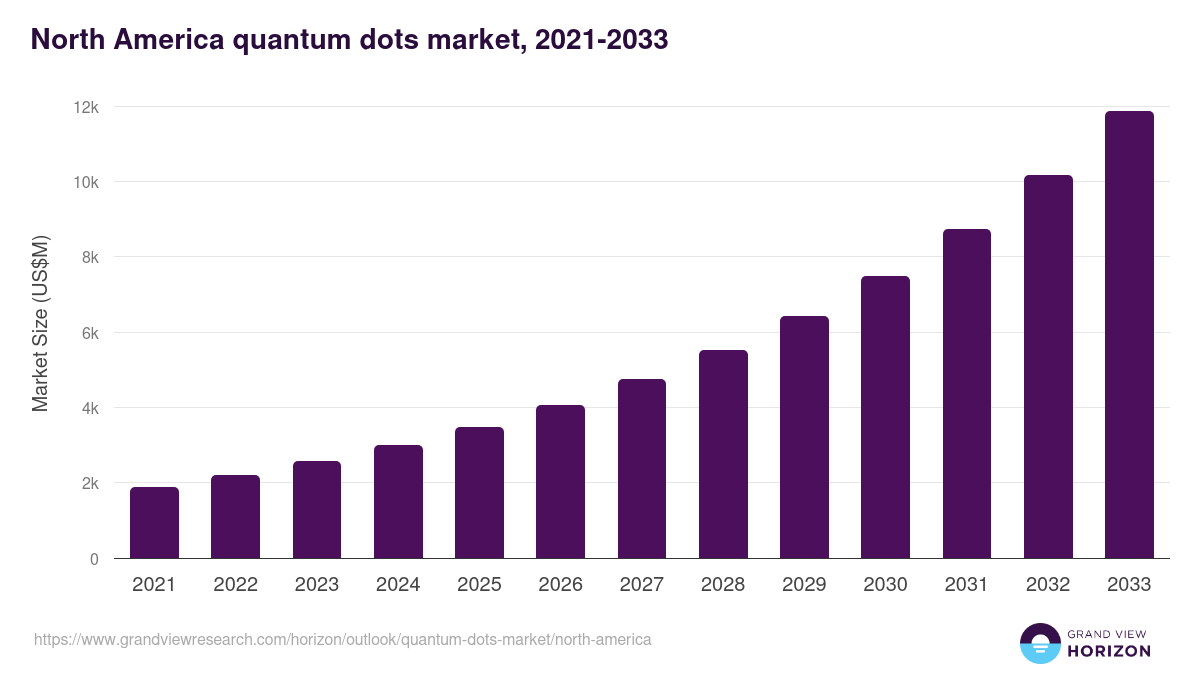
North America quantum dots market highlights
- The North America quantum dots market generated a revenue of USD 2,997.6 million in 2024.
- The market is expected to grow at a CAGR of 16.5% from 2025 to 2033.
- In terms of segment, core type qds was the largest revenue generating product in 2024.
- Core shell QDs is the most lucrative product segment registering the fastest growth during the forecast period.
- Country-wise, U.S. is expected to register the highest CAGR from 2025 to 2033.
North America data book summary
| Market revenue in 2024 | USD 2,997.6 million |
| Market revenue in 2033 | USD 11,864.8 million |
| Growth rate | 16.5% (CAGR from 2025 to 2033) |
| Largest segment | Core type qds |
| Fastest growing segment | Core shell QDs |
| Historical data covered | 2021 - 2023 |
| Base year for estimation | 2024 |
| Forecast period covered | 2025 - 2033 |
| Quantitative units | Revenue in USD million |
| Market segmentation | Core type QDs, Core shell QDs |
Other key industry trends
- In terms of revenue, North America region accounted for 30.2% of the global quantum dots market in 2024.
- Globally, Asia Pacific is projected to lead the regional market in terms of revenue in 2033.
- Asia Pacific is the fastest growing regional market and is projected to reach USD 13,133.0 million by 2033.
No credit card required*
Horizon in a snapshot
- 30K+ Global Market Reports
- 120K+ Country Reports
- 1.2M+ Market Statistics
- 200K+ Company Profiles
- Industry insights and more
Quantum Dots Market Scope
Quantum Dots Market Companies
| Name | Profile | # Employees | HQ | Website |
|---|---|---|---|---|
| eBioscience | View profile | 1001-5000 | San Diego, California, United States, North America | http://www.ebioscience.com |
| Nanosys | View profile | 101-250 | Milpitas, California, United States, North America | https://nanosys.com |
| InVisage Technologies | View profile | 51-100 | Menlo Park, California, United States, North America | http://www.invisage.com |
| Nexxus Lighting | View profile | 51-100 | Stamford, Connecticut, United States, North America | http://www.nexxuslighting.com |
| Samsung Electronics | View profile | 10001+ | Seoul, Seoul-t'ukpyolsi, South Korea, Asia | https://www.samsung.com/ |
| Altair | View profile | 1001-5000 | Troy, Michigan, United States, North America | http://www.altair.com |
| Life Technologies | View profile | 5001-10000 | Carlsbad, California, United States, North America | http://www.lifetechnologies.com |
| Sony Corporation | View profile | - | - | - |
| LG Display Co., Ltd. | View profile | - | - | - |
| Sigma-Aldrich | View profile | 5001-10000 | St Louis, Missouri, United States, North America | https://www.sigmaaldrich.com |
| QD Laser, Inc. | View profile | 11-50 | Kawasaki, Kanagawa, Japan, Asia | https://www.qdlaser.com/en/ |
| Quantum | View profile | 1001-5000 | San Jose, California, United States, North America | http://www.quantum.com |
| Microvision Inc | View profile | 340 | 18390 NE 68th Street, Redmond, WA, United States, 98052 | https://www.microvision.com |
| Evident | View profile | 5001-10000 | Tokyo, Tokyo, Japan, Asia | https://www.evidentscientific.com |
North America quantum dots market outlook
The databook is designed to serve as a comprehensive guide to navigating this sector. The databook focuses on market statistics denoted in the form of revenue and y-o-y growth and CAGR across the globe and regions. A detailed competitive and opportunity analyses related to quantum dots market will help companies and investors design strategic landscapes.
Core type qds was the largest segment with a revenue share of 56.93% in 2024. Horizon Databook has segmented the North America quantum dots market based on core type qds, core shell qds covering the revenue growth of each sub-segment from 2021 to 2033.
Reasons to subscribe to North America quantum dots market databook:
-
Access to comprehensive data: Horizon Databook provides over 1 million market statistics and 20,000+ reports, offering extensive coverage across various industries and regions.
-
Informed decision making: Subscribers gain insights into market trends, customer preferences, and competitor strategies, empowering informed business decisions.
-
Cost-Effective solution: It's recognized as the world's most cost-effective market research database, offering high ROI through its vast repository of data and reports.
-
Customizable reports: Tailored reports and analytics allow companies to drill down into specific markets, demographics, or product segments, adapting to unique business needs.
-
Strategic advantage: By staying updated with the latest market intelligence, companies can stay ahead of competitors, anticipate industry shifts, and capitalize on emerging opportunities.
Target buyers of North America quantum dots market databook
-
Our clientele includes a mix of quantum dots market companies, investment firms, advisory firms & academic institutions.
-
30% of our revenue is generated working with investment firms and helping them identify viable opportunity areas.
-
Approximately 65% of our revenue is generated working with competitive intelligence & market intelligence teams of market participants (manufacturers, service providers, etc.).
-
The rest of the revenue is generated working with academic and research not-for-profit institutes. We do our bit of pro-bono by working with these institutions at subsidized rates.
Horizon Databook provides a detailed overview of continent-level data and insights on the North America quantum dots market , including forecasts for subscribers. This continent databook contains high-level insights into North America quantum dots market from 2021 to 2033, including revenue numbers, major trends, and company profiles.
Partial client list
North America quantum dots market size, by country, 2021-2033 (US$M)

North America Quantum Dots Market Outlook Share, 2024 & 2033 (US$M)


Related statistics
Sign up - it's easy, and free!
Sign up and get instant basic access to databook, upgrade
when ready, or enjoy our
free plan indefinitely.
Included in Horizon account
- 30K+ Global Market Reports
- 120K+ Country Reports
- 1.2M+ Market Statistics
- 200K+ Company Profiles
- Industry insights and more