Asia Pacific Retro-reflective Materials Market Size & Outlook
Related Markets
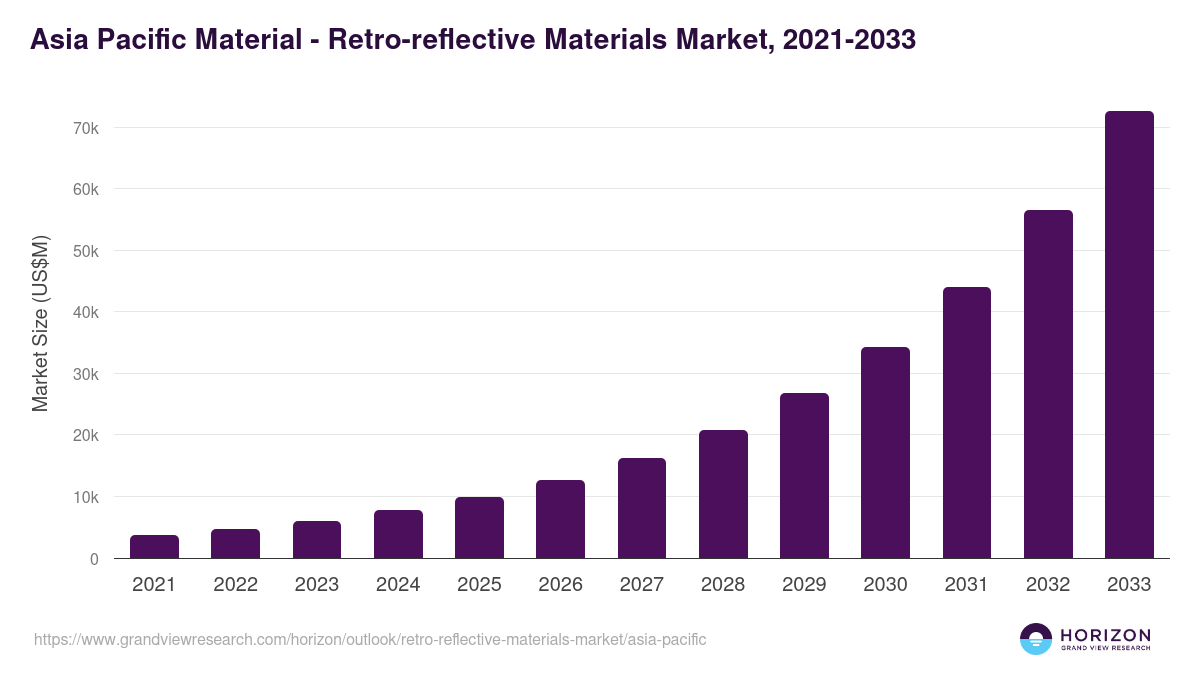
Asia Pacific retro-reflective materials market highlights
- The Asia Pacific retro-reflective materials market generated a revenue of USD 7,739.4 million in 2024.
- The market is expected to grow at a CAGR of 28.3% from 2025 to 2033.
- In terms of segment, films & tapes was the largest revenue generating material in 2024.
- Paints, ink & Coatings is the most lucrative material segment registering the fastest growth during the forecast period.
- Country-wise, China is expected to register the highest CAGR from 2025 to 2033.
Asia Pacific data book summary
| Market revenue in 2024 | USD 7,739.4 million |
| Market revenue in 2033 | USD 72,623.6 million |
| Growth rate | 28.3% (CAGR from 2025 to 2033) |
| Largest segment | Films & tapes |
| Fastest growing segment | Paints, ink & Coatings |
| Historical data covered | 2021 - 2023 |
| Base year for estimation | 2024 |
| Forecast period covered | 2025 - 2033 |
| Quantitative units | Revenue in USD million |
| Market segmentation | Paints, ink & Coatings, Films & Tapes |
Other key industry trends
- In terms of revenue, Asia Pacific region accounted for 32.4% of the global retro-reflective materials market in 2024.
- Globally, Asia Pacific is projected to lead the regional market in terms of revenue in 2033.
- Asia Pacific is the fastest growing regional market and is projected to reach USD 72,623.6 million by 2033.
No credit card required*
Horizon in a snapshot
- 30K+ Global Market Reports
- 120K+ Country Reports
- 1.2M+ Market Statistics
- 200K+ Company Profiles
- Industry insights and more
Retro-Reflective Materials Market Scope
Retro-Reflective Materials Market Companies
| Name | Profile | # Employees | HQ | Website |
|---|---|---|---|---|
| Nippon Carbide Industries | View profile | 1001-5000 | Kyoto, Kyoto, Japan, Asia | http://www.carbide.co.jp/en/ |
| Alanod | View profile | 251-500 | Ennepetal, Nordrhein-Westfalen, Germany, Europe | http://www.alanod.com |
| ORAFOL Europe GmbH | View profile | 1001-5000 | Oranienburg, Brandenburg, Germany, Europe | http://www.orafol.com/ |
| Coats Group PLC | View profile | 15539 | 14 Aldermanbury Square, 4th Floor, London, United Kingdom, EC2V 7HS | https://www.coats.com |
| Avery Dennison Corp | View profile | 35000 | 8080 Norton Parkway, Mentor, OH, United States, 44060 | https://www.averydennison.com |
| 3M Co | View profile | 85000 | 3M Center, St. Paul, MN, United States, 55144 | https://www.3m.com |
Asia Pacific retro-reflective materials market outlook
The databook is designed to serve as a comprehensive guide to navigating this sector. The databook focuses on market statistics denoted in the form of revenue and y-o-y growth and CAGR across the globe and regions. A detailed competitive and opportunity analyses related to retro-reflective materials market will help companies and investors design strategic landscapes.
Films & tapes was the largest segment with a revenue share of 62.98% in 2024. Horizon Databook has segmented the Asia Pacific retro-reflective materials market based on paints, ink & coatings, films & tapes covering the revenue growth of each sub-segment from 2021 to 2033.
Reasons to subscribe to Asia Pacific retro-reflective materials market databook:
-
Access to comprehensive data: Horizon Databook provides over 1 million market statistics and 20,000+ reports, offering extensive coverage across various industries and regions.
-
Informed decision making: Subscribers gain insights into market trends, customer preferences, and competitor strategies, empowering informed business decisions.
-
Cost-Effective solution: It's recognized as the world's most cost-effective market research database, offering high ROI through its vast repository of data and reports.
-
Customizable reports: Tailored reports and analytics allow companies to drill down into specific markets, demographics, or product segments, adapting to unique business needs.
-
Strategic advantage: By staying updated with the latest market intelligence, companies can stay ahead of competitors, anticipate industry shifts, and capitalize on emerging opportunities.
Target buyers of Asia Pacific retro-reflective materials market databook
-
Our clientele includes a mix of retro-reflective materials market companies, investment firms, advisory firms & academic institutions.
-
30% of our revenue is generated working with investment firms and helping them identify viable opportunity areas.
-
Approximately 65% of our revenue is generated working with competitive intelligence & market intelligence teams of market participants (manufacturers, service providers, etc.).
-
The rest of the revenue is generated working with academic and research not-for-profit institutes. We do our bit of pro-bono by working with these institutions at subsidized rates.
Horizon Databook provides a detailed overview of continent-level data and insights on the Asia Pacific retro-reflective materials market , including forecasts for subscribers. This continent databook contains high-level insights into Asia Pacific retro-reflective materials market from 2021 to 2033, including revenue numbers, major trends, and company profiles.
Partial client list
Asia Pacific retro-reflective materials market size, by country, 2021-2033 (US$M)

Asia Pacific Retro-Reflective Materials Market Outlook Share, 2024 & 2033 (US$M)


Related industry reports
Related statistics
Sign up - it's easy, and free!
Sign up and get instant basic access to databook, upgrade
when ready, or enjoy our
free plan indefinitely.
Included in Horizon account
- 30K+ Global Market Reports
- 120K+ Country Reports
- 1.2M+ Market Statistics
- 200K+ Company Profiles
- Industry insights and more