U.S. Returnable Packaging Market Size & Outlook, 2026-2033
Related Markets
U.S. returnable packaging market highlights
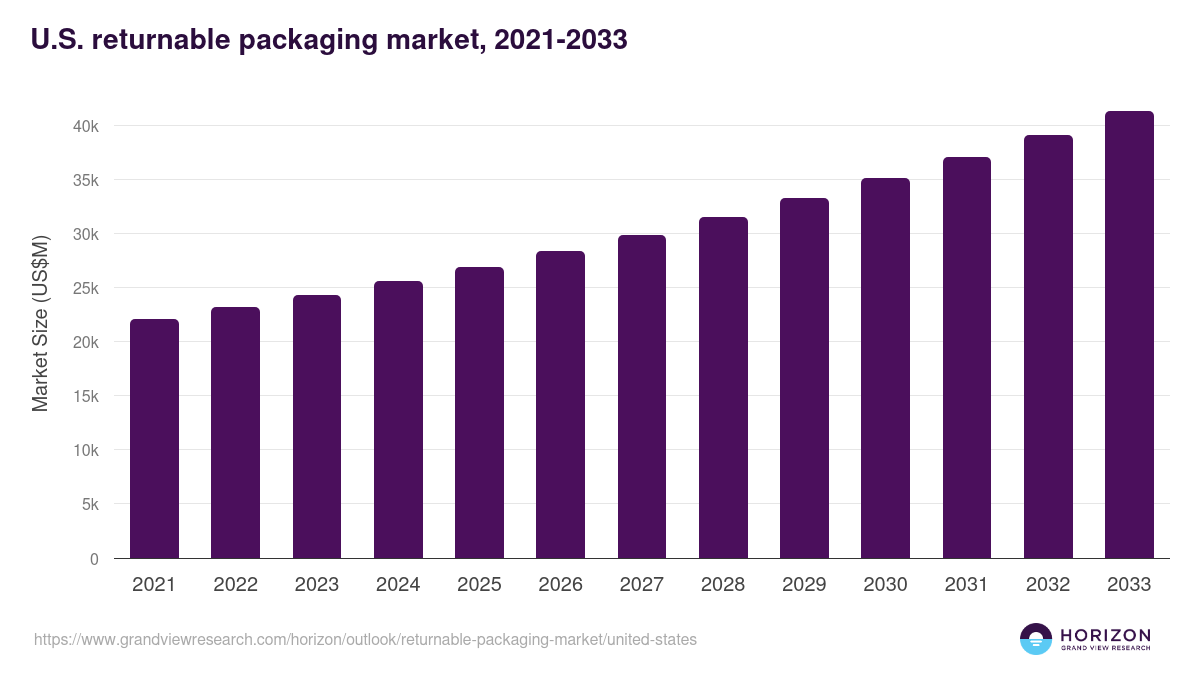
- The U.S. returnable packaging market generated a revenue of USD 26,927.5 million in 2025 and is expected to reach USD 41,302.1 million by 2033.
- The U.S. market is expected to grow at a CAGR of 5.5% from 2026 to 2033.
- In terms of segment, plastic was the largest revenue generating material in 2025.
- Metal is the most lucrative material segment registering the fastest growth during the forecast period.
Returnable packaging market data book summary
| Market revenue in 2025 | USD 26,927.5 million |
| Market revenue in 2033 | USD 41,302.1 million |
| Growth rate | 5.5% (CAGR from 2026 to 2033) |
| Largest segment | Plastic |
| Fastest growing segment | Metal |
| Historical data | 2021 - 2024 |
| Base year | 2025 |
| Forecast period | 2026 - 2033 |
| Quantitative units | Revenue in USD million |
| Market segmentation | Plastic, Metal, Wood |
| Key market players worldwide | Brambles Ltd, Schoeller Allibert, ORBIS Corp., DS Smith PLC, Myers Industries, Nefab Group, Rehrig Pacific Company, VETROPACK, Amatech, CHEP |
Other key industry trends
- In terms of revenue, U.S. accounted for 20.9% of the global returnable packaging market in 2025.
- Country-wise, U.S. is expected to lead the global market in terms of revenue in 2033.
- In North America, U.S. returnable packaging market is projected to lead the regional market in terms of revenue in 2033.
- Canada is the fastest growing regional market in North America and is projected to reach USD 6,281.9 million by 2033.
No credit card required*
Horizon in a snapshot
- 30K+ Global Market Reports
- 120K+ Country Reports
- 1.2M+ Market Statistics
- 200K+ Company Profiles
- Industry insights and more
Returnable Packaging Market Scope
Returnable Packaging Market Companies
| Name | Profile | # Employees | HQ | Website |
|---|---|---|---|---|
| Myers Industries | View profile | 1001-5000 | Akron, Ohio, United States, North America | http://myersindustries.com |
| VETROPACK | View profile | 501-1000 | Kyiv, Kyyiv, Ukraine, Europe | https://www.vetropack.com/ |
| Rehrig Pacific Company | View profile | 5001-10000 | Los Angeles, California, United States, North America | http://www.rehrigpacific.com |
| CHEP | View profile | 10001+ | Weybridge, Surrey, United Kingdom, Europe | http://www.chep.com |
| ORBIS Corp. | View profile | 1001-5000 | Oconomowoc, Wisconsin, United States, North America | http://www.orbiscorporation.com |
| Schoeller Allibert | View profile | 1001-5000 | Hoofddorp, Noord-Holland, The Netherlands, Europe | http://www.schoellerallibert.com/ |
| Amatech | View profile | 101-250 | Erie, Pennsylvania, United States, North America | https://www.amatechinc.com/ |
| Nefab Group | View profile | 5001-10000 | Jönköping, Jonkopings Lan, Sweden, Europe | http://www.nefab.com/ |
| Brambles Ltd | View profile | 12262 | 255 George Street, Level 29, Sydney, NSW, Australia, 2000 | https://www.brambles.com |
| DS Smith PLC | View profile | 29672 | 1 Paddington Square, Level 3, London, United Kingdom, W2 1DL | https://www.dssmith.com |
U.S. returnable packaging market outlook
The databook is designed to serve as a comprehensive guide to navigating this sector. The databook focuses on market statistics denoted in the form of revenue and y-o-y growth and CAGR across the globe and regions. A detailed competitive and opportunity analyses related to returnable packaging market will help companies and investors design strategic landscapes.
Plastic was the largest segment with a revenue share of 67.02% in 2025. Horizon Databook has segmented the U.S. returnable packaging market based on plastic, metal, wood covering the revenue growth of each sub-segment from 2021 to 2033.
The U.S. is the most significant returnable packaging market in North America due to extensive manufacturing companies' presence. The country’s trade was valued at USD 5.3 trillion in 2022, wherein USD 2.1 trillion was through exports, and USD 3.31 trillion was through imports.
It stands as a top importing country globally with other key importing countries, including China, Germany, Japan, Canada, and Mexico. The transportation and logistics industry in the U.S. has been growing year-on-year with increasing demand from imports and exports coupled with augmenting FDI (foreign direct investment) in the country.
The overall FDI reached approximately 6.49 trillion in 2021, owing to the rising demand for logistics from the highly integrated supply chain network in the country. Some of the key companies in the logistics business include XPO Logistics, Inc. UPS Supply Chain Solutions, DHL Supply Chain, C.H. Robinson Worldwide, and Expeditors International of Washington.
Reasons to subscribe to U.S. returnable packaging market databook:
-
Access to comprehensive data: Horizon Databook provides over 1 million market statistics and 20,000+ reports, offering extensive coverage across various industries and regions.
-
Informed decision making: Subscribers gain insights into market trends, customer preferences, and competitor strategies, empowering informed business decisions.
-
Cost-Effective solution: It's recognized as the world's most cost-effective market research database, offering high ROI through its vast repository of data and reports.
-
Customizable reports: Tailored reports and analytics allow companies to drill down into specific markets, demographics, or product segments, adapting to unique business needs.
-
Strategic advantage: By staying updated with the latest market intelligence, companies can stay ahead of competitors, anticipate industry shifts, and capitalize on emerging opportunities.
Target buyers of U.S. returnable packaging market databook
-
Our clientele includes a mix of returnable packaging market companies, investment firms, advisory firms & academic institutions.
-
30% of our revenue is generated working with investment firms and helping them identify viable opportunity areas.
-
Approximately 65% of our revenue is generated working with competitive intelligence & market intelligence teams of market participants (manufacturers, service providers, etc.).
-
The rest of the revenue is generated working with academic and research not-for-profit institutes. We do our bit of pro-bono by working with these institutions at subsidized rates.
Horizon Databook provides a detailed overview of country-level data and insights on the U.S. returnable packaging market , including forecasts for subscribers. This country databook contains high-level insights into U.S. returnable packaging market from 2021 to 2033, including revenue numbers, major trends, and company profiles.
Partial client list
U.S. returnable packaging market size, by material, 2021-2033 (US$M)

U.S. Returnable Packaging Market Outlook Share, 2025 & 2033 (US$M)


Related statistics
Sign up - it's easy, and free!
Sign up and get instant basic access to databook, upgrade
when ready, or enjoy our
free plan indefinitely.
Included in Horizon account
- 30K+ Global Market Reports
- 120K+ Country Reports
- 1.2M+ Market Statistics
- 200K+ Company Profiles
- Industry insights and more