Asia Pacific Smart Sports Wearables Market Size & Outlook
Related Markets
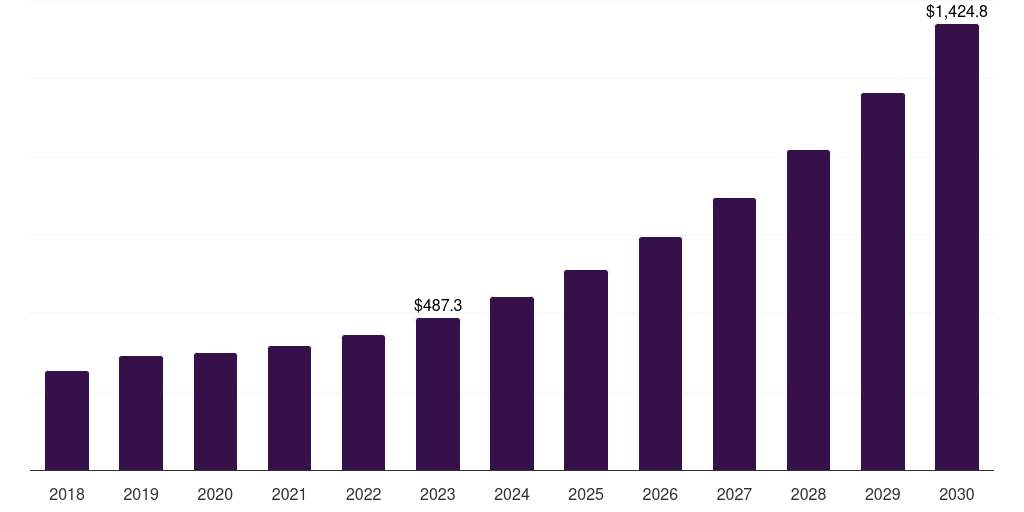
Asia Pacific smart sports wearables market highlights
- The Asia Pacific smart sports wearables market generated a revenue of USD 487.3 million in 2023.
- The market is expected to grow at a CAGR of 16.6% from 2024 to 2030.
- In terms of segment, hardware was the largest revenue generating component in 2023.
- Software is the most lucrative component segment registering the fastest growth during the forecast period.
- Country-wise, India is expected to register the highest CAGR from 2024 to 2030.
Asia Pacific data book summary
| Market revenue in 2023 | USD 487.3 million |
| Market revenue in 2030 | USD 1,424.8 million |
| Growth rate | 16.6% (CAGR from 2023 to 2030) |
| Largest segment | Hardware |
| Fastest growing segment | Software |
| Historical data covered | 2018 - 2022 |
| Base year for estimation | 2023 |
| Forecast period covered | 2024 - 2030 |
| Quantitative units | Revenue in USD million |
| Market segmentation | Hardware, Software, Services |
| Key market players worldwide | Apple Inc, Sony Group Corp, Fitbit, Garmin Ltd, CGT Catapult, Under Armour Inc Class A, Alphabet Inc Class A, Samsung Electronics Co Ltd, Xiaomi Corp Class B, Huawei Technologies, Adidas AG, ShotTracker, Panasonic Industry, Stats Perform, StretchSense |
Other key industry trends
- In terms of revenue, Asia Pacific region accounted for 29.2% of the global smart sports wearables market in 2023.
- Globally, Asia Pacific is projected to lead the regional market in terms of revenue in 2030.
- Asia Pacific is the fastest growing regional market and is projected to reach USD 1,424.8 million by 2030.
No credit card required*
Horizon in a snapshot
- 30K+ Global Market Reports
- 120K+ Country Reports
- 1.2M+ Market Statistics
- 200K+ Company Profiles
- Industry insights and more
Smart Sports Wearables Market Scope
Smart Sports Wearables Market Companies
| Name | Profile | # Employees | HQ | Website |
|---|---|---|---|---|
| StretchSense | View profile | 11-50 | Auckland, Auckland, New Zealand, Oceania | http://www.stretchsense.com/ |
| Stats Perform | View profile | 1001-5000 | Chicago, Illinois, United States, North America | https://www.statsperform.com |
| ShotTracker | View profile | 11-50 | Mission, Kansas, United States, North America | http://shottracker.com |
| Panasonic Industry | View profile | 1001-5000 | Ottobrunn, Bayern, Germany, Europe | https://www.panasonic-electric-works.co.uk |
| Huawei Technologies | View profile | 10001+ | Shenzhen, Guangdong, China, Asia | http://huawei.com |
| Adidas AG | View profile | 59030 | Adi-Dassler-Strasse 1, Herzogenaurach, BY, Germany, 91074 | https://www.adidas-group.com |
| CGT Catapult | View profile | 251-500 | London, England, United Kingdom, Europe | https://ct.catapult.org.uk |
| Fitbit | View profile | 251-500 | San Francisco, California, United States, North America | http://www.fitbit.com |
| Garmin Ltd | View profile | 19900 | Muhlentalstrasse 2, Schaffhausen, Switzerland, 8200 | https://www.garmin.com |
| Samsung Electronics Co Ltd | View profile | 124804 | 129, Samsung-ro, Yeongtong-gu, Gyeonggi-do, Suwon-si, Korea, Republic of, 443-742 | https://www.samsung.com |
| Xiaomi Corp Class B | View profile | 33627 | Anningzhuang Road, Xiaomi Campus, Haidian District, Beijing, China, People's Republic of | https://www.mi.com |
| Alphabet Inc Class A | View profile | 180895 | 1600 Amphitheatre Parkway, Mountain View, CA, United States, 94043 | https://www.abc.xyz |
| Sony Group Corp | View profile | 113000 | 7-1, Konan 1-Chome, Minato-ku, Tokyo, Japan, 108-0075 | https://www.sony.com |
| Under Armour Inc Class A | View profile | 14800 | 1020 Hull Street, Baltimore, MD, United States, 21230 | https://www.underarmour.com |
| Apple Inc | View profile | 161000 | One Apple Park Way, Cupertino, CA, United States, 95014 | https://www.apple.com |
Asia Pacific smart sports wearables market outlook
The databook is designed to serve as a comprehensive guide to navigating this sector. The databook focuses on market statistics denoted in the form of revenue and y-o-y growth and CAGR across the globe and regions. A detailed competitive and opportunity analyses related to smart sports wearables market will help companies and investors design strategic landscapes.
Hardware was the largest segment with a revenue share of 45.56% in 2023. Horizon Databook has segmented the Asia Pacific smart sports wearables market based on hardware, software, services covering the revenue growth of each sub-segment from 2018 to 2030.
- Asia Pacific Smart Sports Wearables Component Outlook (Revenue, USD Million, 2018-2030)
- Hardware
- Sensors
- Battery
- Others
- Memory
- Display
- Software
- Operating System
- Device Applications
- Services
- Hardware
- Asia Pacific Smart Sports Wearables Device Type Outlook (Revenue, USD Million, 2018-2030)
- Others
- Headwear
- Smart Bodywear
- Wristwear
- Smart Wristbands
- Smartwatches
- Smart Shoes
- Asia Pacific Smart Sports Wearables Application Outlook (Revenue, USD Million, 2018-2030)
- Fitness & Activity Tracking
- Biometric Analysis
- Sports & Performance Enhancement
- Health Monitoring
- Navigation & Location Tracking
- Asia Pacific Smart Sports Wearables End Use Outlook (Revenue, USD Million, 2018-2030)
- Amateur Athletes
- Professional Athletes
Reasons to subscribe to Asia Pacific smart sports wearables market databook:
-
Access to comprehensive data: Horizon Databook provides over 1 million market statistics and 20,000+ reports, offering extensive coverage across various industries and regions.
-
Informed decision making: Subscribers gain insights into market trends, customer preferences, and competitor strategies, empowering informed business decisions.
-
Cost-Effective solution: It's recognized as the world's most cost-effective market research database, offering high ROI through its vast repository of data and reports.
-
Customizable reports: Tailored reports and analytics allow companies to drill down into specific markets, demographics, or product segments, adapting to unique business needs.
-
Strategic advantage: By staying updated with the latest market intelligence, companies can stay ahead of competitors, anticipate industry shifts, and capitalize on emerging opportunities.
Target buyers of Asia Pacific smart sports wearables market databook
-
Our clientele includes a mix of smart sports wearables market companies, investment firms, advisory firms & academic institutions.
-
30% of our revenue is generated working with investment firms and helping them identify viable opportunity areas.
-
Approximately 65% of our revenue is generated working with competitive intelligence & market intelligence teams of market participants (manufacturers, service providers, etc.).
-
The rest of the revenue is generated working with academic and research not-for-profit institutes. We do our bit of pro-bono by working with these institutions at subsidized rates.
Horizon Databook provides a detailed overview of continent-level data and insights on the Asia Pacific smart sports wearables market, including forecasts for subscribers. This continent databook contains high-level insights into Asia Pacific smart sports wearables market from 2018 to 2030, including revenue numbers, major trends, and company profiles.
Partial client list
Asia Pacific smart sports wearables market size, by country, 2018-2030 (US$M)

Asia Pacific Smart Sports Wearables Market Share, 2023 & 2030 (US$M)


Related statistics
Sign up - it's easy, and free!
Sign up and get instant basic access to databook, upgrade
when ready, or enjoy our
free plan indefinitely.
Included in Horizon account
- 30K+ Global Market Reports
- 120K+ Country Reports
- 1.2M+ Market Statistics
- 200K+ Company Profiles
- Industry insights and more