Asia Pacific Sports Equipment Market Size & Outlook
Related Markets
Asia Pacific sports equipment market highlights
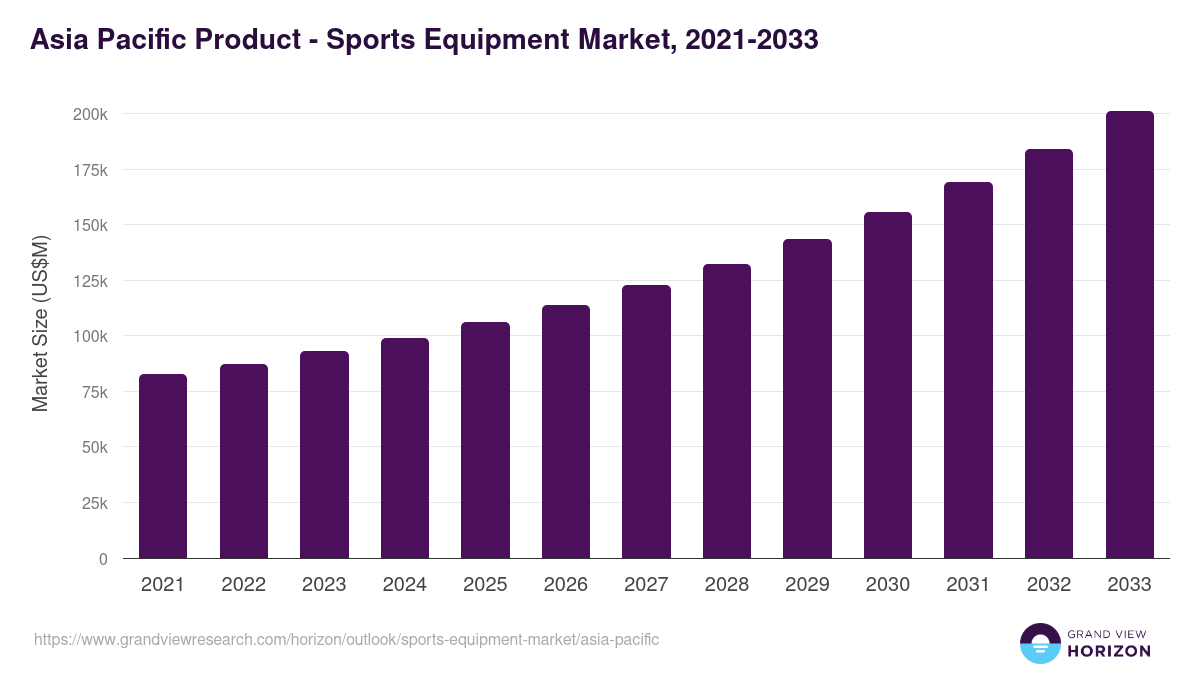
- The Asia Pacific sports equipment market generated a revenue of USD 106,193.0 million in 2025.
- The market is expected to grow at a CAGR of 8.4% from 2026 to 2033.
- In terms of segment, ball games was the largest revenue generating product in 2025.
- Fitness/Strength equipment is the most lucrative product segment registering the fastest growth during the forecast period.
- Country-wise, India is expected to register the highest CAGR from 2026 to 2033.
Asia Pacific data book summary
| Market revenue in 2025 | USD 106,193.0 million |
| Market revenue in 2033 | USD 201,173.0 million |
| Growth rate | 8.4% (CAGR from 2026 to 2033) |
| Largest segment | Ball games |
| Fastest growing segment | Fitness/Strength equipment |
| Historical data covered | 2021 - 2024 |
| Base year for estimation | 2025 |
| Forecast period covered | 2026 - 2033 |
| Quantitative units | Revenue in USD million |
| Market segmentation | Ball over net games, Ball games, Fitness/Strength equipment, Athletic training equipment |
| Key market players worldwide | Adidas AG, Amer Sports Inc, Topgolf Callaway Brands Corp, Sumitomo Rubber Industries Ltd, Nike Inc Class B, Puma SE, Mizuno Corp, Frasers Group PLC, Under Armour Inc Class A, Yonex Co Ltd |
Other key industry trends
- In terms of revenue, Asia Pacific region accounted for 25.8% of the global sports equipment market in 2025.
- Globally, North America is projected to lead the regional market in terms of revenue in 2033.
- Asia Pacific is the fastest growing regional market and is projected to reach USD 201,173.0 million by 2033.
No credit card required*
Horizon in a snapshot
- 30K+ Global Market Reports
- 120K+ Country Reports
- 1.2M+ Market Statistics
- 200K+ Company Profiles
- Industry insights and more
Sports Equipment Market Scope
Sports Equipment Market Companies
| Name | Profile | # Employees | HQ | Website |
|---|---|---|---|---|
| Frasers Group PLC | View profile | 32480 | Unit A, Brook Park East, Shirebrook, United Kingdom, NG20 8RY | https://www.frasers.group |
| Sumitomo Rubber Industries Ltd | View profile | 42997 | 3-6-9, Wakinohama-cho, Chuo-ku, Hyogo, Kobe, Japan, 651-0072 | http://www.srigroup.co.jp |
| Amer Sports Inc | View profile | 11400 | Konepajankuja 6, Helsinki, Finland, 00511 | https://www.amersports.com |
| Mizuno Corp | View profile | 5310 | 1-12-35 Nanko-Kita Suminoe-ku, Osaka-shi, Japan, 559-8510 | http://www.mizuno.co.jp |
| Yonex Co Ltd | View profile | 2921 | 3-23-13 Yushima, Bunkyo-ku, Tokyo, Japan, 113-8543 | http://www.yonex.co.jp |
| Puma SE | View profile | 21164 | Puma Way 1, Herzogenaurach, BY, Germany, 91074 | https://www.puma.com |
| Adidas AG | View profile | 59030 | Adi-Dassler-Strasse 1, Herzogenaurach, BY, Germany, 91074 | https://www.adidas-group.com |
| Nike Inc Class B | View profile | 83700 | One Bowerman Drive, Beaverton, OR, United States, 97005-6453 | https://www.nike.com |
| Under Armour Inc Class A | View profile | 14800 | 1020 Hull Street, Baltimore, MD, United States, 21230 | https://www.underarmour.com |
| Topgolf Callaway Brands Corp | View profile | 32000 | 2180 Rutherford Road, Carlsbad, CA, United States, 92008 | https://www.topgolfcallawaybrands.com |
Asia Pacific sports equipment market outlook
The databook is designed to serve as a comprehensive guide to navigating this sector. The databook focuses on market statistics denoted in the form of revenue and y-o-y growth and CAGR across the globe and regions. A detailed competitive and opportunity analyses related to sports equipment market will help companies and investors design strategic landscapes.
Ball games was the largest segment with a revenue share of 37.11% in 2025. Horizon Databook has segmented the Asia Pacific sports equipment market based on ball over net games, ball games, fitness/strength equipment, athletic training equipment covering the revenue growth of each sub-segment from 2021 to 2033.
The growing emphasis on work-life balance by various government agencies and companies in the region is resulting in increasing the adoption of sports goods and athleisure in the region. The spending on associated clothing and footwear has increased over the past few years. With sports fashion gaining popularity among local consumers, increasing spending on sports apparel and footwear, and the trend of athleisure gaining popularity, companies in the market are focusing on catering to evolving consumer demands.
Reasons to subscribe to Asia Pacific sports equipment market databook:
-
Access to comprehensive data: Horizon Databook provides over 1 million market statistics and 20,000+ reports, offering extensive coverage across various industries and regions.
-
Informed decision making: Subscribers gain insights into market trends, customer preferences, and competitor strategies, empowering informed business decisions.
-
Cost-Effective solution: It's recognized as the world's most cost-effective market research database, offering high ROI through its vast repository of data and reports.
-
Customizable reports: Tailored reports and analytics allow companies to drill down into specific markets, demographics, or product segments, adapting to unique business needs.
-
Strategic advantage: By staying updated with the latest market intelligence, companies can stay ahead of competitors, anticipate industry shifts, and capitalize on emerging opportunities.
Target buyers of Asia Pacific sports equipment market databook
-
Our clientele includes a mix of sports equipment market companies, investment firms, advisory firms & academic institutions.
-
30% of our revenue is generated working with investment firms and helping them identify viable opportunity areas.
-
Approximately 65% of our revenue is generated working with competitive intelligence & market intelligence teams of market participants (manufacturers, service providers, etc.).
-
The rest of the revenue is generated working with academic and research not-for-profit institutes. We do our bit of pro-bono by working with these institutions at subsidized rates.
Horizon Databook provides a detailed overview of continent-level data and insights on the Asia Pacific sports equipment market , including forecasts for subscribers. This continent databook contains high-level insights into Asia Pacific sports equipment market from 2021 to 2033, including revenue numbers, major trends, and company profiles.
Partial client list
Asia Pacific sports equipment market size, by country, 2021-2033 (US$M)

Asia Pacific Sports Equipment Market Outlook Share, 2025 & 2033 (US$M)


Related statistics
Sign up - it's easy, and free!
Sign up and get instant basic access to databook, upgrade
when ready, or enjoy our
free plan indefinitely.
Included in Horizon account
- 30K+ Global Market Reports
- 120K+ Country Reports
- 1.2M+ Market Statistics
- 200K+ Company Profiles
- Industry insights and more