U.S. Tabletop Kitchen Products Market Size & Outlook
Related Markets
U.S. tabletop kitchen products market highlights
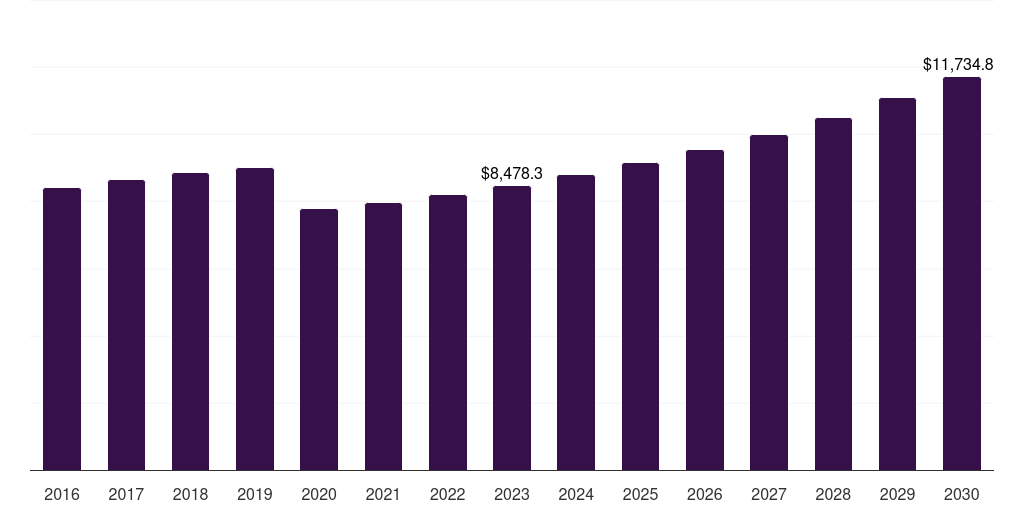
- The U.S. tabletop kitchen products market generated a revenue of USD 8,478.3 million in 2023 and is expected to reach USD 11,734.8 million by 2030.
- The U.S. market is expected to grow at a CAGR of 4.8% from 2024 to 2030.
- In terms of segment, dinnerware was the largest revenue generating type in 2023.
- Drinkware is the most lucrative type segment registering the fastest growth during the forecast period.
Tabletop kitchen products market data book summary
| Market revenue in 2023 | USD 8,478.3 million |
| Market revenue in 2030 | USD 11,734.8 million |
| Growth rate | 4.8% (CAGR from 2023 to 2030) |
| Largest segment | Dinnerware |
| Fastest growing segment | Drinkware |
| Historical data | 2016 - 2022 |
| Base year | 2023 |
| Forecast period | 2024 - 2030 |
| Quantitative units | Revenue in USD million |
| Market segmentation | Dinnerware, Flatware, Whitegoods, Buffet Products, Drinkware |
| Key market players worldwide | Villeroy & Boch AG Vorz-Inhaber-Akt stimmrechtslos, Lennox International Inc, Samsung Electronics Co Ltd, Haier, Robert Bosch Engineering & Business Solutions, Koninklijke Philips NV, ARC International, The Oneida Group |
Other key industry trends
- In terms of revenue, U.S. accounted for 19.2% of the global tabletop kitchen products market in 2023.
- Country-wise, China is expected to lead the global market in terms of revenue in 2030.
- In North America, U.S. tabletop kitchen products market is projected to lead the regional market in terms of revenue in 2030.
- U.S. is the fastest growing regional market in North America and is projected to reach USD 11,734.8 million by 2030.
No credit card required*
Horizon in a snapshot
- 30K+ Global Market Reports
- 120K+ Country Reports
- 1.2M+ Market Statistics
- 200K+ Company Profiles
- Industry insights and more
Tabletop Kitchen Products Market Scope
Tabletop Kitchen Products Market Companies
| Name | Profile | # Employees | HQ | Website |
|---|---|---|---|---|
| The Oneida Group | View profile | 1001-5000 | Lancaster, Ohio, United States, North America | http://theoneidagroup.com/ |
| ARC International | View profile | 51-100 | Cambridge, Cambridgeshire, United Kingdom, Europe | http://www.arc.com |
| Villeroy & Boch AG Vorz-Inhaber-Akt stimmrechtslos | View profile | 12516 | Saaruferstrasse 1-3, Mettlach, Germany, 66693 | https://www.villeroy-boch.com |
| Lennox International Inc | View profile | 12600 | 2140 Lake Park Boulevard, Richardson, TX, United States, 75080 | https://www.lennox.com |
| Haier | View profile | 10001+ | Qingdao Shi, Shandong, China, Asia | http://haier.com/in |
| Robert Bosch Engineering & Business Solutions | View profile | 10001+ | Bangalore, Karnataka, India, Asia | http://www.bosch-india-software.com |
| Samsung Electronics Co Ltd | View profile | 124804 | 129, Samsung-ro, Yeongtong-gu, Gyeonggi-do, Suwon-si, Korea, Republic of, 443-742 | https://www.samsung.com |
| Koninklijke Philips NV | View profile | 73712 | Philips Center, Amstelplein 2, Amsterdam, Netherlands, 1096 BC | https://www.philips.com |
U.S. tabletop kitchen products market outlook
The databook is designed to serve as a comprehensive guide to navigating this sector. The databook focuses on market statistics denoted in the form of revenue and y-o-y growth and CAGR across the globe and regions. A detailed competitive and opportunity analyses related to tabletop kitchen products market will help companies and investors design strategic landscapes.
Dinnerware was the largest segment with a revenue share of 35.53% in 2023. Horizon Databook has segmented the U.S. tabletop kitchen products market based on dinnerware, flatware, whitegoods, buffet products, drinkware covering the revenue growth of each sub-segment from 2016 to 2030.
Tabletop kitchen products are foreseen to witness significant traction in the country on account of favorable demographic factors, rising living standards, and growing preference for at-home dining parties. As U.S. consumers continue to enjoy elegant dining practices, food presentation and styling have become integral to the overall experience.
As premium tabletop kitchen products are known to uplift the aesthetics of food, their demand among households continues to soar. Players operating in the market are witnessing growing demand for vintage dinnerware and glassware as such styles are considered fashionable.
Reasons to subscribe to U.S. tabletop kitchen products market databook:
-
Access to comprehensive data: Horizon Databook provides over 1 million market statistics and 20,000+ reports, offering extensive coverage across various industries and regions.
-
Informed decision making: Subscribers gain insights into market trends, customer preferences, and competitor strategies, empowering informed business decisions.
-
Cost-Effective solution: It's recognized as the world's most cost-effective market research database, offering high ROI through its vast repository of data and reports.
-
Customizable reports: Tailored reports and analytics allow companies to drill down into specific markets, demographics, or product segments, adapting to unique business needs.
-
Strategic advantage: By staying updated with the latest market intelligence, companies can stay ahead of competitors, anticipate industry shifts, and capitalize on emerging opportunities.
Target buyers of U.S. tabletop kitchen products market databook
-
Our clientele includes a mix of tabletop kitchen products market companies, investment firms, advisory firms & academic institutions.
-
30% of our revenue is generated working with investment firms and helping them identify viable opportunity areas.
-
Approximately 65% of our revenue is generated working with competitive intelligence & market intelligence teams of market participants (manufacturers, service providers, etc.).
-
The rest of the revenue is generated working with academic and research not-for-profit institutes. We do our bit of pro-bono by working with these institutions at subsidized rates.
Horizon Databook provides a detailed overview of country-level data and insights on the U.S. tabletop kitchen products market , including forecasts for subscribers. This country databook contains high-level insights into U.S. tabletop kitchen products market from 2016 to 2030, including revenue numbers, major trends, and company profiles.
Partial client list
U.S. tabletop kitchen products market size, by type, 2016-2030 (US$M)

U.S. Tabletop Kitchen Products Market Outlook Share, 2023 & 2030 (US$M)


Related statistics
Sign up - it's easy, and free!
Sign up and get instant basic access to databook, upgrade
when ready, or enjoy our
free plan indefinitely.
Included in Horizon account
- 30K+ Global Market Reports
- 120K+ Country Reports
- 1.2M+ Market Statistics
- 200K+ Company Profiles
- Industry insights and more