Asia Pacific User And Entity Behavior Analytics Market Size & Outlook
Related Markets
Asia Pacific user and entity behavior analytics market highlights
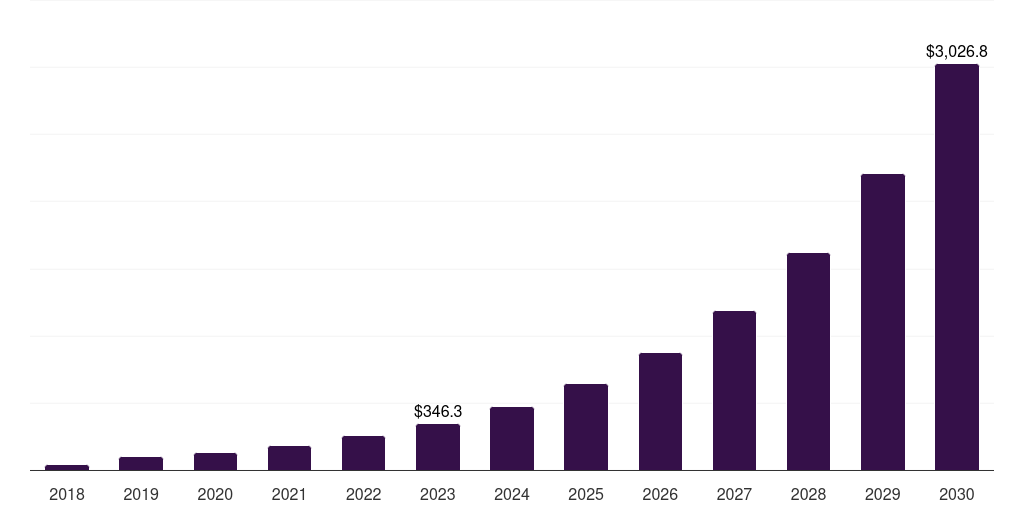
- The Asia Pacific user and entity behavior analytics market generated a revenue of USD 346.3 million in 2023.
- The market is expected to grow at a CAGR of 36.3% from 2024 to 2030.
- In terms of segment, solution was the largest revenue generating component in 2023.
- Services is the most lucrative component segment registering the fastest growth during the forecast period.
- Country-wise, India is expected to register the highest CAGR from 2024 to 2030.
Asia Pacific data book summary
| Market revenue in 2023 | USD 346.3 million |
| Market revenue in 2030 | USD 3,026.8 million |
| Growth rate | 36.3% (CAGR from 2023 to 2030) |
| Largest segment | Solution |
| Fastest growing segment | Services |
| Historical data covered | 2018 - 2022 |
| Base year for estimation | 2023 |
| Forecast period covered | 2024 - 2030 |
| Quantitative units | Revenue in USD million |
| Market segmentation | Solution, Services |
| Key market players worldwide | Microsoft Corp, Check Point Software Technologies Ltd, Varonis Systems Inc, Palo Alto Networks Inc, International Business Machines Corp, Fortinet Inc, Rapid7 Inc, Cisco Systems Inc, Thoma Bravo, McAfee, Exabeam, F-Secure Corp, Broadcom Inc |
Other key industry trends
- In terms of revenue, Asia Pacific region accounted for 21.5% of the global user and entity behavior analytics market in 2023.
- Globally, Europe is projected to lead the regional market in terms of revenue in 2030.
- Asia Pacific is the fastest growing regional market and is projected to reach USD 3,026.8 million by 2030.
No credit card required*
Horizon in a snapshot
- 30K+ Global Market Reports
- 120K+ Country Reports
- 1.2M+ Market Statistics
- 200K+ Company Profiles
- Industry insights and more
User And Entity Behavior Analytics Market Scope
User And Entity Behavior Analytics Market Companies
| Name | Profile | # Employees | HQ | Website |
|---|---|---|---|---|
| Varonis Systems Inc | View profile | 2233 | 1250 Broadway, 28th Floor, New York, NY, United States, 10001 | https://www.varonis.com |
| Thoma Bravo | View profile | 251-500 | Chicago, Illinois, United States, North America | https://www.thomabravo.com |
| Rapid7 Inc | View profile | 2228 | 120 Causeway Street, Boston, MA, United States, 02114 | https://www.rapid7.com |
| McAfee | View profile | 5001-10000 | Santa Clara, California, United States, North America | http://www.mcafee.com |
| Exabeam | View profile | 501-1000 | Foster City, California, United States, North America | http://www.exabeam.com |
| F-Secure Corp | View profile | 497 | Tammasaarenkatu 7, P.O. Box 24, Helsinki, Finland, 00180 | https://www.f-secure.com |
| Palo Alto Networks Inc | View profile | 15166 | 3000 Tannery Way, Santa Clara, CA, United States, 95054 | https://www.paloaltonetworks.com |
| Check Point Software Technologies Ltd | View profile | 6450 | 5 Shlomo Kaplan Street, Tel Aviv, Israel, 6789159 | https://www.checkpoint.com |
| Cisco Systems Inc | View profile | 84900 | 170 West Tasman Drive, San Jose, CA, United States, 95134-1706 | https://www.cisco.com |
| Fortinet Inc | View profile | 13522 | 909 Kifer Road, Sunnyvale, CA, United States, 94086 | https://www.fortinet.com |
| Broadcom Inc | View profile | 20000 | 3421 Hillview Avenue, Palo Alto, CA, United States, 94304 | https://www.broadcom.com |
| Microsoft Corp | View profile | 221000 | One Microsoft Way, Redmond, WA, United States, 98052-6399 | https://www.microsoft.com |
| International Business Machines Corp | View profile | 282200 | One New Orchard Road, Armonk, NY, United States, 10504 | http://www.ibm.com |
Asia Pacific user and entity behavior analytics market outlook
The databook is designed to serve as a comprehensive guide to navigating this sector. The databook focuses on market statistics denoted in the form of revenue and y-o-y growth and CAGR across the globe and regions. A detailed competitive and opportunity analyses related to user and entity behavior analytics market will help companies and investors design strategic landscapes.
Solution was the largest segment with a revenue share of 69.39% in 2023. Horizon Databook has segmented the Asia Pacific user and entity behavior analytics market based on solution, services covering the revenue growth of each sub-segment from 2018 to 2030.
Reasons to subscribe to Asia Pacific user and entity behavior analytics market databook:
-
Access to comprehensive data: Horizon Databook provides over 1 million market statistics and 20,000+ reports, offering extensive coverage across various industries and regions.
-
Informed decision making: Subscribers gain insights into market trends, customer preferences, and competitor strategies, empowering informed business decisions.
-
Cost-Effective solution: It's recognized as the world's most cost-effective market research database, offering high ROI through its vast repository of data and reports.
-
Customizable reports: Tailored reports and analytics allow companies to drill down into specific markets, demographics, or product segments, adapting to unique business needs.
-
Strategic advantage: By staying updated with the latest market intelligence, companies can stay ahead of competitors, anticipate industry shifts, and capitalize on emerging opportunities.
Target buyers of Asia Pacific user and entity behavior analytics market databook
-
Our clientele includes a mix of user and entity behavior analytics market companies, investment firms, advisory firms & academic institutions.
-
30% of our revenue is generated working with investment firms and helping them identify viable opportunity areas.
-
Approximately 65% of our revenue is generated working with competitive intelligence & market intelligence teams of market participants (manufacturers, service providers, etc.).
-
The rest of the revenue is generated working with academic and research not-for-profit institutes. We do our bit of pro-bono by working with these institutions at subsidized rates.
Horizon Databook provides a detailed overview of continent-level data and insights on the Asia Pacific user and entity behavior analytics market, including forecasts for subscribers. This continent databook contains high-level insights into Asia Pacific user and entity behavior analytics market from 2018 to 2030, including revenue numbers, major trends, and company profiles.
Partial client list
Asia Pacific user entity behavior analytics market report size, by country, 2018-2030 (US$M)

Asia Pacific User And Entity Behavior Analytics Market Share, 2023 & 2030 (US$M)


Related statistics
Sign up - it's easy, and free!
Sign up and get instant basic access to databook, upgrade
when ready, or enjoy our
free plan indefinitely.
Included in Horizon account
- 30K+ Global Market Reports
- 120K+ Country Reports
- 1.2M+ Market Statistics
- 200K+ Company Profiles
- Industry insights and more