U.S. Virtual Events Market Size & Outlook, 2025-2030
Related Markets
U.S. virtual events market highlights
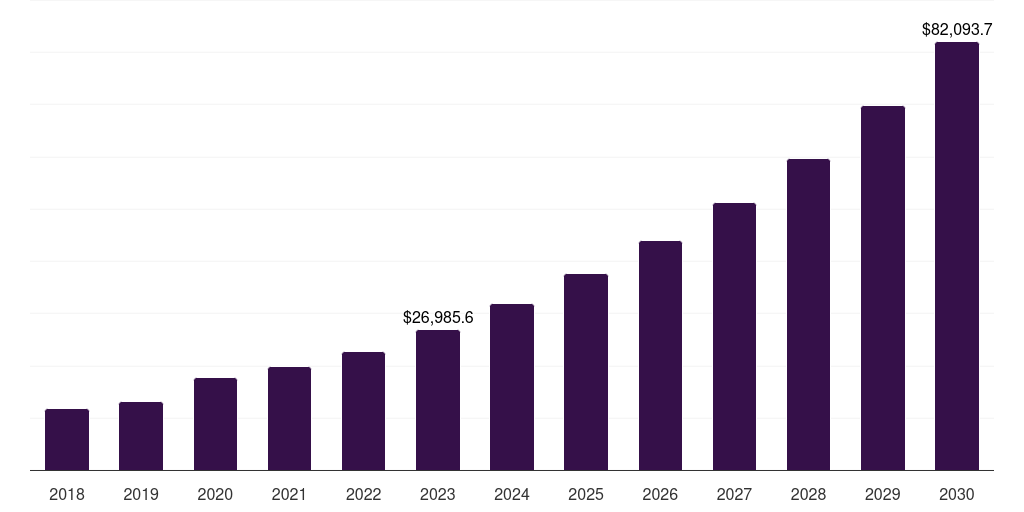
- The U.S. virtual events market generated a revenue of USD 27,670.3 million in 2024 and is expected to reach USD 77,472.3 million by 2030.
- The U.S. market is expected to grow at a CAGR of 18.7% from 2025 to 2030.
- In terms of segment, external event was the largest revenue generating event type in 2024.
- Extended Event is the most lucrative event type segment registering the fastest growth during the forecast period.
Virtual events market data book summary
| Market revenue in 2024 | USD 27,670.3 million |
| Market revenue in 2030 | USD 77,472.3 million |
| Growth rate | 18.7% (CAGR from 2025 to 2030) |
| Largest segment | External event |
| Fastest growing segment | Extended Event |
| Historical data | 2018 - 2023 |
| Base year | 2024 |
| Forecast period | 2025 - 2030 |
| Quantitative units | Revenue in USD million |
| Market segmentation | Internal Event, External Event, Extended Event |
| Key market players worldwide | AliveCor, Avaya, Alexium International Group Ltd, NTT Data Group Corp, Cisco Systems Inc, Microsoft Corp, Zoom Video Communications Inc |
Other key industry trends
- In terms of revenue, U.S. accounted for 28.2% of the global virtual events market in 2024.
- Country-wise, U.S. is expected to lead the global market in terms of revenue in 2030.
- In North America, U.S. virtual events market is projected to lead the regional market in terms of revenue in 2030.
- Mexico is the fastest growing regional market in North America and is projected to reach USD 11,291.1 million by 2030.
No credit card required*
Horizon in a snapshot
- 30K+ Global Market Reports
- 120K+ Country Reports
- 1.2M+ Market Statistics
- 200K+ Company Profiles
- Industry insights and more
Virtual Events Market Scope
Virtual Events Market Companies
| Name | Profile | # Employees | HQ | Website |
|---|---|---|---|---|
| AliveCor | View profile | 101-250 | Mountain View, California, United States, North America | https://alivecor.com |
| NTT Data Group Corp | View profile | 202667 | Toyosu Center Building, 3-3, Toyosu 3-chome, Koto-ku, Yubinbango, Tokyo, Japan, 135-6033 | https://www.nttdata.com |
| Alexium International Group Ltd | View profile | 319 | 350 West Phillips Road, Greer, SC, United States, 29650 | https://www.alexiuminternational.com |
| Avaya | View profile | 10001+ | Durham, North Carolina, United States, North America | http://www.avaya.com |
| Cisco Systems Inc | View profile | 84900 | 170 West Tasman Drive, San Jose, CA, United States, 95134-1706 | https://www.cisco.com |
| Zoom Video Communications Inc | View profile | 7420 | 55 Almaden Boulevard, 6th Floor, San Jose, CA, United States, 95113 | https://www.zoom.com |
| Microsoft Corp | View profile | 221000 | One Microsoft Way, Redmond, WA, United States, 98052-6399 | https://www.microsoft.com |
U.S. virtual events market outlook
The databook is designed to serve as a comprehensive guide to navigating this sector. The databook focuses on market statistics denoted in the form of revenue and y-o-y growth and CAGR across the globe and regions. A detailed competitive and opportunity analyses related to virtual events market will help companies and investors design strategic landscapes.
External event was the largest segment with a revenue share of 40.97% in 2024. Horizon Databook has segmented the U.S. virtual events market based on internal event, external event, extended event covering the revenue growth of each sub-segment from 2018 to 2030.
- U.S. Virtual Events Event Type Outlook (Revenue, USD Million, 2018-2030)
- External Event
- Internal Event
- Extended Event
- U.S. Virtual Events Service Outlook (Revenue, USD Million, 2018-2030)
- Communication
- Sales & Marketing
- Training
- Recruitment
- U.S. Virtual Events Establishment Size Outlook (Revenue, USD Million, 2018-2030)
- SMBs
- Large Institutions
- U.S. Virtual Events End Use Outlook (Revenue, USD Million, 2018-2030)
- Organizations
- Educational Institution
- Enterprises
- Others
- U.S. Virtual Events Application Outlook (Revenue, USD Million, 2018-2030)
- Conferences
- Summits
- Others
- Exhibitions/Trade Shows
- U.S. Virtual Events Industry Vertical Outlook (Revenue, USD Million, 2018-2030)
- Healthcare
- Telecom
- BFSI
- Information Technology
- Media & Entertainment
- Consumer Electronics
- Manufacturing
- Others
- U.S. Virtual Events Use Case Outlook (Revenue, USD Million, 2018-2030)
- Everyday events
- Large-scale events
Reasons to subscribe to U.S. virtual events market databook:
-
Access to comprehensive data: Horizon Databook provides over 1 million market statistics and 20,000+ reports, offering extensive coverage across various industries and regions.
-
Informed decision making: Subscribers gain insights into market trends, customer preferences, and competitor strategies, empowering informed business decisions.
-
Cost-Effective solution: It's recognized as the world's most cost-effective market research database, offering high ROI through its vast repository of data and reports.
-
Customizable reports: Tailored reports and analytics allow companies to drill down into specific markets, demographics, or product segments, adapting to unique business needs.
-
Strategic advantage: By staying updated with the latest market intelligence, companies can stay ahead of competitors, anticipate industry shifts, and capitalize on emerging opportunities.
Target buyers of U.S. virtual events market databook
-
Our clientele includes a mix of virtual events market companies, investment firms, advisory firms & academic institutions.
-
30% of our revenue is generated working with investment firms and helping them identify viable opportunity areas.
-
Approximately 65% of our revenue is generated working with competitive intelligence & market intelligence teams of market participants (manufacturers, service providers, etc.).
-
The rest of the revenue is generated working with academic and research not-for-profit institutes. We do our bit of pro-bono by working with these institutions at subsidized rates.
Horizon Databook provides a detailed overview of country-level data and insights on the U.S. virtual events market , including forecasts for subscribers. This country databook contains high-level insights into U.S. virtual events market from 2018 to 2030, including revenue numbers, major trends, and company profiles.
Partial client list
U.S. virtual events market size, by service, 2018-2030 (US$M)

U.S. Virtual Events Market Outlook Share, 2024 & 2030 (US$M)


Related statistics
Sign up - it's easy, and free!
Sign up and get instant basic access to databook, upgrade
when ready, or enjoy our
free plan indefinitely.
Included in Horizon account
- 30K+ Global Market Reports
- 120K+ Country Reports
- 1.2M+ Market Statistics
- 200K+ Company Profiles
- Industry insights and more