- Home
- »
- Consumer F&B
- »
-
Reduced Salt Food Products Market Size & Share Report 2030GVR Report cover
![Reduced Salt Food Products Market Size, Share & Trends Report]()
Reduced Salt Food Products Market Size, Share & Trends Analysis Report By Product Type (Meat, Poultry, & Seafood, Snacks), By Distribution Channel (Offline, Online), By Region (APAC, North America), And Segment Forecasts, 2022 - 2030
- Report ID: GVR-4-68039-969-5
- Number of Pages: 80
- Format: Electronic (PDF)
- Historical Range: 2017 - 2020
- Industry: Consumer Goods
Report Overview
The global reduced salt food products market size was valued at USD 315.6 billion in 2021 and is anticipated to expand at a compound annual growth rate (CAGR) of 5.1% over the forecast period from 2022 to 2030. The growth of the market is attributed to the rising prevalence of chronic diseases including hypertension, kidney diseases, Cardiovascular Diseases (CVDs), and others. The rising penetration of such diseases results in the growing usage of low sodium packaged food products among them, thus driving the industry growth. The COVID-19 pandemic had negatively influenced various industries across the globe owing to lockdowns and shutdowns of manufacturing industries as per the guidelines by various regional governments.

This also resulted in having negative impacts on supply and distribution channels and they affected both the demand and supply of consumer goods and products. The COVID-19 pandemic provided a significant experience to the consumers that highlighted the importance of healthy eating and encouraged them to adopt the same. It encouraged them to reduce the consumption of processed foods containing excessive salt or additives. This resulted in increasing consumption of food products that contain low or reduced sodium thus reflecting a positive influence on the global industry.
The growing awareness among consumers regarding health along with their rising consciousness about negative health consequences caused by the high consumption of sodium is expected to boostproduct demandover the forecast period. In addition, the growing production of low-sodium foods and reduction in sodium levels in the existing products by manufacturers along with easy product availability through various sales channels areprojectedtoboost the industry growth in the coming years. The need and demand for food products that have low sodium content by the targeted population are expected to fuel the growth during the forecast years.
These products are comparatively high-priced than regular food products, which is expected to hinder the industry growth. Moreover, the manufacturing of such products requires thorough research and development along with advanced food technology, which slows down the production process, thus further hampering the overall industry growth. However, several initiatives regarding sodium content reduction are undertaken by various governments, which are expected to create growth opportunities for the industry players. In addition, increasing usage of salt alternatives along with usage of salt reduction technologies by manufacturers is further anticipated to present lucrative opportunities for the industry in the coming years.
Product Type Insights
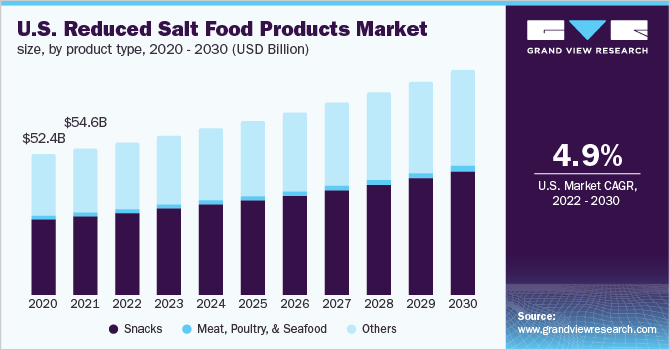
On the basis of product types, the global industry has been further categorized into snacks, meat, poultry, & seafood, and others. The snacks segment dominated the global industryin 2021 and accounted for the maximum share of more than 53.75% of the overall revenue.The segment is expected to expand further at the fastest CAGR retaining its dominant industry position throughout the forecast years. This growth can be attributed due to the high consumption of low sodium snacks among consumers suffering from high blood pressure or hypertensive issues.
Moreover, the rising demand and availability of low-sodium snacks in developing countries will contribute to the growth of the segment over the forecast period. On the other hand, the others product type segment is expected to grow at a significant CAGR during the forecast period. The segment growth can be attributed to the increasing demand for Ready-To-Eat (RTE) foods among consumers. Hectic lifestyles, a rising number of working individuals, and growing per capita spending have resulted in the increased demand for such RTE and processed food products, thus driving the segment. Moreover, the rising concerns about health and shifting dietary choices have led to a rise in demand for these products.
Distribution Channel Insights
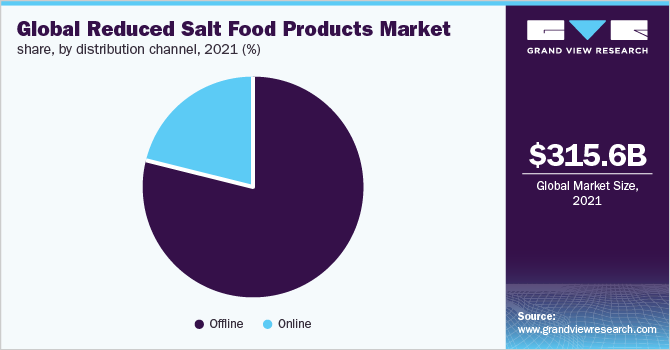
The offline segment dominated the global industryin 2021 and accounted for the maximum share of more than 79.00% of the overall revenue. The segment will expand further at a steady CAGR retaining its leading position during the forecast period. The rising product sales through various offline channels, as they provide a unique shopping experience, is contributing to the dominance of the segment. Moreover, offline channels provide the feasibility of physical verification of products along with providing various promotional offers, which is contributing to revenue generation in this segment.

Moreover, assistance from experts is available in offline stores, thus resulting in high product sales through these channels.The online distribution channel is expected to register the fastest CAGR during the forecast period. The coronavirus pandemic significantly impacted the distribution channels and dramatically changed the overall landscape resulting in rapid development and usage of the online distribution channels. Due to the pandemic, the preference of consumers changed to contactless shopping to avoid the spread of the virus leading to an increased usage of online channels for shopping. The online channels provide various benefits, such as discounts on product prices andhome delivery, which will drive the segment further.
Regional Insights
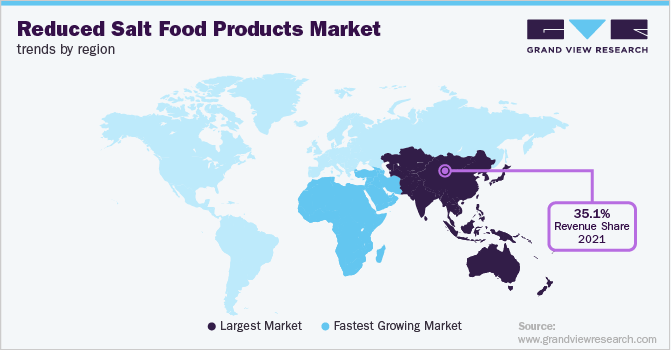
Asia Pacific dominated the global industry in 2021 and accounted for the highest share of more than 35.10% of the overall industry. It is projected to expand further at a significant CAGR over the forecast period. The dominance and the growth of the region are attributed to a rise in health concerns among the target population in the region. These health issues occur due to unhealthy lifestyle and eating habits, which lead to the high demand for low-sodium foods. Moreover, the rising disposable income levels coupled with the increasing focus on health are further expected to drive the market growth in the region.

In addition, the presence of various supportive government policies coupled with the growing technological innovations in the food & beverages industry is also expected to boost the growth. Thus, the aforementioned factors are expected to drive the regional market.Middle East & Africa is estimated to grow at the fastest CAGR during the forecast period. The rapid growth of the region can beattributed to the adoption of healthy eating habits by consumers as a result of the rising cases of chronic diseases. Furthermore, health-conscious consumers are investing in nutritious food as a result of the rising awareness, thus contributing to the rapid growth of the regional market.
Key Companies & Market Share Insights
The global industry is moderately fragmented as well as still in the developing stage with global players engaging in product innovation strategies. Key players are adopting various steps to strengthen their presencein the industry. These steps include strategies, such as partnerships, mergers & acquisitions, development & launch of new products, and global expansion. For instance, in July 2021, Food for Life Baking Co. announced the addition of new low-sodium products. These products include cereal, muffins, and tortillas with zero added salt. Some of the prominent players in the global reduced salt food products market include:
-
General Mills, Inc.
-
PepsiCo, Inc.
-
Kellogg Company
-
The Kraft Heinz Company
-
Nestlé S.A.
-
Conagra Brands, Inc.
-
Tyson Foods, Inc.
-
Hormel Foods Corp.
-
Maple Leaf Foods Inc.
-
Smithfield Foods, Inc.
Reduced Salt Food Products Market Report Scope
Report Attribute
Details
Market size value in 2022
USD 329.5 billion
Revenue forecast in 2030
USD 495.1 billion
Growth Rate
CAGR of 5.1% from 2022 to 2030
Base year for estimation
2021
Historical data
2017 - 2020
Forecast period
2022 - 2030
Quantitative units
Revenue in USD billion and CAGR from 2022 to 2030
Report coverage
Revenue forecast, company ranking, competitive landscape, growth factors, and trends
Segments covered
Product type, distribution channel, region
Regional scope
North America; Europe; Asia Pacific; Central & South America; Middle East & Africa
Country scope
U.S.; Canada; Mexico; U.K.; Germany; France; Italy; Spain; China; Japan; India; South Korea; Indonesia; Brazil; South Africa
Key companies profiled
General Mills, Inc.; PepsiCo, Inc.; Kellogg Company; The Kraft Heinz Company; Nestlé S.A.; Conagra Brands, Inc.; Tyson Foods, Inc.; Hormel Foods Corporation; Maple Leaf Foods Inc.; Smithfield Foods, Inc.
Customization scope
Free report customization (equivalent up to 8 analysts working days) with purchase. Addition or alteration to country, regional & segment scope.
Pricing and purchase options
Avail customized purchase options to meet your exact research needs. Explore purchase options
Global Reduced Salt Food Products Market Segmentation
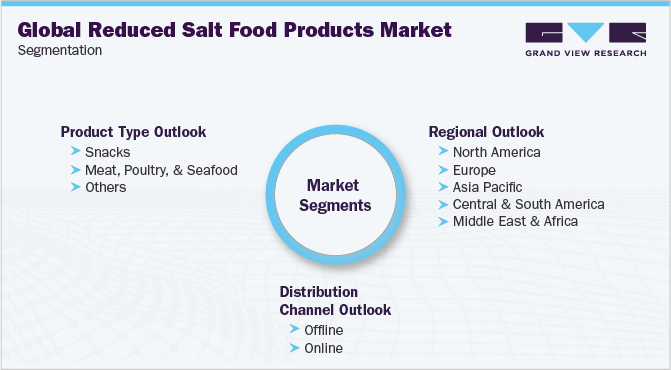
This report forecasts revenue growth at global, regional, and country levels and provides an analysis of the latest industry trends in each of the sub-segments from 2017 to 2030. Grand View Research has segmented the global reduced salt food products market report based on product type, distribution channel, and region:

-
Product Type Outlook (Revenue, USD Billion, 2017 - 2030)
-
Snacks
-
Meat, Poultry, & Seafood
-
Others
-
-
Distribution Channel Outlook (Revenue, USD Billion, 2017 - 2030)
-
Offline
-
Online
-
-
Regional Outlook (Revenue, USD Billion, 2017 - 2030)
-
North America
-
U.S.
-
Canada
-
Mexico
-
-
Europe
-
U.K.
-
Germany
-
France
-
Italy
-
Spain
-
-
Asia Pacific
-
China
-
Japan
-
India
-
South Korea
-
Indonesia
-
-
Central and South America
-
Brazil
-
-
Middle East and Africa
-
South Africa
-
-
Frequently Asked Questions About This Report
b. The global reduced salt food products market size was estimated at USD 315.6 billion in 2021 and is expected to reach USD 329.5 billion in 2022.
b. The global reduced salt food products market is expected to grow at a compound annual growth rate of 5.1% from 2022 to 2030 to reach USD 495.1 billion by 2030.
b. Asia Pacific dominated the low reduced salt food products market with a share of 35.2% in 2021. The high share of the region is attributed to the rising demand for food products containing low sodium due to increasing health issues among the consumers due to unhealthy lifestyles.
b. Some of the key players operating in the reduced salt food products market include General Mills, Inc., PepsiCo, Inc., Kellogg Company, The Kraft Heinz Company, Nestlé S.A., Conagra Brands, Inc., Tyson Foods, Inc., Hormel Foods Corporation, Maple Leaf Foods Inc., Smithfield Foods, Inc.
b. The reduced salt food products market is driven by the rising use and demand for low sodium packaged food products due to the growing prevalence of chronic diseases such as cardiovascular diseases, hypertension, and others.
Share this report with your colleague or friend.
![gvr icn]()
NEED A CUSTOM REPORT?
We can customize every report - free of charge - including purchasing stand-alone sections or country-level reports, as well as offer affordable discounts for start-ups & universities. Contact us now
![Certified Icon]()
We are GDPR and CCPA compliant! Your transaction & personal information is safe and secure. For more details, please read our privacy policy.
We are committed towards customer satisfaction, and quality service.
"The quality of research they have done for us has been excellent."


