Asia Pacific Advanced Composites Market Size & Outlook
Related Markets
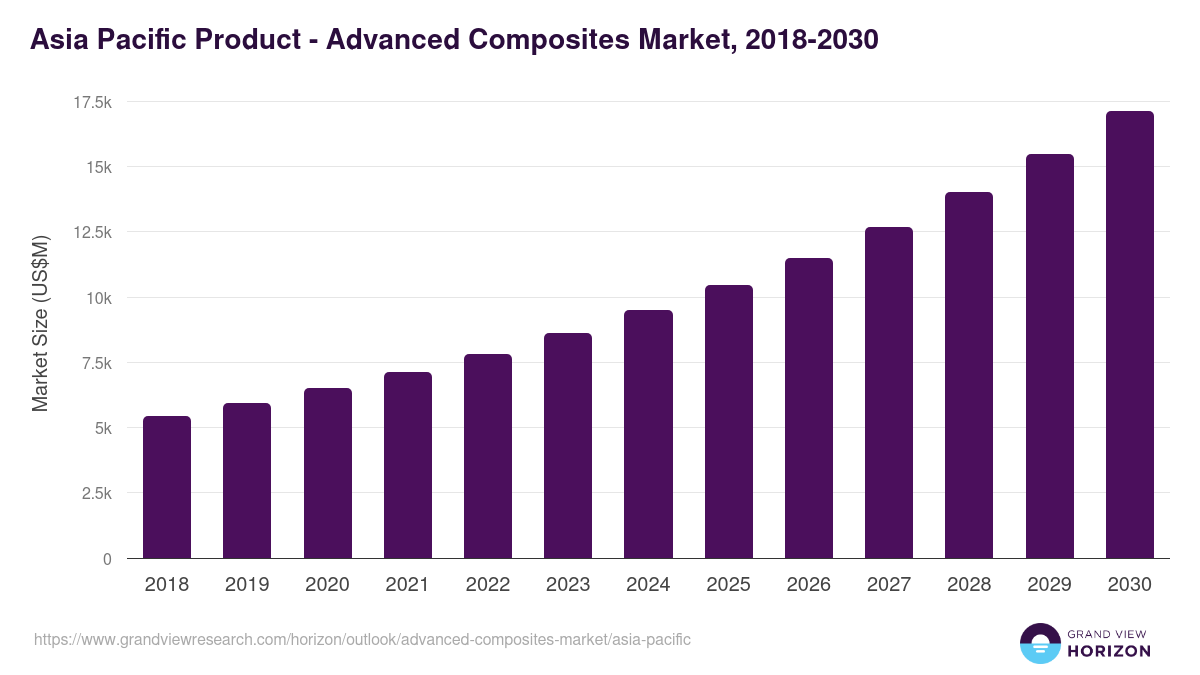
Asia Pacific advanced composites market highlights
- The Asia Pacific advanced composites market generated a revenue of USD 8,625.0 million in 2023.
- The market is expected to grow at a CAGR of 10.3% from 2024 to 2030.
- In terms of segment, carbon fiber composites was the largest revenue generating product in 2023.
- Carbon Fiber Composites is the most lucrative product segment registering the fastest growth during the forecast period.
- Country-wise, India is expected to register the highest CAGR from 2024 to 2030.
Asia Pacific data book summary
| Market revenue in 2023 | USD 8,625.0 million |
| Market revenue in 2030 | USD 17,124.5 million |
| Growth rate | 10.3% (CAGR from 2024 to 2030) |
| Largest segment | Carbon fiber composites |
| Fastest growing segment | Carbon Fiber Composites |
| Historical data covered | 2018 - 2022 |
| Base year for estimation | 2023 |
| Forecast period covered | 2024 - 2030 |
| Quantitative units | Revenue in USD million |
| Market segmentation | Aramid Fiber Composites, Carbon Fiber Composites, Glass Fiber Composites |
| Key market players worldwide | Toray Industries Inc, Teijin Ltd, Hexcel Corp, SGL Group, Cytec Industries, Owens-Corning Inc, DuPont de Nemours Inc, Huntsman Corp, Formosa Plastics Group, Plasan Carbon Composites |
Other key industry trends
- In terms of revenue, Asia Pacific region accounted for 22.9% of the global advanced composites market in 2023.
- Globally, North America is projected to lead the regional market in terms of revenue in 2030.
- Asia Pacific is the fastest growing regional market and is projected to reach USD 17,124.5 million by 2030.
No credit card required*
Horizon in a snapshot
- 30K+ Global Market Reports
- 120K+ Country Reports
- 1.2M+ Market Statistics
- 200K+ Company Profiles
- Industry insights and more
Advanced Composites Market Scope
Advanced Composites Market Companies
| Name | Profile | # Employees | HQ | Website |
|---|---|---|---|---|
| Plasan Carbon Composites | View profile | 501-1000 | Walker, Michigan, United States, North America | http://www.PlasanCarbon.com |
| Formosa Plastics Group | View profile | 1001-5000 | Taipei, T'ai-pei, Taiwan, Asia | https://www.fpg.com.tw/ |
| Owens-Corning Inc | View profile | 18000 | One Owens Corning Parkway, Toledo, OH, United States, 43659 | https://www.owenscorning.com |
| Cytec Industries | View profile | 1001-5000 | Little Falls, New Jersey, United States, North America | http://cytec.com |
| SGL Group | View profile | 11-50 | Adelaide, South Australia, Australia, Oceania | https://www.sglgroup.net |
| Hexcel Corp | View profile | 5590 | 281 Tresser Boulevard, Two Stamford Plaza, 16th Floor, Stamford, CT, United States, 06901 | https://www.hexcel.com |
| Teijin Ltd | View profile | 24499 | 6-7, Minami Hommachi 1-chome, Chuo-ku, Osaka, Japan, 541-8587 | http://www.teijin.co.jp |
| Toray Industries Inc | View profile | 48682 | Nihonbashi Mitsui Tower 2-1-1, Nihonbashi Muromach, Chuo-ku, Tokyo, Japan, 103-8666 | http://www.toray.co.jp |
| DuPont de Nemours Inc | View profile | 24000 | 974 Centre Road, Building 730, Wilmington, DE, United States, 19805 | https://www.dupont.com |
| Huntsman Corp | View profile | 6000 | 10003 Woodloch Forest Drive, The Woodlands, TX, United States, 77380 | https://www.huntsman.com |
Asia Pacific advanced composites market outlook
The databook is designed to serve as a comprehensive guide to navigating this sector. The databook focuses on market statistics denoted in the form of revenue and y-o-y growth and CAGR across the globe and regions. A detailed competitive and opportunity analyses related to advanced composites market will help companies and investors design strategic landscapes.
Carbon fiber composites was the largest segment with a revenue share of 70.59% in 2023. Horizon Databook has segmented the Asia Pacific advanced composites market based on aramid fiber composites, carbon fiber composites, glass fiber composites covering the revenue growth of each sub-segment from 2018 to 2030.
Reasons to subscribe to Asia Pacific advanced composites market databook:
-
Access to comprehensive data: Horizon Databook provides over 1 million market statistics and 20,000+ reports, offering extensive coverage across various industries and regions.
-
Informed decision making: Subscribers gain insights into market trends, customer preferences, and competitor strategies, empowering informed business decisions.
-
Cost-Effective solution: It's recognized as the world's most cost-effective market research database, offering high ROI through its vast repository of data and reports.
-
Customizable reports: Tailored reports and analytics allow companies to drill down into specific markets, demographics, or product segments, adapting to unique business needs.
-
Strategic advantage: By staying updated with the latest market intelligence, companies can stay ahead of competitors, anticipate industry shifts, and capitalize on emerging opportunities.
Target buyers of Asia Pacific advanced composites market databook
-
Our clientele includes a mix of advanced composites market companies, investment firms, advisory firms & academic institutions.
-
30% of our revenue is generated working with investment firms and helping them identify viable opportunity areas.
-
Approximately 65% of our revenue is generated working with competitive intelligence & market intelligence teams of market participants (manufacturers, service providers, etc.).
-
The rest of the revenue is generated working with academic and research not-for-profit institutes. We do our bit of pro-bono by working with these institutions at subsidized rates.
Horizon Databook provides a detailed overview of continent-level data and insights on the Asia Pacific advanced composites market , including forecasts for subscribers. This continent databook contains high-level insights into Asia Pacific advanced composites market from 2018 to 2030, including revenue numbers, major trends, and company profiles.
Partial client list
Asia Pacific advanced composites market size, by country, 2018-2030 (US$M)

Asia Pacific Advanced Composites Market Outlook Share, 2023 & 2030 (US$M)


Related statistics
Sign up - it's easy, and free!
Sign up and get instant basic access to databook, upgrade
when ready, or enjoy our
free plan indefinitely.
Included in Horizon account
- 30K+ Global Market Reports
- 120K+ Country Reports
- 1.2M+ Market Statistics
- 200K+ Company Profiles
- Industry insights and more