U.S. Optical Interconnect Market Size & Outlook, 2026-2033
- Enterprise Technology & Automation
- Physical Security & Surveillance
- Optical Interconnect Market Outlook
- Physical Security & Surveillance
Global Market
Related Markets
Ask a question about the optical interconnect market
U.S. optical interconnect market highlights
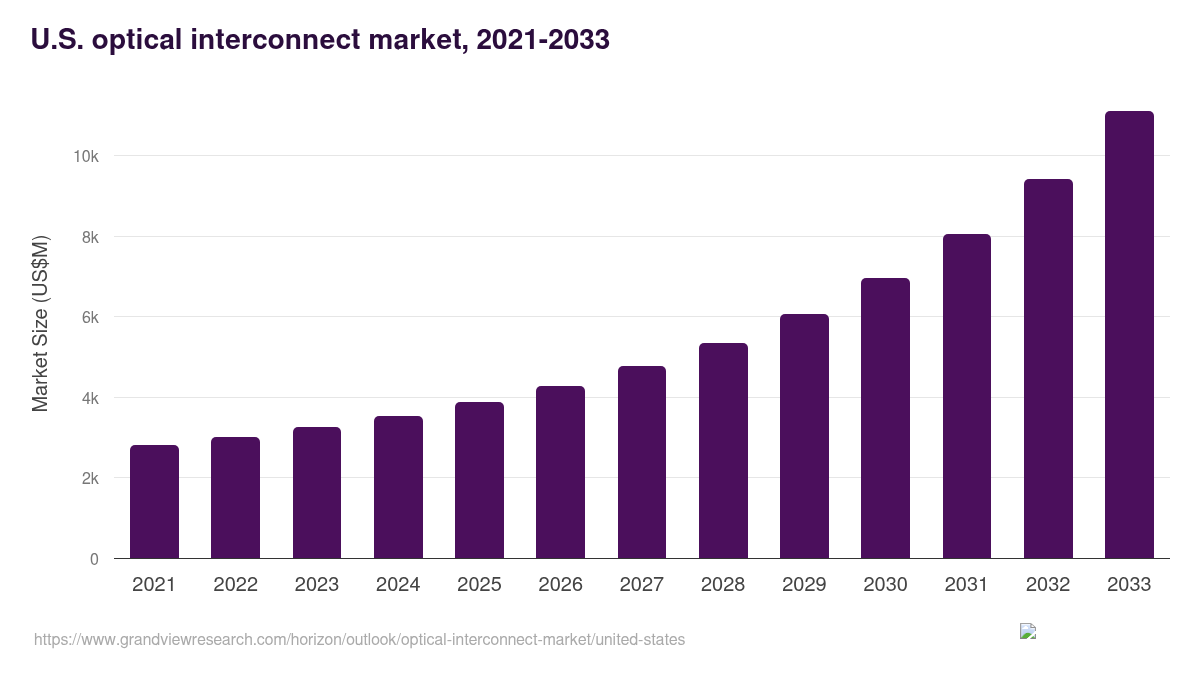
- The U.S. optical interconnect market generated a revenue of USD 3,875.4 million in 2025 and is expected to reach USD 11,098.4 million by 2033.
- The U.S. market is expected to grow at a CAGR of 14.6% from 2026 to 2033.
- In terms of segment, optical transceivers was the largest revenue generating product in 2025.
- Silicon Photonics is the most lucrative product segment registering the fastest growth during the forecast period.
Optical interconnect market data book summary
| Market revenue in 2025 | USD 3,875.4 million |
| Market revenue in 2033 | USD 11,098.4 million |
| Growth rate | 14.6% (CAGR from 2026 to 2033) |
| Largest segment | Optical transceivers |
| Fastest growing segment | Silicon Photonics |
| Historical data | 2021 - 2024 |
| Base year | 2025 |
| Forecast period | 2026 - 2033 |
| Quantitative units | Revenue in USD million |
| Market segmentation | Free Space Optics, Fiber, and Waveguides, Silicon Photonics, Optical Engines, Cable Assemblies, Connectors, Optical Transceivers, PIC-based Interconnects |
| Key market players worldwide | Amphenol Corp Class A, Broadcom Inc, Coherent Corp, Fujitsu Ltd, Innolight, Lumentum, NVIDIA Corp, Sumitomo Electric Industries Ltd, TE Connectivity Ltd |
Other key industry trends
- In terms of revenue, U.S. accounted for 21.7% of the global optical interconnect market in 2025.
- Country-wise, U.S. is expected to lead the global market in terms of revenue in 2033.
- In North America, U.S. optical interconnect market is projected to lead the regional market in terms of revenue in 2033.
- Mexico is the fastest growing regional market in North America and is projected to reach USD 1,867.9 million by 2033.
No credit card required*
Publish Date: Jun 29, 2026
Customize the Report
20% free customization
- Include
- Countries, segments, points
- Tailor
- To your product definition
- Extend
- Deeper competitor detail
- Or
- A fully bespoke study
Horizon in a snapshot
- 30K+ Global Market Reports
- 120K+ Country Reports
- 1.2M+ Market Statistics
- 200K+ Company Profiles
- Industry insights and more
Optical Interconnect Market Scope
Optical Interconnect Market Companies
| Name | Profile | # Employees | HQ | Website |
|---|---|---|---|---|
| Fujitsu Ltd | View profile | 124,055 | Shiodome City Center, 1-5-2 Higashi-Shimbashi, Minato-ku, Tokyo, Japan, 105-7123 | www.fujitsu.com |
| NVIDIA Corp | View profile | 29,600 | 2788 San Tomas Expressway, Santa Clara, CA, United States, 95051 | www.nvidia.com |
| Broadcom Inc | View profile | 20,000 | 3421 Hillview Avenue, Palo Alto, CA, United States, 94304 | www.broadcom.com |
| Amphenol Corp Class A | View profile | 95,000 | 358 Hall Avenue, Wallingford, CT, United States, 06492 | www.amphenol.com |
| TE Connectivity Ltd | View profile | 90,000 | Muhlenstrasse 26, Schaffhausen, Switzerland, CH-8200 | www.te.com |
| Coherent Corp | View profile | 27,000 | 375 Saxonburg Boulevard, Saxonburg, PA, United States, 16056 | www.ii-vi.com |
| Sumitomo Electric Industries Ltd | View profile | 334,716 | 4-5-33, Kitahama, Chuo-ku, Osaka, Japan, 541-0041 | www.sei.co.jp |
| Innolight | View profile | 11-50 | Suzhou, Jiangsu, China, Asia | www.innolight.com/ |
| Lumentum | View profile | 5001-10000 | Milpitas, California, United States, North America | www.lumentum.com/en |
U.S. Optical Interconnect Market Outlook
The databook is designed to serve as a comprehensive guide to navigating this sector. The databook focuses on market statistics denoted in the form of revenue and y-o-y growth and CAGR across the globe and regions. A detailed competitive and opportunity analyses related to Optical Interconnect Market Outlook will help companies and investors design strategic landscapes.
Optical Transceivers was the largest segment with a revenue share of 36.89% in 2025.
Horizon Databook has segmented the U.S. optical interconnect market based on free space optics, fiber, and waveguides, silicon photonics, optical engines, cable assemblies, connectors, optical transceivers, pic-based interconnects covering the revenue growth of each sub-segment from 2021 to 2033.
- U.S. Optical Interconnect Market Product Outlook (Revenue, USD Million , 2021-2033)
- Cable Assemblies
- Connectors
- Optical Transceivers
- Free Space Optics, Fiber, and Waveguides
- Silicon Photonics
- PIC-based Interconnects
- Optical Engines
- U.S. Optical Interconnect Market Fiber Mode Outlook (Revenue, USD Million , 2021-2033)
- Single Fiber Mode
- Multifiber Mode
- U.S. Optical Interconnect Market Data Rate Outlook (Revenue, USD Million , 2021-2033)
- Less than 10 GBPS
- 10 - 50 Gbps
- 50 - 100 Gbps
- More than 100 Gbps
- U.S. Optical Interconnect Market Application Outlook (Revenue, USD Million , 2021-2033)
- Data Communication
- Telecommunication
- U.S. Optical Interconnect Market Distance Outlook (Revenue, USD Million , 2021-2033)
- Less than 10 Km
- 11 - 100 Km
- More than 100 Km
- U.S. Optical Interconnect Market Interconnect Level Outlook (Revenue, USD Million , 2021-2033)
- Metro and Long-Haul Optical Interconnect
- Board-to-Board and Rack-Level Optical Interconnect
- Chip and Board-Level Optical Interconnect
Reasons to subscribe to Optical Interconnect Market Outlook databook
- Access to comprehensive data: Horizon Databook provides over 1 million market statistics and 20,000+ reports, offering extensive coverage across various industries and regions.
- Informed decision making: Subscribers gain insights into market trends, customer preferences, and competitor strategies, empowering informed business decisions.
- Cost-Effective solution: It's recognized as the world's most cost-effective market research database, offering high ROI through its vast repository of data and reports.
- Customizable reports: Tailored reports and analytics allow companies to drill down into specific markets, demographics, or product segments, adapting to unique business needs.
- Strategic advantage: By staying updated with the latest market intelligence, companies can stay ahead of competitors, anticipate industry shifts, and capitalize on emerging opportunities.
Target buyers of Optical Interconnect Market Outlook databook
- Our clientele includes a mix of Optical Interconnect Market Outlook companies, investment firms, advisory firms & academic institutions.
- 30% of our revenue is generated working with investment firms and helping them identify viable opportunity areas.
- Approximately 65% of our revenue is generated working with competitive intelligence & market intelligence teams of market participants (manufacturers, service providers, etc.).
- The rest of the revenue is generated working with academic and research not-for-profit institutes. We do our bit of pro-bono by working with these institutions at subsidized rates.
Horizon Databook provides a detailed overview of country-level data and insights on the U.S. Optical Interconnect Market Outlook, including forecasts for subscribers. This country databook contains high-level insights into U.S. Optical Interconnect Market Outlook from 2021 to 2033, including revenue numbers, major trends, and company profiles.
U.S. Optical Interconnect Market, 2021-2033 (US$M)

U.S. optical interconnect market statistics, by product, 2021-2033 (US$M)