- Home
- »
- Nutraceuticals & Functional Foods
- »
-
Resistant Starch Market Size, Share & Growth Report, 2030GVR Report cover
![Resistant Starch Market Size, Share & Trends Report]()
Resistant Starch Market Size, Share & Trends Analysis Report By Source (Vegetables, Grains, Cereal Food), By Product (RS1, RS2), By Application (Beverages, Confectionery, Dairy Products), By Region, And Segment Forecasts, 2023 - 2030
- Report ID: GVR-4-68040-038-7
- Number of Report Pages: 135
- Format: PDF, Horizon Databook
- Historical Range: 2017 - 2021
- Forecast Period: 2023 - 2030
- Industry: Consumer Goods
Report Overview
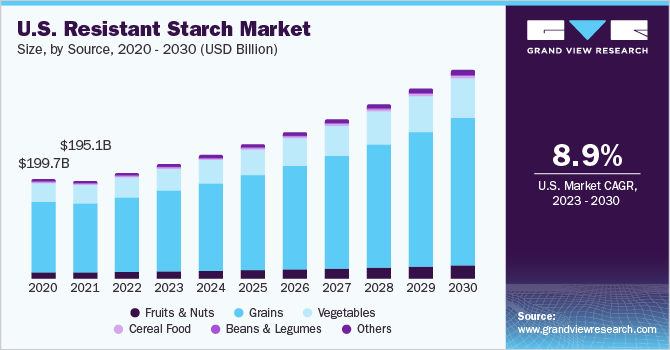
The global resistant starch market size was valued at USD 1,265.07 billion in 2022 and is estimated to expand at a compound annual growth rate (CAGR) of 8.9% from 2023 to 2030. The growing demand for convenience and packaged food products and growing health awareness among consumers are driving the demand for additives from plant sources such as resistant starch. The growing demand for thickening, emulsifying, and stabilizing agents in the processed and packaged food industry is driving the demand for resistant starches. The rising disposable income of the middle-class population in high-growth regions, such as Asia-Pacific, coupled with the growing economy is supporting the demand for convenience products.

The processed food industry, including processed meat, is one of the major end-users of resistant starch owing to its thickening and texturing properties. Rising consumer inclination towards ready-to-eat products owing to a busy lifestyle is expected to drive the resistant starch market during the forecast period. According to the USDA, the U.S., Japan, and the European Union countries are some of the key consumers of packaged food products, which will drive the demand for resistant starch during the forecast period. The demand for processed food products was observed to be high during the COVID-19 period due to a preference for a variety of easy-to-store products with a longer shelf life.
During the pandemic, consumer preference was toward convenience food products, such as pasta and noodles, which supported industry growth. According to Germany’s flour millers’ association, VGMS (Verband der Getreide-, Mühlen- und Stärkewirtschaft), the food supply and retail shelves were impacted due to consumers stocking food products during the pandemic. Producers worked overtime to cater to the peak demand for pasta and flour among consumers. According to the Italian Cereal Association (ANACER), the production of pasta was not affected in Italy. The food manufacturing industry in the country was working at full speed to ensure food supply within and outside the country. This peak demand from the application industries had a positive influence on the market.
Product Insights
The RS2 segment dominated the industry in 2022 and accounted for the maximum share of more than 38.85% of the overall revenue, and will expand further at a steady CAGR over the forecast period. The high crystallinity and high amylose content of RS2 derived from grain sources enables it to resist enzymatic hydrolysis, which is driving its growing usage in food products. Some of the key players offering high amylose-resistant starch include Ingredion. Ingredion provides “HI-Maize” resistant starch, which is derived from a variety of high-amylose corn. This resistant starch is neutral in taste and has a low water-holding capacity.
High amylose starches have gained popularity over recent years owing to the nature of the starch granule in RS2 types, which makes it naturally resistant. RS2 is manufactured from high-amylose variants of wheat and rice grains. Food manufacturers are inclined towards using RS2 in food products owing to its nutritional characteristics. RS2-resistant starches offer functionalities, such as the reduced risk of type 2 diabetes. The health benefits offered by RS2, such as the reduced risk of diabetes and positive effects on glycemic response, are projected to drive its demand for food products.
Application Insights
The soups, dressings, and condiments segment accounted for the highest share of more than 20.70% in 2022. The segment is projected to advance at a significant CAGR over the forecast period due to the increased consumption of soups and salads across the globe. Rising cases of obesity and chronic diseases have prompted a change in the dietary patterns of consumers, thus accelerating market growth. Meat substitutes are one of the fast-growing application segments in the global market. The segment is projected to expand at the fastest CAGR during the forecast period. The steady expansion of the plant-based industry and veganism is one of the key contributors to the global market.
Resistant starch is used as an additive in meat substitutes to control the texture, stability, and uniformity of the end product. As meat replacers are gaining wide popularity among consumers, manufacturers are focusing on the production of meat replacers with adequate texture, flavor, and color. This is driving the growth in the use of resistant starches in meat substitutes as functional ingredients. Some of the commercially available meat substitutes using starch are Like Schnitzel, Vivera Plant Steak, and Tofurky Chick’n. These products use corn, potato, and wheat starch to modify water-holding capacity and to improve the product’s functionality.
Source Insights
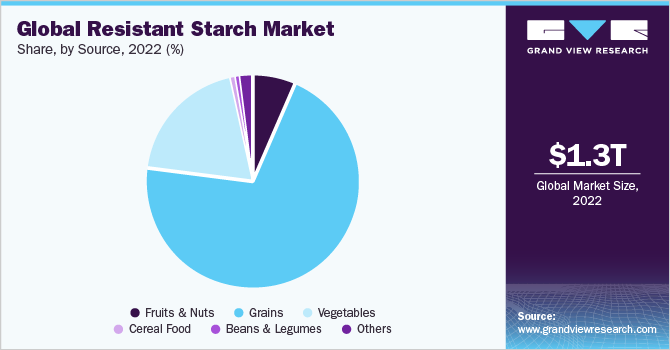
Corn, wheat, rice, potatoes, cereals, and beans are some of the important sources used to manufacture resistant starches. The preference for sources for starch production is mainly dependent on crop production in a specific region. For instance, corn starch is preferred in North America, while wheat starch is dominant in Europe and cassava is gaining popularity in Thailand due to the rising cassava production. The grains source segment dominated the industry in 2022 and accounted for the maximum share of more than 71.80% of the overall revenue. Whole grains include wheat, corn, rice, oats, barley, quinoa, sorghum, and rye.

The rising demand for functional ingredients is driving the demand for resistant starch derived from grains. According to the International Food Information Council (IFIC) Food & Health Survey conducted in 2020, 49% of consumers stated that “processed foods” affect their purchasing decision. In addition, rising consumer interest in specialty and ancient grains, such as buckwheat and quinoa, is also supporting the segment’s growth.
Regional Insights
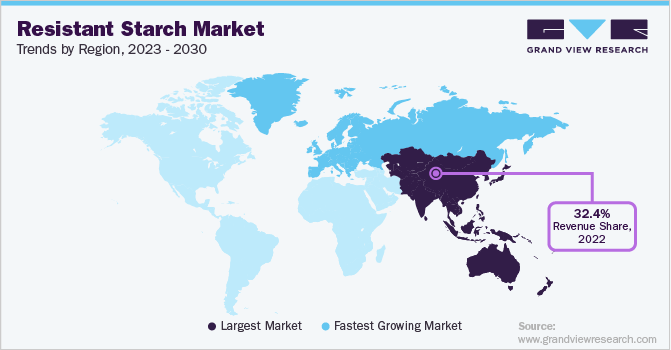
In terms of revenue, Asia Pacific dominated the industry in 2022 and accounted for the maximum share of more than 32.35% of the overall revenue. Asia Pacific is projected to record a steady growth rate over the forecast period. Countries, such as China and Japan, are projected to be the leading contributors to the growth of the APAC regional market owing to increasing product consumption in the packaged food industry. The growth in the processed food industry in the region is one of the factors driving the product demand in Asia Pacific. North America is one of the leading markets for resistant starch.

Pasta & noodles, bread & bakery products, and vegetables, such as potatoes, are some of the widely consumed key food sources of resistant starch in North America. According to the findings of a research paper, Resistant Starch Intakes in the United States, published on PubMed, the dietary intake of Americans aged 1 year and older included 4.9 grams of resistant starch per day. In this, the intake of resistant starch from foods, such as bread, pasta, cooked cereals, and vegetables (apart from legumes), accounted for 21%, 19%, and 19%, respectively. Thus, high starch intake makes it a lucrative market.
Key Companies & Market Share Insights
The industry is highly competitive, with the presence of many key players and innovators. The key players offer a wide range of product portfolios to consumers across the globe. The industry is witnessing a trend where many companies are introducing new products to meet consumer demand. This strategy is helping these companies increase their sales and gain a larger share of the market. Manufacturers are also focused on bringing new products to gain a competitive edge. For instance, in January 2021, Tate & Lyle expanded its product portfolio by launching BRIOGEL® gelling starches and REZISTA® MAX thickening starches that are tapioca-based. These starches have improved fluidity, tolerance, texture, and mouthfeel, which will help food manufacturers deliver high-quality products to their customers. Some of the key players in the global resistant starch market are listed below:
-
Tate & Lyle
-
Ingredion
-
Arcadia Biosciences
-
Emsland Group
-
MGP Ingredients
-
ADM
-
Cargill, Inc.
-
Roquette Freres
-
Lodaat Pharmaceuticals
-
MSP Starch Products
Resistant Starch Market Report Scope
Report Attribute
Details
Market size value in 2023
USD 1,370.28 billion
Revenue forecast in 2030
USD 2,511.07 billion
Growth rate
CAGR of 8.9% from 2023 to 2030
Base year for estimation
2022
Historical data
2017 - 2021
Forecast period
2023 - 2030
Quantitative units
Volume in metric tons, revenue in USD million/billion, and CAGR from 2023 to 2030
Report coverage
Volume & Revenue forecast, company ranking, competitive landscape, growth factors, and trends
Segments covered
Source, product, application, region
Regional scope
North America; Europe; Asia Pacific; Central & South America; Middle East & Africa
Country scope
U.S.; Canada; Mexico; U.K.; Germany; France; Italy; Spain; China; India; Japan; Australia & New Zealand; South Korea; Brazil; Argentina; UAE; South Africa
Key companies profiled
Cargill, Inc.; Emsland Group; MGP Ingredients; Tate & Lyle; Roquette Frères; Ingredion; Arcadia Biosciences; Lodaat Pharmaceuticals; Manitoba Starch Products; ADM
Customization scope
Free report customization (equivalent up to 8 analysts working days) with purchase. Addition or alteration to country, regional & segment scope. Pricing and purchase options
Avail customized purchase options to meet your exact research needs. Explore purchase options Global Resistant Starch Market Segmentation
This report forecasts revenue growth at global, regional, and country levels and provides an analysis of the latest industry trends in each of the sub-segments from 2017 to 2030. For the purpose of this study, Grand View Research has segmented the global resistant starch market report on the basis of source, product, application, and region:
-
Source Outlook (Volume, Metric Tons; Revenue, USD Billion, 2017 - 2030)
-
Fruits & Nuts
-
Banana
-
Cashew Nut
-
Others
-
-
Grains
-
Corn
-
Wheat
-
Rice
-
Others
-
-
Vegetables
-
Potato
-
Cassava
-
Others
-
-
Cereal Food
-
Beans & Legumes
-
Peas
-
Others
-
-
Others
-
-
Product Outlook (Volume, Metric Tons; Revenue, USD Billion, 2017 - 2030)
-
RS1
-
RS2
-
RS3
-
RS4
-
-
Application Outlook (Volume, Metric Tons; Revenue, USD Billion, 2017 - 2030)
-
Bakery Products
-
Bread
-
Biscuits & Cookies
-
Crackers
-
Other Bakery Products
-
-
Confectionery
-
Beverages
-
Breakfast Cereals
-
Pasta & Noodles
-
Dairy Products
-
Nutrition Bars
-
Meat & Processed Food
-
Meat Substitutes
-
Soups, Dressings, & Condiments
-
Others
-
-
Source-Application Outlook (Volume, Metric Tons; Revenue, USD Billion, 2017 - 2030)
-
Fruits & Nuts
-
Bakery Products
-
Bread
-
Biscuits & Cookies
-
Crackers
-
Other Bakery Products
-
-
Confectionery
-
Beverages
-
Breakfast Cereals
-
Pasta & Noodles
-
Dairy Products
-
Nutrition Bars
-
Meat & Processed Food
-
Meat Substitutes
-
Soups, Dressings, & Condiments
-
Others
-
-
Grains
-
Bakery Products
-
Bread
-
Biscuits & Cookies
-
Crackers
-
Other Bakery Products
-
-
Confectionery
-
Beverages
-
Breakfast Cereals
-
Pasta & Noodles
-
Dairy Products
-
Nutrition Bars
-
Meat & Processed Food
-
Meat Substitutes
-
Soups, Dressings, & Condiments
-
Others
-
-
Vegetables
-
Bakery Products
-
Bread
-
Biscuits & Cookies
-
Crackers
-
Other Bakery Products
-
-
Confectionery
-
Beverages
-
Breakfast Cereals
-
Pasta & Noodles
-
Dairy Products
-
Nutrition Bars
-
Meat & Processed Food
-
Meat Substitutes
-
Soups, Dressings, & Condiments
-
Others
-
-
Cereal Food
-
Bakery Products
-
Bread
-
Biscuits & Cookies
-
Crackers
-
Other Bakery Products
-
-
Confectionery
-
Beverages
-
Breakfast Cereals
-
Pasta & Noodles
-
Dairy Products
-
Nutrition Bars
-
Meat & Processed Food
-
Meat Substitutes
-
Soups, Dressings, & Condiments
-
Others
-
-
Beans & Legumes
-
Bakery Products
-
Bread
-
Biscuits & Cookies
-
Crackers
-
Other Bakery Products
-
-
Confectionery
-
Beverages
-
Breakfast Cereals
-
Pasta & Noodles
-
Dairy Products
-
Nutrition Bars
-
Meat & Processed Food
-
Meat Substitutes
-
Soups, Dressings, & Condiments
- Others
-
-
Others
-
Bakery Products
-
Bread
-
Biscuits & Cookies
-
Crackers
-
Other Bakery Products
-
-
Confectionery
-
Beverages
-
Breakfast Cereals
-
Pasta & Noodles
-
Dairy Products
-
Nutrition Bars
-
Meat & Processed Food
-
Meat Substitutes
-
Soups, Dressings, & Condiments
-
Others
-
-
-
Product-Application Outlook (Volume, Metric Tons; Revenue, USD Billion, 2017 - 2030)
-
RS1
-
Bakery Products
-
Bread
-
Biscuits & Cookies
-
Crackers
-
Other Bakery Products
-
-
Confectionery
-
Beverages
-
Breakfast Cereals
-
Pasta & Noodles
-
Dairy Products
-
Nutrition Bars
-
Meat & Processed Food
-
Meat Substitutes
-
Soups, Dressings, & Condiments
-
Others
-
-
RS2
-
Bakery Products
-
Bread
-
Biscuits & Cookies
-
Crackers
-
Other bakery products
-
-
Confectionery
-
Beverages
-
Breakfast Cereals
-
Pasta & Noodles
-
Dairy Products
-
Nutrition Bars
-
Meat & Processed Food
-
Meat Substitutes
-
Soups, Dressings, & Condiments
-
Others
-
-
RS3
-
Bakery Products
-
Bread
-
Biscuits & Cookies
-
Crackers
-
Other Bakery Products
-
-
Confectionery
-
Beverages
-
Breakfast Cereals
-
Pasta & Noodles
-
Dairy Products
-
Nutrition Bars
-
Meat & Processed Food
-
Meat Substitutes
-
Soups, Dressings, & Condiments
-
Others
-
-
RS4
-
Bakery Products
-
Bread
-
Biscuits & Cookies
-
Crackers
-
Other bakery products
-
-
Confectionery
-
Beverages
-
Breakfast Cereals
-
Pasta & Noodles
-
Dairy Products
-
Nutrition Bars
-
Meat & Processed Food
-
Meat Substitutes
-
Soups, Dressings, & Condiments
-
Others
-
-
-
Source-Product Outlook (Volume, Metric Tons; Revenue, USD Billion, 2017 - 2030)
-
Fruits & Nuts
-
RS1
-
RS2
-
RS3
-
RS4
-
-
Grains
-
RS1
-
RS2
-
RS3
-
RS4
-
-
Vegetables
-
RS1
-
RS2
-
RS3
-
RS4
-
-
Cereal Food
-
RS1
-
RS2
-
RS3
-
RS4
-
-
Beans & Legumes
-
RS1
-
RS2
-
RS3
-
RS4
-
-
Others
-
RS1
-
RS2
-
RS3
-
RS4
-
-
-
Regional Outlook (Volume, Metric Tons; Revenue, USD Billion, 2017 - 2030)
-
North America
-
U.S.
-
Canada
-
Mexico
-
-
Europe
-
U.K.
-
Germany
-
France
-
Spain
-
Italy
-
- Asia Pacific
-
China
-
India
-
Japan
-
Australia & New Zealand
-
South Korea
-
-
Central & South America
-
Brazil
-
Argentina
-
-
Middle East & Africa
-
UAE
-
South Africa
-
-
Frequently Asked Questions About This Report
b. The global resistant starch market size was estimated at USD 1,265.7 billion in 2022 and is expected to reach USD 2,511.1 billion in 2030.
b. The resistant starch market is expected to grow at a compound annual growth rate of 8.9% between 2023 to 2030 to reach USD 2,511.07 billion by 2030.
b. Asia Pacific region dominated the resistant starch market with a revenue share of 32.40% in the year 2022 owing to growing processed food and convenience food demand in countries like China and Japan.
b. Some of the key market players in the resistant starch market are Cargill, Incorporated, Emsland Group, MGP Ingredients, Tate & Lyle, Ingredion, and ADM.
b. Key factors that are driving the resistant starch market growth include a health benefits offered by resistant starches and the increased demand for packaged food products, especially, with rising middle class disposable income.
Share this report with your colleague or friend.
![gvr icn]()
NEED A CUSTOM REPORT?
We can customize every report - free of charge - including purchasing stand-alone sections or country-level reports, as well as offer affordable discounts for start-ups & universities. Contact us now
![Certified Icon]()
We are GDPR and CCPA compliant! Your transaction & personal information is safe and secure. For more details, please read our privacy policy.
We are committed towards customer satisfaction, and quality service.
"The quality of research they have done for us has been excellent."


