Research Methodology
Our research methodology entails an ideal mixture of primary and secondary initiatives. Key steps involved in the process are listed below:
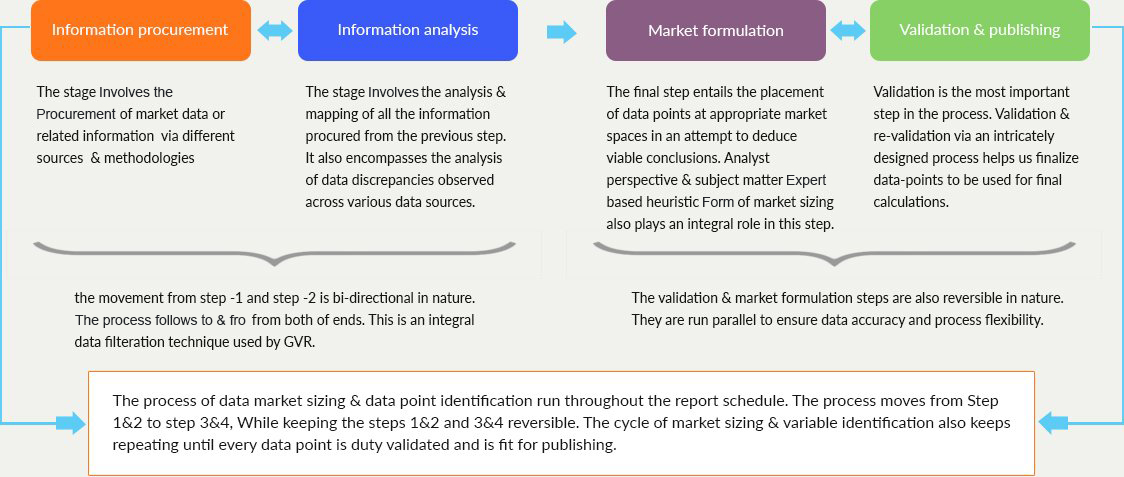
- 1. Information Procurement
- 2. Information Analysis
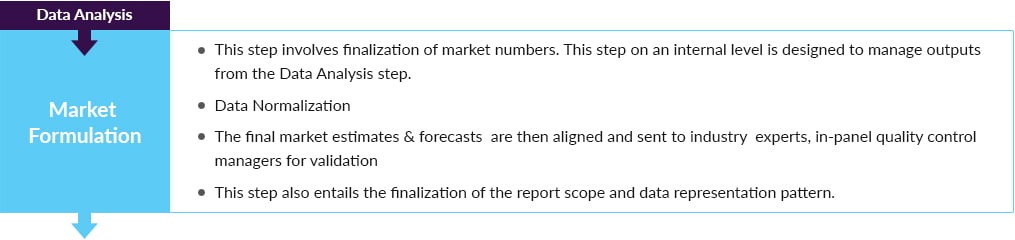
- 3. Market Formulation
- 4. Validation & Publishing
The stage involves the procurement of market data or related information via different sources & methodologies.
This step involves the analysis & mapping of all the information procured from the previous step. It also encompasses the analysis of data discrepancies observed across various data sources.
The final step entails the placement of data points at appropriate market spaces in an attempt to deduce viable conclusions. Analyst perspective & subject matter expert based heuristic form of market sizing also plays an integral role in this step.
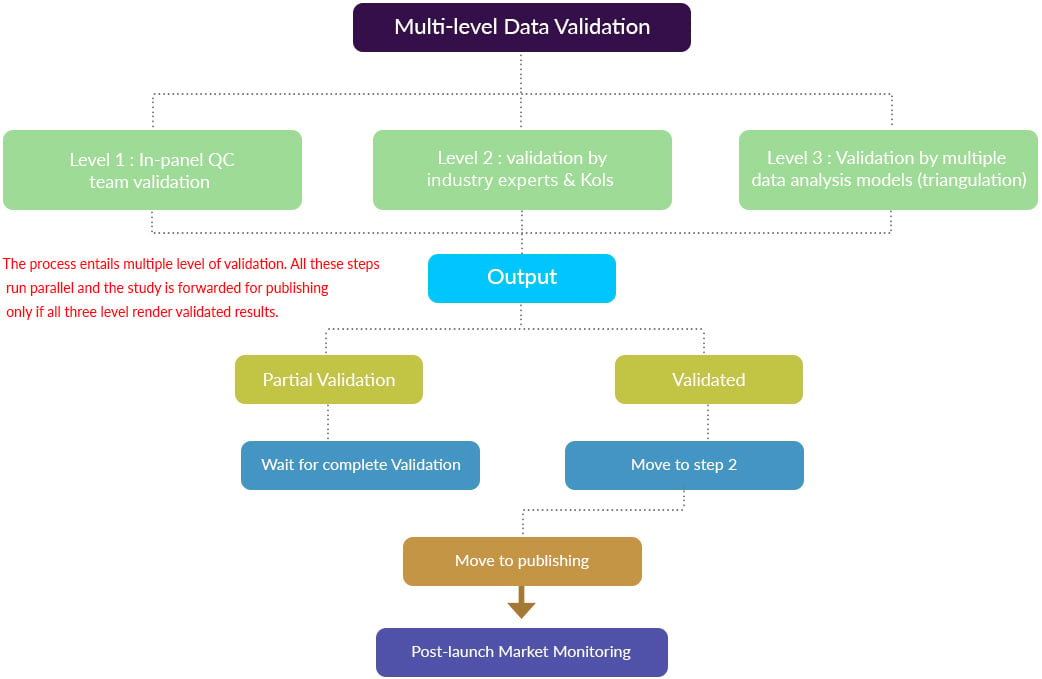
Validation is the most important step in the process. Validation & re-validation via an intricately designed process helps us finalize data-points to be used for final calculations.
Market Research Process
Information Procurement
The stage involves the procurement of market data or related information via different sources & methodologies.
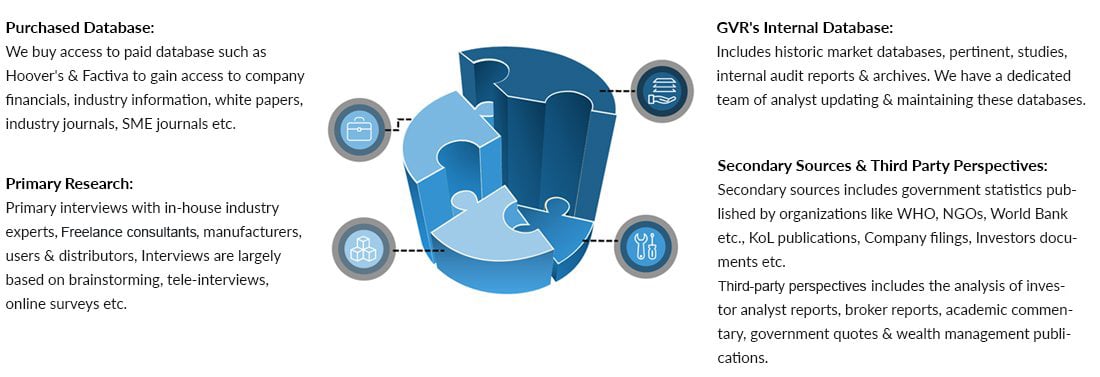
Information procurement is one of the most extensive stages in our research process. As illustrated in the figure above, the techniques can be broadly categorized into five sections, as stated below:
Purchased Database:
- Includes company databases such as Hoover's: This helps us identify financial information, industry competitive landscape, structure of the market participants. Also, it serves as an important step in market sizing, especially, in case of commodity-flow techniques.
- Industry databases such as Factiva, help us gain access to industry statistics, and KoL opinions & formulate conclusions.
- Other sources include SME journals, pertinent databases from third-party vendors to gain insights into:
- 1. Usage rates
- 2. Procedure statistics
- 3. Potential market related statistics
- 4. Information on unmet needs
- 5. Regional expenditure pattern
- 6. Investment information or opportunity based statistics
GVR's Internal Database
- Includes our internal database of data points, collected as a result of previous research & studies and information made available via our database management team
- Also includes internal audit reports & archives
- 1. Usage rates
- 2. Procedure statistics
- 3. Potential market related statistics
- 4. Information on unmet needs
- 5. Regional expenditure pattern
- 6. Investment information or opportunity based statistics
Secondary Sources
- A list of secondary sources along with the information extracted from them will be available in the final deliverable
- Notable examples include white papers, government statistics published by organizations like WHO, NGOs, World Bank etc., KoL publications, company filings, investor documents etc.
Third Party Perspective
- This section includes market derivation through investor analyst reports, broker reports, academic commentary, government quotes & wealth management publications.
Primary Research:
suppliers & manufactures
Interview Scope
Research tool : Questionnaire based research & telephonic discussions
Database: Paid vendors, Hoovers, LinkedIn, Factiva, Sources extracted from pertinent studies
Regional scope: All countries within the scope off the studies. Interview of Kols from non-English speaking countries are conducted via our vendors and questionnaire
Information or Data Analysis
Information procured from secondary and primary initiatives are then analyzed using the following tools/models: (a partial list)
- Identifying variables and establishing market impact
- Establishing market trends
- Analyzing future opportunities and market penetration rates by understanding product commercialization, regional expansion etc.
- Analyzing reimbursement/regulatory trends and changes in market dynamics to establish future growth
- Analyzing sustainability strategies adhered by market participants in an attempt to determine future course of the market
- Analyzing historical market trends and super-imposing them on the current and future variables to determine year-on-year trends
- Understanding consumer base, procedure trends and regulatory framework
- Keeping a track of technological advancements in individual segments
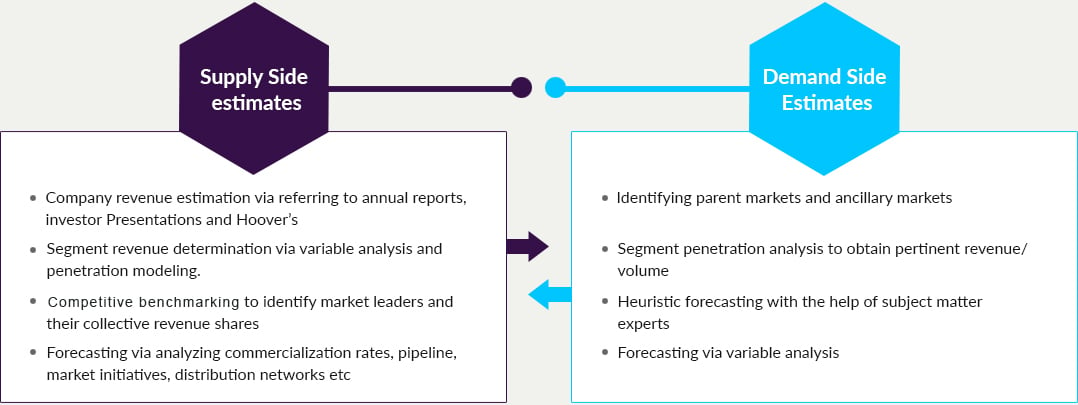
- Base numbers are established by analyzing the following:
- 1. Company revenues and market share (this list generally includes the analysis of revenue published by publicly listed manufacturers)
- 2. Derivation of market estimates via analyzing parent and ancillary markets
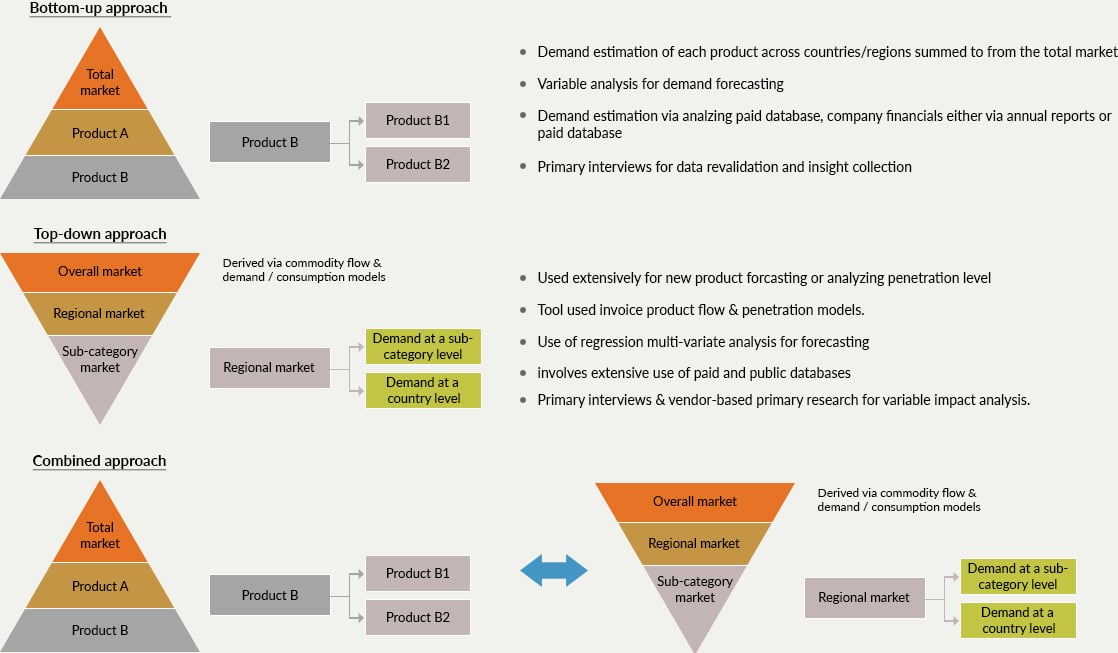
The following techniques outline our research methodology:
- Model selection: demand based bottom up approach, usage rates based approach and mixed approach (top down and bottom up)
Market research approaches
Value chain based sizing & forecasting
- Penetration modeling for products
- 1. Determining and forecasting penetration via analyzing product features, proposed pricing, availability of internal and external substitutes etc.
- 2. Heuristic estimation of year-on-year sales by conducting primary interviews with:
- - Healthcare practitioners
- - Industry experts & KoLs
- - Distributors
- 3. Product sizing and forecasting by following a diffusion model based on S-curve growth
- Analysis of current usage rates and patterns to determine substitution rates
- Regression and variable analysis
- 1. Identifying variables and assigning impact to determine growth)
- 2. QFD modeling for market share assessment (an example cited in the figure below)
- 3. Referring to historic data to establish base estimates
- 4. Using exponential smoothing for forecasting
- User size based penetration
- 1. Analyzing current needs and determining penetration to estimate market size or sales
- 2. Using unmet needs and capitalization rates to determine growth
- Trend analysis (based on year trending models)
QFD Modeling for Market Share Assessment
| Scores derived via QFD | Price | Efficacy rates | Current penetration | Future prospects | Consumer preference index |
|---|---|---|---|---|---|
| Product A | 10 | 9 | 7 | 9 | 6 |
| Product B | 8 | 9 | 4 | 6 | 5 |
| Product C | 10 | 7 | 1 | 7 | 9 |
| Product D | 4 | 8 | 10 | 9 | 4 |
| Product E | 8 | 6 | 6 | 3 | 1 |
| Weightage in terms of % | |
|---|---|
| Price | 25% |
| Efficacy rates | 25% |
| Current penetration | 25% |
| Future prospects | 10% |
| Consumer preference index | 15% |
| 100% | |
| Market shares as calculated for initial research purposes | ||
|---|---|---|
| Average score | Relative market size | |
| Product A | 8.3 | 24.84% |
| Product B | 6.6 | 19.47% |
| Product C | 6.6 | 19.32% |
| Product D | 7.0 | 20.65% |
| Product E | 5.5 | 16.08% |
| 33.9% | ||
NOTE: THE ABOVE ILLUSTRATED FIGURE IS FOR REPRESENTATION PURPOSES ONLY, ATTRIBUTE SELECTION AND SCORE RENDERING IS AN EXTENSIVE PROCESS INVOLVING RIGOROUS PRIMARY AND SECONDARY RESEARCH.
Market Formulation & Validation