- Home
- »
- Reports
- »
-
Nitrogen Procurement & Supplier Intelligence Report, 2030
![Nitrogen Procurement & Supplier Intelligence Report, 2030]()
Nitrogen Procurement Intelligence Report, 2024 - 2030 (Revenue Forecast, Supplier Ranking & Matrix, Emerging Technologies, Pricing Models, Cost Structure, Engagement & Operating Model, Competitive Landscape)
- Published Date: Feb, 2024
- Base Year for Estimate: 2023
- Report ID: GVR-P-10578
- Format: Electronic (PDF)
- Historical Data: 2021 - 2022
- Number of Pages: 60
Nitrogen Category Overview
“Increasing requirement for nitrogen in industrial operations across range of industries is fueling the growth of the category.”
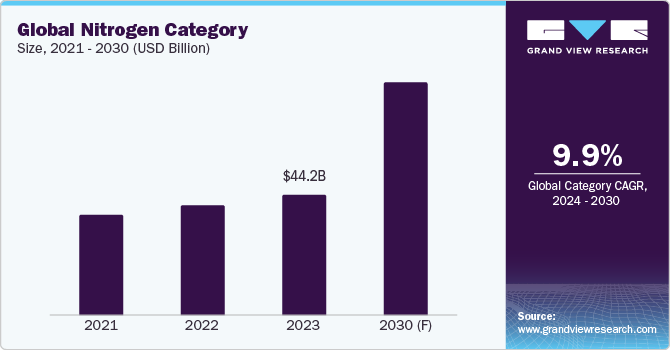
The global nitrogen category is anticipated to grow at a CAGR of 9.9% from 2024 to 2030. Key factors that influence the category’s growth include increasing requirement for nitrogen in industrial operations across a range of industries, such as food & beverage, chemicals, and oil & gas, and the rise in industrial development and industrialization activities. The chemical sector offers a lucrative commercial opportunity for the category whereby nitrogen gas acts as a vital safety measure by preventing fires and explosions. In addition, the gas is also forced into the tank head area at chemical processing and storage plants in order to completely remove any possibility of product contamination or deterioration. However, since the production of the gas/liquid offered in the category requires a process, which is energy-intensive, it incurs a high cost. In addition, there may be extra expenses involved in getting the product to isolated areas/locations with inadequate infrastructure. This may restrict the growth of the global category over the projected timeframe.
The food and beverage sector, which holds approximately 50% of the revenue share, witnessed a high utilization of nitrogen. Nitrogen gas is extensively used for food packaging. It offers prolonged shelf life to food items by eliminating oxygen contact, thus, preventing oxidation. This helps to keep the food fresh for a longer period, by preventing it from spoiling. As per a recent report, the sector is anticipated to witness a CAGR of over 8.3%, which will fuel the growth of the global category. In addition, there are several applications of liquid nitrogen in the metalworking, automotive, food processing, chemicals, electronics, healthcare, oil & gas, and, agriculture sectors. In the coming years, the category is expected to grow rapidly as industrial gas units adopt the economic pressure swing adsorption technology to produce nitrogen gas. The future growth of the category is anticipated to be aided by the expanding population and increasing need for agricultural production.
The global nitrogen category was valued at USD 44.2 billion in 2023. The compressed gas segment, which accounted for 54.3% of the revenue share, led the product type category. Compressed nitrogen gas serves as the primary component of an industrial gas system. One process that is frequently used in the production of high-purity industrial gates is cryogenic fraction distillation. Compressed nitrogen gas is expected to become more in demand during the study period since it is used in cylinder systems for membrane separation, pressure swing adsorption, and cryogenic fractional distillation. Based on application, the industrial nitrogen sector is anticipated to hold the biggest market share in the upcoming years. It has a strong hold on the market and will see steady revenue growth. Since it is less expensive because of technological advancements, it is becoming a viable option for utilization in various sectors.
Technological solutions that are supplementing the growth of the global category include pressure swing adsorption (PSA), cryogenic fractional distillation, membrane separation, artificial intelligence (AI), and internet of things (IoT). Adsorption is the basis for PSA systems' operation. The components of these systems are adsorption tanks filled with carbon molecular sieves (CMS), which have the ability to absorb both carbon dioxide and any remaining moisture. Nitrogen can flow through at the appropriate purity level since CMS preferentially adsorbs oxygen at high pressures. Compared to conventional cryogenic distillation or liquid nitrogen storage, on-site nitrogen generation via PSA devices is more economical. Nitrogen with high purity is obtained using a cryogenic fractional distillation process. This method of extracting nitrogen from the air is among the most intricate ones and entails drawing ambient air into the distillation apparatus using a compression device.
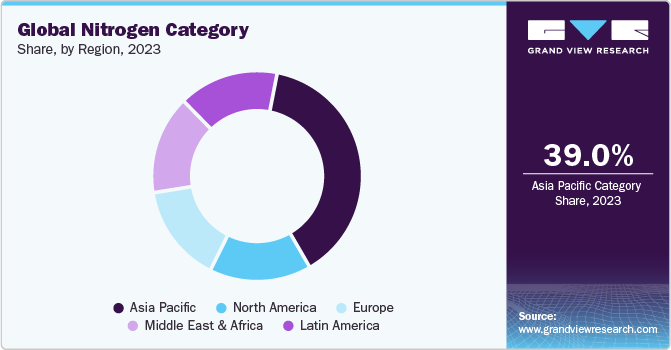
Asia Pacific dominates the global category, accounting for a substantial market share. This region’s growth can be attributed to swift urbanization and industrialization, which is fuelling the category's exponential expansion. Nations such as South Korea, India, Japan, and China areobserving a notable demand for the products on offer in various sectors, such as healthcare, chemicals, metallurgy, and electronics. In the upcoming years, the need for industrial nitrogen is expected to increase due to the developments in this region's healthcare system. In addition, the growing use of fertilizers based on ammonia in agricultural nations to boost soil fertility is anticipated to propel the market expansion. The established economies such as North America and Europe are anticipated to witness a maturation of demand for the products offered in the category.
Supplier Intelligence
“What best describes the nature of the Nitrogen category? Who are some of the main participants?”
The global nitrogen category exhibits a moderately fragmented landscape, with the presence of a large number of global and regional market players in intense competition.The key players are concentrating on research and development (R&D) initiatives in order to improve the effectiveness and performance of the product offered in the category. They are undertaking strategic tactics such as mergers & acquisitions, partnerships, and strategic alliances as a means of increasing their market share. For instance, in 2022, Linde plc (one of the key market participants), prioritizes strategic alliances and partnerships, especially for long-term supply agreements. The company got inked into a long-term contract with a Florida-based space launch firm for the provision of bulk industrial gases.
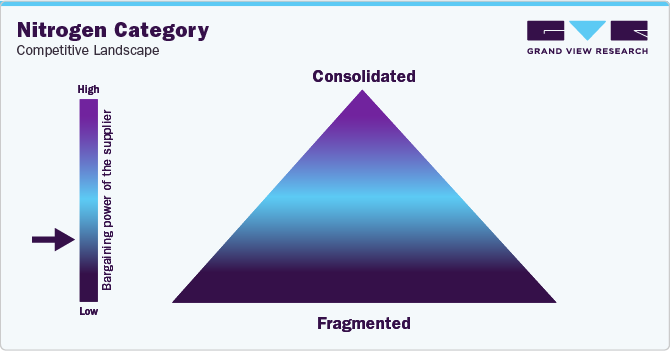
Buyers possess moderate negotiating power due to the nature of the category, wherein they have the ability to look for a better alternative to supply the products offered in the category if they are not satisfied with functional factors such as lead time, product quality, pricing, support, and technologies. The threat of new entrants in the category is low, subject to factors such as high capital requirement, existing competition, regulatory compliance, and technological expertise. Establishing and running production and distribution facilities in the industry necessitates large capital expenditures. In addition, the industry witnesses the existence of giants, whichwould be a significant obstacle for new competitors. Furthermore, the safety and environmental regulations governing the industry are very strict, and adherence to them can be challenging, especially for newcomers.
Key suppliers covered in the category:
-
ADNOC Gas
-
Air Products and Chemicals, Inc.
-
BOC Limited
-
Gulf Cryo
-
L’Air Liquide S.A.
-
Linde plc
-
Messer SE & Co. KGaA
-
nexAir, LLC
-
Praxair, Inc.
-
Southern Industrial Gas Sdn Bhd
-
Taiyo Nippon Sanso Corporation
-
Universal Industrial Gases, Inc.
-
Yingde Gases Group Company Limited
Pricing and Cost Intelligence
“What is the cost structure for Nitrogen category? What variables affect the prices?”
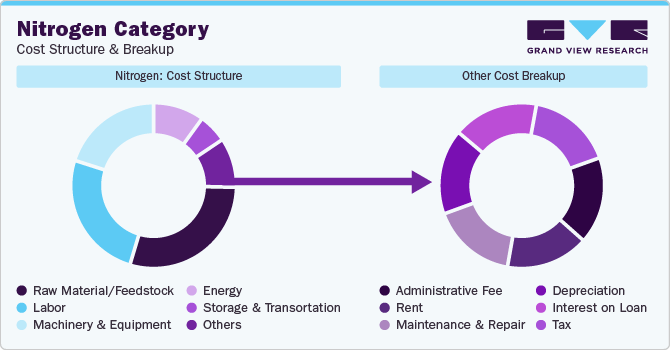
Raw material / feedstock, labor, machinery & equipment, energy, storage & transportation, and others constitute the cost structure of the global nitrogen category.Other costs include administrative fees, rent, maintenance & repair, depreciation, interest on loan, and tax. The raw material/feedstock constitutes the largest share of expense in the category. Key factors that influence the cost of the products offered in the category include energy prices, transportation expenses, purity, technology utilized, and location.
The primary energy source for air separation and the factor that determines the cost of producing nitrogen is electricity. Since smaller units require more specialized electricity to operate, large-scale production has an advantage over smaller units. In addition, fuel price fluctuations directly affect the total logistical expenses associated with bulk liquid trucks or cylinder transportation. Businesses are creating filling stations and streamlining their routes to cut down on the expense of transporting gasses over large distances.
Depending on whether it is made on-site or purchased from a source (supplied in bulk), the price of liquid nitrogen in the U.S. varies significantly. Liquid nitrogen can be produced on-site. A business enterprise needs to factor in the upkeep, generator prices (original investment) distributed throughout its useful life, and the cost of running the generator (which is mostly power consumption) when determining how much it will cost to produce liquid nitrogen on-site.Producing on-site costs as little as USD 0.12 per liter (inclusive of all the above-mentioned factors), making it a very cost-effective process.
Depending on the location, LN2 prices range between USD 0.49 per liter to USD 1.77 per liter when bought in bulk from a source. Over the past ten years, bulk nitrogen delivery has become less and less popular due to price volatility and several delivery-related hazards. Throughout the last five years, prices have risen twice a year. Although the cost of production for suppliers is less than USD 0.0015 per liter, the selling price per liter is 40 times the cost of production. Majority of vendors simply cover the cost of LN2 per container before delivery, however, the costs for delivery, storage, or other charges stay hidden.
The cost structure is broken down in the accompanying chart. Other costs can depend on multiple cost components, which have been illustrated below:
The report provides a detailed analysis of the cost structure and the pricing models adopted by prominent suppliers in this category.
Sourcing Intelligence
“How do buyers of Nitrogen engage? What is the type of engagement model?”
In terms of global nitrogen category sourcing intelligence, buyers in the industry follow a hybrid outsourcing model to engage with their suppliers. Currently, the industry is working on a hybrid approach wherein the majority of the buyers are dependent on suppliers of bottled nitrogen to fulfill their requirements and there are few who are investing in buying a generator for themselves to have the vantage of producing their own nitrogen on the site, as per their requirements. However, the future of the category seems to be shifting to an in-house model wherein the buyers would want to be less dependent on bottled solutions and have the ability to produce in-house.
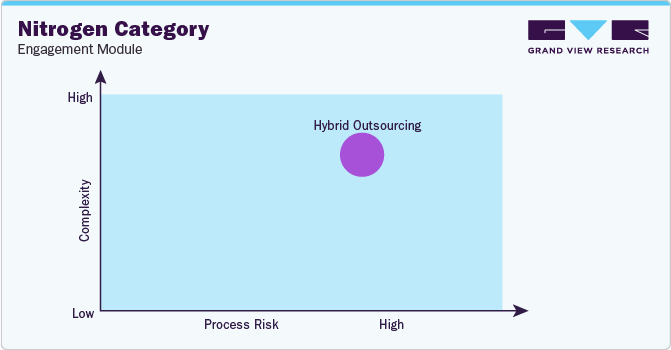
“In the hybrid outsourcing model, the client outsources some parts of the overall operation to third parties. Generally, the client carries out critical operations in-house.”
The most conventional way for processing and manufacturing facilities to obtain the product has been in the form of liquid or bulk gas. They have been utilizing traditional bulk gas suppliers for a long time and have become accustomed to the restrictions and challenges associated with this mode of delivery. In addition, they are also accustomed to ordering, arranging & receiving deliveries, hoarding for times of high demand, and, of course, handling sporadic supply problems that jeopardize plant productivity. To overcome such challenges, many businesses are opting for the installation of generators on-site rather than searching for suppliers of bottled solutions.
On-site generation technology assists companies in cutting costs, shortening operational delays, and providing better, more reliable goods and services to their clients. In addition, the generators support manufacturing establishments by offering complete regulation of their nitrogen process gas supply. Business enterprises who are part of sectors such as food product manufacturing, and chemical processing heavily rely on generators to meet their daily goals and provide excellent customer service. These companies are able to save a significant amount of money by utilizing generators as it is environment friendly, boosts worker safety, improves efficiency, and is cost-effective.
Belgium is the preferred low-cost/best-cost country for sourcing nitrogen. In Q4 2023, Belgium's nitrogen imports and exports totaled up to €220k and €2.08M, respectively. This led to a positive trade balance of €1.85 million. The imports of Nitrogen in the nation fell by €-1.09M (-83.1%) from €1.31M to €220k, and exports of the nation fell by €-2.63M (-55.9%) from €4.71M to €2.08M, between Q4 2022 and Q4 2023. The decline in nitrogen imports from the Netherlands (€-469k or -74.4%), France (€-41.7k or -90.6%), and Switzerland (€-2.58k or -80.7%) were the main factor contributing to the year-over-year decline in nitrogen imports. The decline in shipments to Luxembourg (€-41.3k or -53.8%), the United Kingdom (€-3.18k or -22.4%), and Senegal (€-127 or -31.2%) was the main factor contributing to the year-over-year decline in nation's exports.
The report also provides details regarding day one, quick wins, portfolio analysis, key negotiation strategies of key suppliers, and low-cost/best-cost sourcing analysis.
Nitrogen Category Procurement Intelligence Report Scope
Report Attribute
Details
Nitrogen Category Growth Rate
CAGR of 9.9% from 2024 to 2030
Base Year for Estimation
2023
Pricing Growth Outlook
5% - 10% increase (Annually)
Pricing Models
Cost-plus pricing, fixed pricing
Supplier Selection Scope
Cost and pricing, past engagements, productivity, geographical presence
Supplier Selection Criteria
Geographical service provision, industries served, years in service, employee strength, revenue generated, certifications, form of delivery (compressed gas / liquid), product concentration & purity, technology deployed for production, on-site generation, regulatory compliance in storage & transportation, lead time, and others
Report Coverage
Revenue forecast, supplier ranking, supplier matrix, emerging technology, pricing models, cost structure, competitive landscape, growth factors, trends, engagement, and operating model
Key Companies Profiled
ADNOC Gas; Air Products and Chemicals, Inc.; BOC Limited; Gulf Cryo; L’Air Liquide S.A.; Linde plc; Messer SE & Co. KGaA; nexAir, LLC; Praxair, Inc.; Southern Industrial Gas Sdn Bhd; Taiyo Nippon Sanso Corporation; Universal Industrial Gases, Inc.; and Yingde Gases Group Company Limited
Regional Scope
Global
Revenue Forecast in 2030
USD 85.6 billion
Historical Data
2021 - 2022
Quantitative Units
Revenue in USD billion and CAGR from 2024 to 2030
Customization Scope
Up to 48 hours of customization free with every report.
Pricing and Purchase Options
Avail customized purchase options to meet your exact research needs. Explore purchase options
Frequently Asked Questions About This Report
b. The global nitrogen category size was valued at approximately USD 44.2 billion in 2023 and is estimated to witness a CAGR of 9.9% from 2024 to 2030.
b. Increasing requirement for nitrogen in industrial operations across range of industries, such as food & beverage, chemicals, and oil & gas, and rise in industrial development and industrialization activities are driving the growth of the category.
b. According to the LCC/BCC sourcing analysis, Belgium and China are the ideal destinations for sourcing nitrogen.
b. This category exhibits a moderately fragmented landscape with intense competition. Some of the key players are ADNOC Gas, Air Products and Chemicals, Inc., BOC Limited, Gulf Cryo, L’Air Liquide S.A., Linde plc, Messer SE & Co. KGaA, nexAir, LLC, Praxair, Inc., Southern Industrial Gas Sdn Bhd, Taiyo Nippon Sanso Corporation, Universal Industrial Gases, Inc., and Yingde Gases Group Company Limited
b. Raw material / feedstock, labor, machinery & equipment, energy, storage & transportation, and others are the major cost components of this category. Other costs can be further bifurcated into administrative fee, rent, maintenance & repair, depreciation, interest on loan, and tax.
b. Reviewing the geographical coverage capability of the supplier, assessing if a supplier can offer the product with in the required purity levels, checking if the supplier’s lead time can timely meet the product needs, and comparing the prices offered by different suppliers are some of the best sourcing practices considered in this category.
Share this report with your colleague or friend.
GET A FREE SAMPLE
This FREE sample includes market data points, ranging from trend analyses to market estimates & forecasts. See for yourself...
Add-on Services
Should Cost Analysis
Component wise cost break down for better negotiation for the client, highlights the key cost drivers in the market with future price fluctuation for different materials (e.g.: steel, aluminum, etc.) used in the production process
Rate Benchmarking
Offering cost transparency for different products / services procured by the client. A typical report involves 2-3 case scenarios helping clients to select the best suited engagement with the supplier
Salary Benchmarking
Determining and forecasting salaries for specific skill set labor to make decision on outsourcing vs in-house.
Supplier Newsletter
A typical newsletter study by capturing latest information for specific suppliers related to: M&As, technological innovations, expansion, litigations, bankruptcy etc.
![gvr icn]()
NEED A CUSTOM REPORT?
We can customize every report - free of charge - including purchasing stand-alone sections or country-level reports, as well as offer affordable discounts for start-ups & universities.
Contact us now to get our best pricing.
![esomar icon]()
ESOMAR certified & member
![ISO]()
ISO Certified
We are GDPR and CCPA compliant! Your transaction & personal information is safe and secure. For more details, please read our privacy policy.
We are committed towards customer satisfaction, and quality service.
Client Testimonials

"The quality of research they have done for us has been excellent..."
ISO Certified


