- Home
- »
- Reports
- »
-
Office Furniture Supplier & Sourcing Intelligence Report, 2030
![Office Furniture Supplier & Sourcing Intelligence Report, 2030]()
Office Furniture Procurement Intelligence Report, 2024 - 2030 (Revenue Forecast, Supplier Ranking & Matrix, Emerging Technologies, Pricing Models, Cost Structure, Engagement & Operating Model, Competitive Landscape)
- Published Date: Apr, 2024
- Base Year for Estimate: 2023
- Report ID: GVR-P-10586
- Format: Electronic (PDF)
- Historical Data: 2021 - 2022
- Number of Pages: 60
Office Furniture - Procurement Trends
“Rise in the number of office spaces and growing need for space optimization is fueling the industry’s growth.”
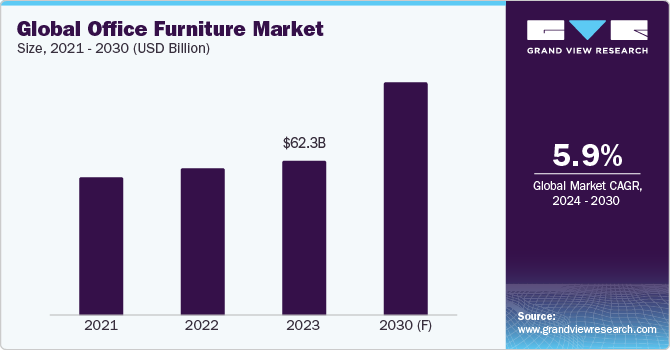
Office furniture procurement plays a significant role in creating a comfortable, productive, and efficient work environment for employees. Investing in ergonomic and well-designed furniture can boost employee morale, reduce health issues, and contribute to the company’s overall success. The global market is anticipated to grow at a CAGR of 5.9% from 2024 to 2030. The growth can be attributed to factors such as a rise in the number of commercial spaces and zones, increasing demand for personalized products, technological advancements, the surge in demand from the Information and Communications Technology (ICT) sector, and the growing need for space optimization. A few of the key challenges faced by this industry are raw material shortages and price fluctuations, logistics and supply chain disturbances, and an increase in rentals of such products.
In the current landscape for this industry, there is a strong demand for products using eco-friendly and recyclable materials. Moreover, there is an increased requirement for customized products, due to users preferring personalization features such as tailored colors, handmade graphics, and adjustable sizes in chairs and desks. Additionally, suppliers are focusing on ergonomics to improve posture and increase comfort for users. Corporate offices increasingly prefer customized branding for their furniture items, to create a unique corporate identity and foster a positive work environment.
In terms of end-use, products in this industry are utilized by various end-users such as commercial offices, educational institutes, healthcare facilities, hospitality, and retail spaces. For instance, commercial offices utilize furniture for employee workstations, meeting areas, and storage purposes. In the hospitality sector, these items are commonly deployed by hotels in reception areas, lobbies, and business centers. In healthcare facilities, these products are positioned in physicians’ private waiting areas.
The global office furniture market size was estimated at USD 62.3 billion in 2023. The demand for this industry fluctuated during the COVID-19 pandemic, as corporates implemented a work-from-home model, stopping them from ordering new products. At the same time, the need for home office products grew as employees increasingly scouted for suitable workstations at their homes. Demand from educational institutes also plummeted due to shutting down of these institutes during lockdowns. Since 2023, the overall demand for the industry has improved significantly and is anticipated to rise further during the next few years. Post the pandemic, key suppliers are increasingly leveraging novel e-commerce channels and specialty stores to sell products, as customer buying has seen an upward trend from such platforms.
Key technologies that are driving the market’s growth include smart chairs, collaborative tables, modular workstations, smart standing desks, and polyester hybrid powder coatings. Smart chairs are equipped with sensors and connectivity features to enhance the overall user experience. They are capable of monitoring the movement and posture of users and can provide reminders and feedback on aspects such as ergonomics and users’ health and well-being. Moreover, these chairs have adjustable settings to provide personalized comfort and support and can adapt to users’ preferences and needs. Collaborative tables are designed to facilitate teamwork and interaction in office environments. These tables facilitate spacious surfaces, have configurable layouts, and contain integrated connectivity options, which enable several users to gather, share ideas, and collaborate effectively. Moreover, these tables are equipped with embedded power outlets, USB ports, and cable management systems to support various devices during meetings and discussions.
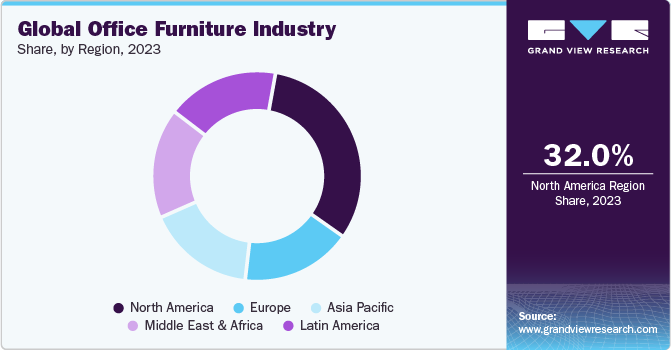
North America dominated the industry,accounting for 32% of the global market share in 2023. This growth can be attributed to a high demand for tailored items, an increased need for comfortable and flexible designs, a growing emphasis on office aesthetics, and rising usage of sustainable products. Asia Pacific is expected to grow at the fastest pace during the projected period. Key drivers for this growth include the rapid growth of commercial establishments, surge in demand from emerging countries such as India and China, growing presence of key players, technological advancements, and improvement in working conditions.
Supplier Intelligence
"What are the characteristics of the office furniture industry? Who are the key players involved?"
The office furniture industry is characterized by fragmentation and intensified competition among key suppliers. Therefore, key suppliers are highlighting product quality, improving their range of smart furniture and green products, providing cost-effective items, promoting sustainability initiatives, enhancing after-sales support, and offering ancillary services. Moreover, key suppliers are competing based on pricing strategies, top-line growth, personalization features, adherence to regulatory standards, and lead time reduction. Additionally, vendors are increasingly focusing on consolidating supply chains in response to recent events such as geopolitical conflicts and the COVID-19 pandemic.
Currently, key players are actively expanding their geographical presence, fostering partnerships and alliances, investing in novel online platforms, and diversifying product offerings to reinforce their market position and adapt to the changing needs of buyers. Within the demand landscape of this industry, buyers are increasingly embracing e-commerce platforms for sourcing office furniture, which is steering suppliers to offer detailed online product catalogues and enabling online deployment of processes such as invoice systems and purchase orders. Moreover, buyers have a wide assortment of choices concerning product variety, are able to deploy a flexible budget, can leverage the benefit of ancillary services, and have access to effective post-purchase assistance. Buyers may use such parameters for supplier comparison, supplier selection, and as levers for negotiation.
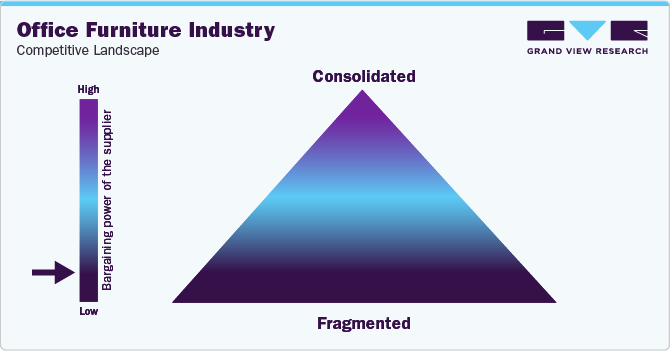
The profit margins available to suppliers in this market are typically low, in the range of 6% - 12%, depending on the type of products, cost of sales, geographic location, logistical expenses, and taxes. Buyers hold high bargaining power due to the vigorous market competition, thus facilitating buyers to easily switch to better alternatives. Moreover, buyers can be quite selective as they aim to purchase products of optimal quality at feasible rates. This increases pressure on suppliers in terms of pricing and quality standards. Besides, regulatory laws in several regions require suppliers to comply with rigorous standards related to product safety, durability, performance, material recycling, and environmental influence. Key metrics to evaluate the performance of office furniture vendors include average order value, conversion rate, number of repeat customers, return rate, on-time delivery rate, gross margin percentage, and customer reviews.
Key suppliers covered in the industry:
-
Global Furniture Group
-
Haworth Inc.
-
Herman Miller, Inc.
-
HNI Corporation
-
Humanscale Corporation
-
Kinnarps AB
-
Krueger International, Inc.
-
Okamura Corporation
-
Steelcase Inc.
-
Vitra International AG
Pricing and Cost Intelligence
“What are the main components of the cost structure for office furniture? What are the factors impacting the prices?"
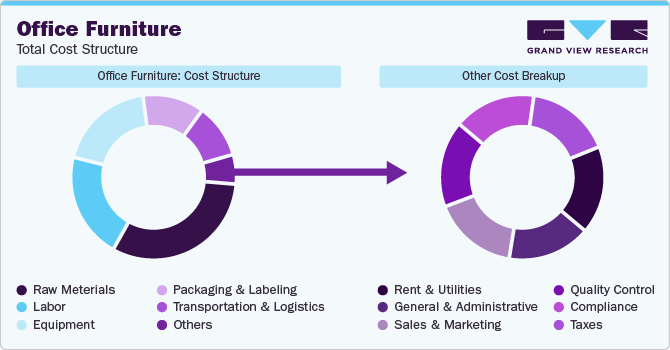
The cost structure of global office furniture is comprised of raw materials, labor, equipment, packaging and labeling, and transportation and logistics as the key components. Other costs include rent and utilities, general and administrative, sales and marketing, quality control, compliance, and taxes. Raw material costs constitute the major element in the cost structure, followed by labor costs.
The prices of office furniture fluctuate based on several variables. Key factors leading to price variations include raw material price fluctuations, transportation and logistical expenses, compliance and quality control, and product innovation. Prices of raw material components such as wood, metal, plastic, and glass fluctuate based on various parameters. For instance, the plastic prices vary based on the costs of plastic feedstock such as crude oil and natural gas.
The accompanying chart breaks down the cost structure. Breakup of other costs may be influenced by various cost components, as depicted below.
On a similar note, prices of glass vary depending on the costs of glass feedstock such as sand, limestone, and soda ash. Expenses related to transportation and logistics are dependent on several components such as fuel costs, storage and warehousing costs, freight costs, and costs of customs and duties. For instance, customs and duties are levied during international shipping of furniture products, and include components such as clearance fees, taxes, and documentation charges.
Suppliers in the office furniture market deploy several pricing models. One of the prominent pricing structures used is cost-plus pricing. This pricing structure aims to increase the profit margin per item for suppliers. Advantages of this pricing model include ease of calculation, providing a consistent rate of return, and reliability. However, it does not provide a competitive advantage to suppliers and may not reflect the true value of a product. Another key pricing model used is competition-based pricing, wherein prices set by rival players are used as a benchmark to set the product price. It helps suppliers maintain a competitive advantage and enhances speed to market. On the downside, it may lead to underpricing or overpricing and may affect margins. Other key pricing models used are bundled pricing and demand-based pricing.
The average prices of office furniture items in the U.S. vary according to the type of product. For instance, in 2023, the average prices of side chairs were in the range of USD 170 - USD 950. The average prices of lounge chairs were in the range of USD 450 - USD 2,300. The average prices of boardroom tables fell within the spectrum of USD 2,500 - USD 9,500. The average prices of conference tables spanned between 900 - USD 4,500. Moreover, the average prices of administrative workstations were in the range of USD 1,200 - USD 3,600. The average prices of executive seating products spanned between USD 450 - USD 1,650.
Sourcing Intelligence
”What methods do suppliers of office furniture implement to engage with buyers? What type of engagement model is used or preferred?”
In terms of office furniture procurement intelligence, buyers usually follow a full-service outsourcing model to engage with suppliers. In this model, buyers procure all products and ancillary services from single or multiple suppliers. This model enables buyers to select from an extensive product base and minimize the costs associated with the products. This further improves lead-time for sourcing and procurement and enhances the customization/personalization aspects of products. Moreover, buyers can select from a variety of green or eco-friendly alternatives, attain expert post-sales assistance, and leverage other benefits such as superior product warranty and quick replacement. Buyers favor long-term contract agreements with suppliers for enhanced security, improved stability, robust partnerships, and dedicated support. Moreover, long-term contracts enable buyers to consolidate suppliers by maintaining long-term relationships with two or more preferred suppliers. Long-term contracts also enable buyers to improve negotiations about product pricing and payment terms.
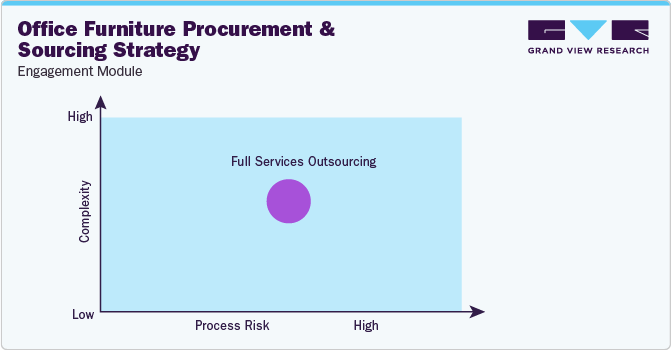
”In the full services outsourcing model, the client outsources the complete operation/manufacturing to single or multiple companies.”
Buyers generally prefer a ‘basic provider’ operating model for sourcing office furniture, wherein they typically pay a set ‘transaction’ price for products sourced. This operating model is widely preferred as these products have ready availability, hold standard purchase options, and are low-cost items having several suppliers. However, buyers who need to source items with predefined quality standards, qualifications, performance capabilities, or other specific criteria prefer an ‘approved provider’ operating model to engage with suppliers.
Businesses usually prefer to source these products locally or regionally to reduce supply chain and procurement costs. Within Asia-Pacific, India is the preferred low-cost/best-cost country for office furniture. India is a cost-effective destination due to its relatively cheap costs of raw materials, labor, equipment, packaging and labeling, and logistics. For instance, in 2023, costs of raw materials such as plastic, wood, metal, and glass were relatively cheap in India due to its reasonable feedstock costs. Most of the exports from India are shipped to the U.S., the UAE, and Germany.
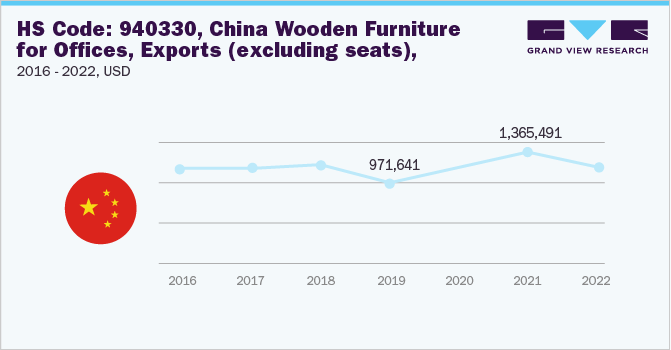
China is another cost-effective country to source these products due to the presence of large production facilities, the abundance of raw materials, a robust supply chain, and cheap labor costs. Additionally, countries such as Indonesia and the Philippines are also cost-effective countries due to favorable government incentives, attractive Foreign Direct Investments (FDIs), conducive trade contracts, and reasonable pricing strategies. As of November 2023, the top three global exporters of office furniture are China, Germany, and Italy. European countries such as Bulgaria, Romania, Poland, and Hungary are considered cost-effective destinations due to relatively low feedstock and energy costs, favorable tax subsidies and rebates, and considerably low equipment costs. Within South America, countries such as Brazil, Chile, and Ecuador are considered economical destinations due to low-cost production facilities, strategic trade agreements, and favorable government policies.
The report also provides details regarding day one, quick wins, portfolio analysis, key negotiation strategies of key suppliers, and low-cost/best-cost sourcing analysis. In the report, we have tried to provide a holistic industry perspective, an overview of the supplier landscape - the presence of different types of players and the competitive pressure within the industry as a whole (PORTER’s). Raw materials form the largest cost component while producing office furniture. Similarly, the supply chain practices under sourcing and procurement are also covered. One such instance is the operating model that encompasses all the business processes conducted within an organization. It is an integral aspect of the company's operations and plays a crucial role in its success
Office Furniture Procurement Intelligence Report Scope
Report Attribute
Details
Office Furniture Market Growth Rate
CAGR of 5.9% from 2024 to 2030
Base Year for Estimation
2023
Pricing Growth Outlook
5% - 10% increase (Annually)
Pricing Models
Cost-plus pricing, competition-based pricing, bundled pricing, demand-based pricing
Supplier Selection Scope
Cost and pricing, past engagements, productivity, geographical presence
Supplier Selection Criteria
Geographical service provision, industries served, years in service, employee strength, revenue generated, key clientele, regulatory certifications, product range, availability of smart products, eco-friendly product offerings, delivery mode, customer service, lead time, and others
Report Coverage
Revenue forecast, supplier ranking, supplier matrix, emerging technology, pricing models, cost structure, competitive landscape, growth factors, trends, engagement, and operating model
Key Companies Profiled
Global Furniture Group; Haworth Inc.; Herman Miller, Inc.; HNI Corporation; Humanscale Corporation; Kinnarps AB; Krueger International, Inc.; Okamura Corporation; Steelcase Inc.; Vitra International AG
Regional Scope
Global
Revenue Forecast in 2030
USD 93.1 billion
Historical Data
2021 - 2022
Quantitative Units
Revenue in USD billion and CAGR from 2024 to 2030
Customization Scope
Up to 48 hours of customization free with every report.
Pricing and Purchase Options
Avail customized purchase options to meet your exact research needs. Explore purchase options
Frequently Asked Questions About This Report
b. The global office furniture market size was estimated at approximately USD 62.3 billion in 2023 and is projected to grow at a CAGR of 5.9% from 2024 to 2030.
b. The rise in the number of office spaces and commercial zones, increasing demand for personalized products, technological advancements, surge in demand from the Information and Communications Technology (ICT) sector, and growing need for space optimization are driving the growth of this industry.
b. According to the LCC/BCC sourcing analysis, India and China are the cost-effective countries for sourcing office furniture.
b. This industry displays a fragmented landscape, with an intense level of competition. Some of the key players are Global Furniture Group, Haworth Inc., Herman Miller, Inc., HNI Corporation, Humanscale Corporation, Kinnarps AB, Krueger International, Inc., Okamura Corporation, Steelcase Inc., and Vitra International AG.
b. Raw materials, labor, equipment, packaging and labeling, and transportation and logistics are the major cost components associated with office furniture. Other costs include rent and utilities, general and administrative, sales and marketing, quality control, compliance, and taxes.
b. Comparing the prices offered by multiple suppliers, assessing the range of items provided, evaluating the experience level of suppliers, comparing testimonials of clients, evaluating the geographical service capabilities of suppliers, and comparing the lead time of suppliers are some of the best sourcing and procurement practices considered in this industry.
Share this report with your colleague or friend.
GET A FREE SAMPLE
This FREE sample includes market data points, ranging from trend analyses to market estimates & forecasts. See for yourself...
Add-on Services
Should Cost Analysis
Component wise cost break down for better negotiation for the client, highlights the key cost drivers in the market with future price fluctuation for different materials (e.g.: steel, aluminum, etc.) used in the production process
Rate Benchmarking
Offering cost transparency for different products / services procured by the client. A typical report involves 2-3 case scenarios helping clients to select the best suited engagement with the supplier
Salary Benchmarking
Determining and forecasting salaries for specific skill set labor to make decision on outsourcing vs in-house.
Supplier Newsletter
A typical newsletter study by capturing latest information for specific suppliers related to: M&As, technological innovations, expansion, litigations, bankruptcy etc.
![gvr icn]()
NEED A CUSTOM REPORT?
We can customize every report - free of charge - including purchasing stand-alone sections or country-level reports, as well as offer affordable discounts for start-ups & universities.
Contact us now to get our best pricing.
![esomar icon]()
ESOMAR certified & member
![ISO]()
ISO Certified
We are GDPR and CCPA compliant! Your transaction & personal information is safe and secure. For more details, please read our privacy policy.
We are committed towards customer satisfaction, and quality service.
Client Testimonials

"The quality of research they have done for us has been excellent..."
ISO Certified


