The global real-time PCR, digital PCR, and end-point PCR market size was estimated at USD 7.68 billion in 2023 and is projected to grow at a compound annual rate (CAGR) of 4.2% from 2024 to 2030. The increasing prevalence of genetic disorders is likely to further drive the real-time, digital, and end-point PCR market in coming years. According to a CDC report, congenital heart defects were the most common birth defects, affecting approximately 1% of births annually in the U.S. Early detection of genetic variations via prenatal testing may aid in rapid disease prevention, diagnosis, and choice of suitable treatment.
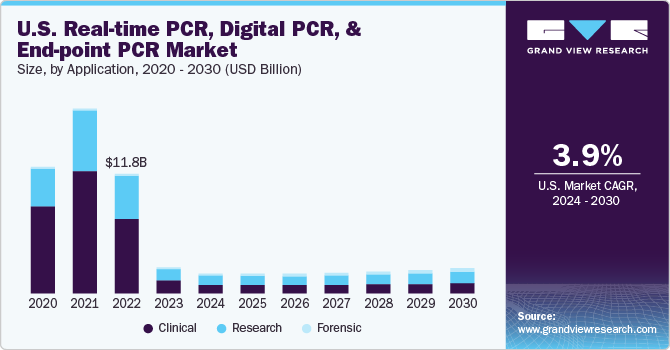
In addition, growing incidence of STIs, such as HIV and HPV, chronic & infectious diseases, and genetic disorders, such as Alzheimer’s disease, Streptococcal infection, Turner syndrome, & Parkinson’s disease, is expected to expand the target population, thereby boosting the market growth. For instance, as per the article published by UpToDate, Inc., many European countries, including England, France, Ireland, the Netherlands, and Sweden, observed a higher incidence of invasive group A streptococcal (GAS) infections among children under 10 years during the fall and winter of 2022 to 2023, compared to previous years.
Furthermore, rapid detection of infectious diseases with the use of polymerase chain reaction facilitates timely intervention and can enable the delivery of appropriate treatments. For instance, slow detection of tuberculosis through traditional methods can be overcome by utilizing polymerase chain reaction, which provides faster and more efficient results. Thus, an increase in prevalence of chronic diseases is expected to create growth opportunities for the market.
The adoption of PCR techniques is increasing owing to their accuracy, automation, precision, real-time quantification, and sensitivity. For instance, in May 2023, the state government of Orissa, India, decided to expand the NAT-PCR testing facility to all blood centers in a comprehensive manner rather than in phases. This expansion was estimated to cost approximately Rs 200 crore (USD 24.3 Million). This decision came in response to two PILs urging the introduction of NAT-PCR facility in all blood banks in India due to its ability to detect HIV-1, HIV-2, hepatitis B, and hepatitis C at an earlier stage compared to the traditional ELISA test.
Market growth stage is medium, and pace of the market growth is accelerating. The market is characterized by a high degree of innovation owing to the increasing introduction of novel dPCR and qPCR for different in vitro diagnostic applications. Moreover, key players are actively involved in developing novel POC testing products to capture market opportunities.
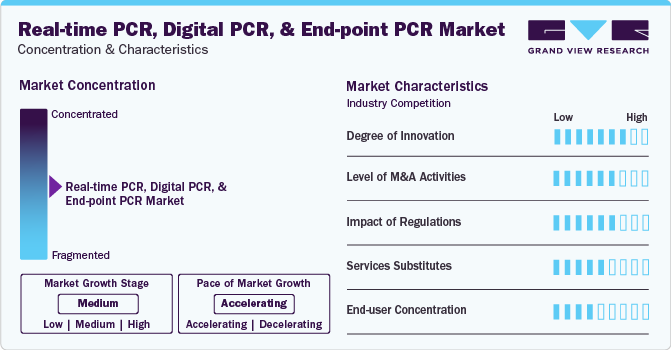
The market is also characterized by a medium level of merger and acquisition (M&A) activity by the leading players. In February 2023, Thermo Fisher Scientific, Inc. partnered with Mylab, a leading biotech company in India, to design and development of RT-PCR kits. Companies are adopting these strategies to increase their expertise and gain access to new regions in the emerging market.
The market is subject to increasing regulatory scrutiny. The regulatory framework for diagnostic product approvals is one of the major factors restraining the market growth. Moreover, the U.S. FDA plans to regulate laboratory-developed tests (LDTs) under medical device regulations, which is further anticipated to restrain the market uptake after implementing new rules.
Presence of substitute technologies such as immunoassay and other molecular diagnostic techniques can hamper the market uptake of PCR-based products. The increasing introduction of novel immunoassay tests, NGS, and others are becoming core substitutes for polymerase chain reactions. Moreover, the cost-effectiveness and increasing accuracy of immunoassay coupled with rapid test results make it a suitable substitute for the market.
End-user concentration is a major factor in the market. Increasing penetration of novel and portable PCR devices in hospitals, physician offices, central laboratories, POC facilities, and others is driving the market. Moreover, increasing demand for rapid and POC tests for oncology, biological markers, genetic tests for inherited conditions, and others is increasing demand for PCR tests.
In recent years, PCR witnessed technological advancements in terms of sensitivity, accuracy, efficiency, and cost-effectiveness. In February 2023, researchers at the Korea Institute of Science and Technology (KIST) made a significant breakthrough in PCR technology. Dr. Sang Kyung Kim and Dr. Seungwon Jung, along with their team, developed an ultrafast PCR method that reduces test time by 10-fold compared to existing tests and can be completed in just 5 minutes, maintaining same diagnostic accuracy as current methods. This advancement in PCR technology is caused due to the use of photothermal nanomaterials, which generate rapid heat upon exposure to light.
Key market players are undertaking strategic initiatives such as collaborations, partnerships, etc., and introducing novel technologies to maintain a competitive edge in real-time, digital, and end-point polymerase chain reaction market. For instance, in September 2022, BD (Becton, Dickinson, and Company), in collaboration with CerTest Biotec, developed a molecular PCR assay for research use and application by laboratories globally. Moreover, major players in industry are focusing on approval of reagents and tests for SARS-CoV-2. For instance, in March 2022, Kaneka launched novel PCR test kits capable of detecting the COVID-19 Omicron variant. Thus, various initiatives by market players are expected to boost the market.
Although procedural cost associated with polymerase chain reaction products and instruments is low, the overall cost of products is higher as compared to other devices or technology that can be used as a substitute for polymerase chain reaction products. For instance, manual dPCR instrument costs between USD 65,000 and USD 70,000, whereas automated dPCR instruments can cost nearly USD 100,000. high cost associated with technologies and assays is anticipated to limit their adoption under certain circumstances. This is mainly observed in countries with low budgets for genetic research. Moreover, commercial kits and reagents available in market are expensive. Hence, high cost of instruments and reagents required for real-time, digital, and end-point polymerase chain reaction technology is expected to impede market growth.
Clinical segment held the largest revenue share of over 51.91% in 2023. This can be attributed to increasing adoption of PCR in clinical diagnostics owing to its wide application in pathogen detection, genetic testing, oncology, pharmacogenomics, prenatal testing, and forensic According to an article published by the International Journal of Pharmaceutical Research and Applications in June 2023, polymerase chain reaction techniques are extensively applicable in investigating and assessing the relationship between an individual’s genetic makeup and its response to drugs polymerase chain reaction amplifies and analyzes specific genetic markers and helps predict an individual’s response to certain medications.
The forensic segment is expected to register the fastest growth rate over the forecast period. The advantages of polymerase chain reaction in forensic studies include augmented sensitivity & and specificity, reduced assay time and labor, and elimination need for an isotopic label. In addition, real-time, digital, and end-point polymerase chain reaction allows the amplification of degraded DNA samples, enabling subsequent typing because polymerase chain reaction-generated alleles are much smaller in size compared to alleles detected through RFLP analysis. Moreover, usage of polymerase chain reaction in conjunction with VNTR loci and high-resolution electrophoretic systems has been proven useful in human identification. Such capabilities are driving the segment.
Consumables and reagents segment held the largest revenue share of over 62.62% in 2023. Consumables and reagents influence the overall performance of an assay. They help create standardized workflows to support researchers in various fields, such as food testing, cancer detection of cancer & infectious diseases, and forensics. Global burden of diseases increased over past few years, and pandemic has contributed largely to high demand for consumables & reagents. Development of novel reagents has increased exponentially, which can be attributed to the demand for polymerase chain reaction reagents in diverse applications. For instance, in January 2023, F. Hoffmann-La Roche Ltd developed a novel COVID-19 PCR test, VirSNiP SARS-CoV-2 Spike F486P, to target XBB.1.5 Omicron sub-variant for research only. These strategies are propelling segment growth.
Moreover, increasing prevalence of chronic conditions and widespread adoption of polymerase chain reaction technology have raised a demand for consumables and reagents. Additionally, pharmaceutical and healthcare sectors' growing acceptance of technological advancements, along with heightened research efforts to develop innovative preventive and therapeutic products, have further contributed to segment growth.
Quantitative PCR segment held largest revenue share of over 83.34% in 2023. Quantitative PCR is also referred to as real-time PCR. It is more accurate, precise, and time-saving. qPCR has wide applications in quantifying gene expression, pathogen detection, copy number variation, microarray verification, viral quantification, Single Nucleotide Polymorphisms (SNP) genotyping, and microRNA analysis. The segment growth can be attributed to rapid technological advancements in devices, high usage in gene expression analysis, and genotyping as a validation tool. For instance, in February 2023, Applied Biosystems TaqPath PCR kits were launched by Thermo Fisher Scientific Inc. These kits can test and diagnose M. tuberculosis complex, hepatitis C virus, multi-drug resistant tuberculosis, hepatitis B virus, and genetic analysis.
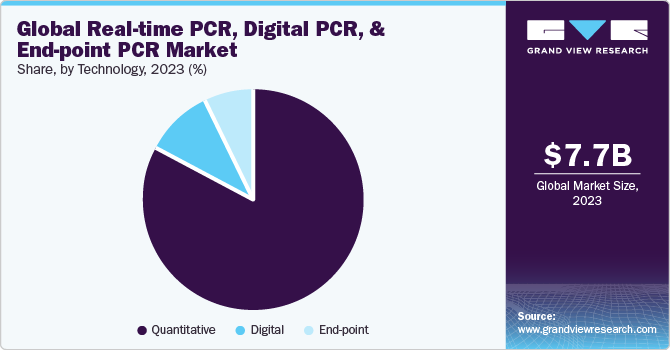
Digital PCR segment is estimated to grow at the fastest CAGR over the forecast period owing to technological advancements in chip and droplet-based dPCR is expected to drive segment growth. Moreover, favorable initiatives undertaken by market players are further anticipated to drive real-time, digital, and end-point polymerase chain reaction market growth. For instance, in July 2022, QIAGEN added 12 new kits and tests to its QIAcuity digital PCR portfolio for quantifying residual host cell DNA and Adeno-associated Virus (AAV) viral titer in cell and gene therapy. In addition, various strategic initiatives undertaken by leading players and ongoing regulatory approvals from Emergency Use Authorization (EUA) are other factors contributing to the adoption of novel real-time, digital, and end point PCR products. For instance, in March 2023, Stilla Technologies and Atila Biosystems entered into an agreement to launch oncological digital PCR kits. Such initiatives are expected to increase the market penetration of these products.
North America dominated the market with a revenue share of over 35.94% in 2023. Growth can be attributed to rising prevalence of chronic diseases, genetic disorders, infectious diseases, and increasing demand for rapid diagnostic tests and growing geriatric population. For instance, according to the U.S. Census Bureau, 16.9% of the U.S. population, which is over 56 million, is aged 65 years and above. Furthermore, significant investments in gene-based research and presence of leading players, such as Thermo Fisher Scientific Inc.; Bio-Rad Laboratories, Inc.; & Agilent Technologies, have also positively influenced market. In January 2023, BD and CerTest Biotec received EUA from the U.S. FDA for a PCR test for Mpox virus detection in the U.S. Another factor driving the market growth is several technological advancements, such as microfluidic PCR in droplets, on-chip & off-chip thermocycling, and on-chip integration. For instance, in January 2021, LexaGene launched a microfluidic PCR device as an EUA test.
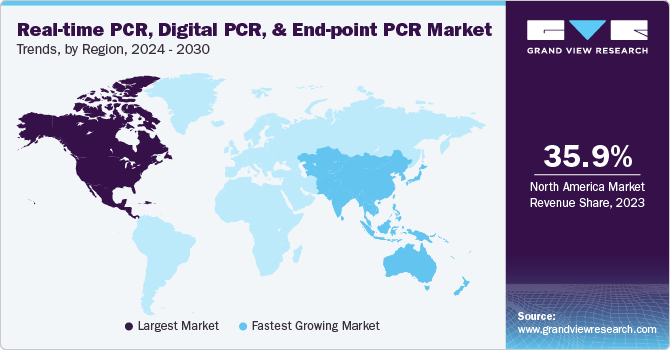
Asia Pacific is the most lucrative and fastest growing market, primarily driven by high unmet clinical needs, untapped market opportunities, and increasing healthcare expenditure. Technological advancements and rising prevalence of various target diseases are also expected to increase the demand for real-time, digital, and end point. Furthermore, the demand for healthcare products and government initiatives, to improve population’s health, will drive real-time PCR, digital PCR, and end-point PCR market during forecast period.
Some of the key players operating in the market include F. Hoffmann-La Roche Ltd.; Abbott, Thermo Fisher Scientific Inc.; and Danaher, among others. Major market players are adopting marketing strategies such as product launches, geographical expansion, partnerships, collaborations, and mergers and acquisitions in emerging and economically favorable regions. Market players are collaborating for application expansions of their existing products. Companies are developing novel tests for different disease indications compatible with their existing PCR instruments.
Standard BioTools, Stilla, Sensible Diagnostics, BGI Genomics, Virax Biolabs Group Limited, and others are emerging market participants in the real-time PCR, digital PCR, and end-point PCR market. Mid-level companies are developing novel tests and collaborating with overseas players to increase their global market footprint by offering innovative diagnostic solutions for difficult-to-detect diseases.
In December 2023, Walgreens is offering flu and COVID-19 testing during peak respiratory illness season in the U.S.
In October 2023, MAWD Laboratories Received Emergency Use Authorization (EUA) for its COVID-19 PCR Test from the U.S. FDA.
In May 2023, Standard BioTools announced the launch of the X9 High-Throughput Genomics System. The launch will allow the consumers to perform RT-PCR and NGS-based applications on a single benchtop system.
In April 2023, Curative, Inc. announced the spin-off of Sensible Diagnostics, focusing on the commercialization of a novel POC PCR testing platform to provide results within 10 minutes with high accuracy.
In March 2023, BGI Genomics and Zentya entered into a partnership to launch a PCR fecal test for colorectal cancer in Slovakia.
In March 2023, QIAGEN entered into a strategic partnership with Servier to develop a PCR test capable of detecting isocitrate dehydrogenase-1 mutations in acute myeloid leukemia patients.
Report Attribute |
Details |
Market size value in 2024 |
USD 5.59 billion |
Revenue forecast in 2030 |
USD 7.18 billion |
Growth rate |
CAGR of 4.2% from 2024 to 2030 |
Base year for estimation |
2023 |
Historical data |
2018 - 2022 |
Forecast period |
2024 - 2030 |
Report updated |
December 2023 |
Quantitative units |
Revenue in USD billion/million, and CAGR from 2024 to 2030 |
Report coverage |
Revenue forecast, company ranking, competitive landscape, growth factors, and trends |
Segments covered |
Technology, application, product, region |
Regional scope |
North America; Europe; Asia Pacific; Latin America; MEA |
Country scope |
U.S.; Canada; Germany; UK; France; Italy; Spain; Denmark; Sweden; Norway; China; Japan; India; Australia; South Korea; Thailand; Brazil; Mexico; Argentina; South Africa; Saudi Arabia; UAE; Kuwait |
Key companies profiled |
Abbott; Qiagen; Bio-Rad Laboratories Inc.; Agilent Technologies, Inc.; Thermo Fisher Scientific, Inc.; GE Healthcare; bioMérieux; F. Hoffmann-La Roche Ltd; Fluidigm Corporation |
Customization scope |
Free report customization (equivalent up to 8 analyst working days) with purchase. Addition or alteration to country, regional & segment scope. |
Pricing and purchase options |
Avail of customized purchase options to meet your exact research needs. Explore purchase options |
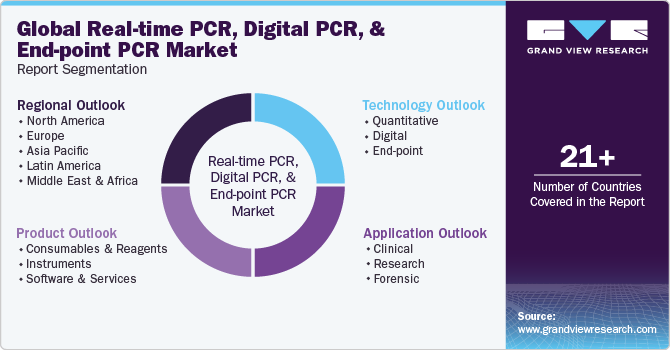
This report forecasts revenue growth and provides an analysis of the latest trends in each of the sub-segments from 2018 to 2030. For this report, Grand View Research has segmented the global real-time PCR, digital PCR, and end-point PCR market report based on technology, application, product, and region.
Technology Outlook (Revenue, USD Million, 2018 - 2030)
Quantitative
Consumables & Reagents
Instruments
Software & Services
Digital
Consumables & Reagents
Instruments
Software & Services
End-point
Consumables & Reagents
Instruments
Software & Services
Product Outlook (Revenue, USD Million, 2018 - 2030)
Consumables & Reagents
Instruments
Software & Services
Application Outlook (Revenue, USD Million, 2018 - 2030)
Clinical
Pathogen Testing
Oncology testing
Blood Screening
Liquid Biopsy
dPCR-based Non-Invasive Prenatal Testing (NIPT)
Others
Research
Stem Cell Research
DNA Cloning & Sequencing
Recombinant DNA Technology
Rare Mutation Detection
Gene Expression
Single Cell Analysis
Microbiome Analysis
Copy Number Variation Analysis
Library Quantification (NGS)
Characterization of Low-fold Changes in mRNA and miRNAExpression"
Species Identification
GMO Detection
Forensic
Regional Outlook (Revenue, USD Million, 2018 - 2030)
North America
U.S.
Canada
Europe
UK
Germany
France
Italy
Spain
Denmark
Sweden
Norway
Asia Pacific
Japan
China
India
Australia
South Korea
Thailand
Latin America
Brazil
Mexico
Argentina
Middle East & Africa
South Africa
Saudi Arabia
UAE
Kuwait
b. The global real-time PCR, endpoint PCR, and digital PCR market size was estimated at USD 7.68 billion in 2023 and is expected to reach USD 5.59 billion in 2024.
b. The global real-time PCR, endpoint PCR, and digital PCR market is anticipated to grow at a compound annual growth rate of 4.2% from 2024 to 2030 to reach USD 7.18 billion by 2030.
b. The consumables and reagents segment held the largest market share over 62.62% in terms of value in 2023. This can be attributed to the increased demand for COVID-19 testing and technological advancements in PCR techniques.
b. Some key players operating in the real-time PCR, endpoint PCR, and digital PCR market include Bio-Rad Laboratories Inc.; Thermo Fisher Scientific, Inc.; Qiagen; Abbott; Agilent Technologies, Inc.; BIOMÉRIEUX; Fluidigm Corporation.; and F. Hoffmann-La Roche Ltd.
b. Key factors that are driving the real-time PCR, endpoint PCR, and digital PCR market growth include the high prevalence of target diseases and rapid technological advancements such as the development of high-performance and superior qPCR and dPCR systems.
Table of Contents
Chapter 1 Real-time PCR, Digital PCR, And End-point PCR Market: Methodology and Scope
1.1 Market Segmentation
1.1.1 Product Segment
1.1.2 Technology Segment
1.1.3 Application Segment
1.2 Regional Scope
1.3 Estimates And Forecast Timeline
1.4 Objectives
1.4.1 Objective - 1
1.4.2 Objective - 2
1.4.3 Objective - 3
1.5 Research Methodology
1.6 Information Procurement
1.6.1 Purchased Database
1.6.2 Gvr’s Internal Database
1.6.3 Secondary Sources
1.6.4 Primary Research
1.7 Information Or Data Analysis
1.7.1 Data Analysis Models
1.8 Market Formulation & Validation
1.9 Model Details
1.9.1 Commodity Flow Analysis
1.10 List of Secondary Sources
1.11 List of Abbreviations
Chapter 2 Real-time PCR, Digital PCR, And End-point PCR Market: Executive Summary
2.1 Market Summary
2.2 Segment Snapshot
2.3 Competitive Landscape Snapshot
Chapter 3 Real-time PCR, Digital PCR, And End-point PCR Market: Industry Outlook
3.1 Market Lineage Outlook
3.1.1 Parent Market Lineage Outlook
3.1.2 Related/Ancillary Market Outlook
3.2 Market Dynamics
3.2.1 Market Drivers
3.2.1.1 Rising incidence of chronic diseases, infectious diseases, and genetic disorders
3.2.1.2 Technological advancements in PCR
3.2.1.3 Implementation of MIQE guidelines
3.2.1.4 Increasing demand for rapid diagnostic tests and growing adoption of qPCR & dPCR technologies
3.2.1.5 Increasing number of CROs and forensic & research laboratories
3.2.1.6 Increasing demand for prenatal genetic testing procedures
3.2.2 Market Restraint Analysis
3.2.2.1 High device costs associated with Real time PCR (qPCR)
3.2.2.2 Stringent regulatory policies
3.3 Comparative Analysis
3.4 SWOT Analysis, By Factor (Political & Legal, Economic and Technological)
3.5 Industry Analysis - Porter’s
Chapter 4 Real-time PCR (qPCR), end point PCR, and dPCR Market Analysis, Technology Scope, 2018 - 2030 (Revenue, USD Million)
4.1 Real-time PCR (qPCR), end point PCR, and dPCR Market: Technology Movement Analysis
4.2 Quantitative
4.2.1 Quantitative Market Estimates And Forecast, 2018 - 2030 (USD Million)
4.2.2 Consumables & Reagents
4.2.2.1 Consumables & Reagents Market Estimates And Forecast, 2018 - 2030 (USD Million)
4.2.3 Instruments
4.2.3.1 Instruments Market Estimates And Forecast, 2018 - 2030 (USD Million)
4.2.4 Software & Services
4.2.4.1 Software & Services Market Estimates And Forecast, 2018 - 2030 (USD Million)
4.3 Digital
4.3.1 Digital Market Estimates And Forecast, 2018 - 2030 (USD Million)
4.3.2 Consumables & Reagents
4.3.2.1 Consumables & Reagents Market Estimates And Forecast, 2018 - 2030 (USD Million)
4.3.3 Instruments
4.3.3.1 Instruments Market Estimates And Forecast, 2018 - 2030 (USD Million)
4.3.4 Software & Services
4.3.4.1 Software & Services Market Estimates And Forecast, 2018 - 2030 (USD Million)
4.4 End-Point Pcr
4.4.1 End-Point Pcr Market Estimates And Forecast, 2018 - 2030 (USD Million)
4.4.2 Consumables & Reagents
4.4.2.1 Consumables & Reagents Market Estimates And Forecast, 2018 - 2030 (USD Million)
4.4.3 Instruments
4.4.3.1 Instruments Market Estimates And Forecast, 2018 - 2030 (USD Million)
4.4.4 Software & Services
4.4.4.1 Software & services market estimates and forecast, 2018 - 2030 (USD Million)
Chapter 5 Real-time PCR (qPCR), end point PCR, and dPCR Market Analysis, Product Scope, 2018 - 2030 (Revenue, USD Million)
5.1 Real-time PCR (qPCR), end point PCR, and dPCR Market: Products Movement Analysis
5.2 Consumables & Reagents
5.2.1 Consumables & Reagents Market Estimates And Forecast, 2018 - 2030 (USD Million)
5.3 Instruments
5.3.1 Instruments Market Estimates And Forecast, 2018 - 2030 (USD Million)
5.4 Software & Services
5.4.1 Software & Services Market Estimates And Forecast, 2018 - 2030 (USD Million)
Chapter 6 Real-time PCR (qPCR), end point PCR, and dPCR Market Analysis, Application Scope, 2018 - 2030 (Revenue, USD Million)
6.1 Real-time PCR (qPCR), end point PCR, and dPCR Market: Application Movement Analysis
6.2 Clinical
6.2.1 Clinical Market Estimates And Forecast, 2018 - 2030 (USD Million)
6.2.2 Pathogen Testing
6.2.2.1 Pathogen Testing Market Estimates And Forecast, 2018 - 2030 (USD Million)
6.2.3 Oncology Testing
6.2.3.1 Oncology Testing Market Estimates And Forecast, 2018 - 2030 (USD Million)
6.2.4 Blood Screening
6.2.4.1 Blood Screening Market Estimates And Forecast, 2018 - 2030 (USD Million)
6.2.5 Liquid Biopsy Testing
6.2.5.1 Liquid Biopsy Testing Market Estimates And Forecast, 2018 - 2030 (USD Million)
6.2.6 Dpcr-Based Non-Invasive Prenatal Testing (Nipt)
6.2.6.1 Dpcr-Based Non-Invasive Prenatal Testing (Nipt) Market Estimates And Forecast, 2018 - 2030 (USD Million)
6.2.7 Others
6.2.7.1 Others Market Estimates And Forecast, 2018 - 2030 (USD Million)
6.3 Research
6.3.1 Research Market Estimates And Forecast, 2018 - 2030 (USD Million)
6.3.2 Stem Cell Research
6.3.2.1 Stem Cell Research Market Estimates And Forecast, 2018 - 2030 (USD Million)
6.3.3 Dna Cloning & Sequencing
6.3.3.1 Dna Cloning & Sequencing Market Estimates And Forecast, 2018 - 2030 (USD Million)
6.3.4 Recombinant Dna Technology
6.3.4.1 Recombinant Dna Technology Market Estimates And Forecast, 2018 - 2030 (USD Million)
6.3.5 Rare Mutation Detection
6.3.5.1 Rare Mutation Detection Market Estimates And Forecast, 2018 - 2030 (USD Million)
6.3.6 Gene Expression
6.3.6.1 Gene Expression Market Estimates And Forecast, 2018 - 2030 (USD Million)
6.3.7 Single-Cell Analysis
6.3.7.1 Single-Cell Analysis Market Estimates And Forecast, 2018 - 2030 (USD Million)
6.3.8 Microbiome Analysis
6.3.8.1 Microbiome Analysis Market Estimates And Forecast, 2018 - 2030 (USD Million)
6.3.9 Copy Number Variation Analysis
6.3.9.1 Copy Number Variation Analysis Market Estimates And Forecast, 2018 - 2030 (USD Million)
6.3.10 Library Quantification (Ngs)
6.3.10.1 Library Quantification (Ngs) Market Estimates And Forecast, 2018 - 2030 (USD Million)
6.3.11 Characterization Of Low-Fold Changes In Mrna And Mirna Expression
6.3.11.1 Characterization Of Low-Fold Changes In Mrna And Mirna Expression Market Estimates And Forecast, 2018 - 2030 (USD Million)
6.3.12 Species Identification
6.3.12.1 Species identification market estimates and forecast, 2018 - 2030 (USD Million)
6.3.13 GMO Detection
6.3.13.1 GMO detection market estimates and forecast, 2018 - 2030 (USD Million)
6.4 Forensics and Others
6.4.1.1 Forensics and others market estimates and forecast, 2018 - 2030 (USD Million)
Chapter 7 Real-time PCR (qPCR), end point PCR, and dPCR Market Analysis, Regional Scope, 2018 - 2030 (Revenue, USD Million)
7.1 Market Share Analysis by Country, 2023 & 2030
7.1.1 North America
7.1.1.1 North America market estimates and forecast, 2018 - 2030 (USD Million)
7.1.1.2 U.S.
7.1.1.2.1 U.S. market estimates and forecast, 2018 - 2030 (USD Million)
7.1.1.2.2 Key country dynamics
7.1.1.2.3 Competitive scenario
7.1.1.2.4 Regulatory framework
7.1.1.3 Canada
7.1.1.3.1 Canada market estimates and forecast, 2018 - 2030 (USD Million)
7.1.1.3.2 Key country dynamics
7.1.1.3.3 Competitive scenario
7.1.1.3.4 Regulatory framework
7.1.2 Europe
7.1.2.1 Europe market estimates and forecast, 2018 - 2030 (USD Million)
7.1.2.2 UK
7.1.2.2.1 UK market estimates and forecast, 2018 - 2030 (USD Million)
7.1.2.2.2 Key country dynamics
7.1.2.2.3 Competitive scenario
7.1.2.2.4 Regulatory framework
7.1.2.3 Germany
7.1.2.3.1 Germany market estimates and forecast, 2018 - 2030 (USD Million)
7.1.2.3.2 Key country dynamics
7.1.2.3.3 Competitive scenario
7.1.2.3.4 Regulatory framework
7.1.2.4 France
7.1.2.4.1 France market estimates and forecast, 2018 - 2030 (USD Million)
7.1.2.4.2 Key country dynamics
7.1.2.4.3 Competitive scenario
7.1.2.4.4 Regulatory framework
7.1.2.5 Italy
7.1.2.5.1 Italy market estimates and forecast, 2018 - 2030 (USD Million)
7.1.2.5.2 Key country dynamics
7.1.2.5.3 Competitive scenario
7.1.2.5.4 Regulatory framework
7.1.2.6 Spain
7.1.2.6.1 Spain market estimates and forecast, 2018 - 2030 (USD Million)
7.1.2.6.2 Key country dynamics
7.1.2.6.3 Competitive scenario
7.1.2.6.4 Regulatory framework
7.1.2.7 Denmark
7.1.2.7.1 Denmark market estimates and forecast, 2018 - 2030 (USD Million)
7.1.2.7.2 Key country dynamics
7.1.2.7.3 Competitive scenario
7.1.2.7.4 Regulatory framework
7.1.2.8 Sweden
7.1.2.8.1 Sweden market estimates and forecast, 2018 - 2030 (USD Million)
7.1.2.8.2 Key country dynamics
7.1.2.8.3 Competitive scenario
7.1.2.8.4 Regulatory framework
7.1.2.9 Norway
7.1.2.9.1 Norway market estimates and forecast, 2018 - 2030 (USD Million)
7.1.2.9.2 Key country dynamics
7.1.2.9.3 Competitive scenario
7.1.2.9.4 Regulatory framework
7.1.3 Asia-Pacific
7.1.3.1 Asia-Pacific market estimates and forecast, 2018 - 2030 (USD Million)
7.1.3.2 Japan
7.1.3.2.1 Japan market estimates and forecast, 2018 - 2030 (USD Million)
7.1.3.2.2 Key country dynamics
7.1.3.2.3 Competitive scenario
7.1.3.2.4 Regulatory framework
7.1.3.3 India
7.1.3.3.1 India market estimates and forecast, 2018 - 2030 (USD Million)
7.1.3.3.2 Key country dynamics
7.1.3.3.3 Competitive scenario
7.1.3.3.4 Regulatory framework
7.1.3.4 Australia
7.1.3.4.1 Australia market estimates and forecast, 2018 - 2030 (USD Million)
7.1.3.4.2 Key country dynamics
7.1.3.4.3 Competitive scenario
7.1.3.4.4 Regulatory framework
7.1.3.5 China
7.1.3.5.1 China market estimates and forecast, 2018 - 2030 (USD Million)
7.1.3.5.2 Key country dynamics
7.1.3.5.3 Competitive scenario
7.1.3.5.4 Regulatory framework
7.1.3.6 South Korea
7.1.3.6.1 South Korea market estimates and forecast, 2018 - 2030 (USD Million)
7.1.3.6.2 Key country dynamics
7.1.3.6.3 Competitive scenario
7.1.3.6.4 Regulatory framework
7.1.3.7 Thailand
7.1.3.7.1 Thailand market estimates and forecast, 2018 - 2030 (USD Million)
7.1.3.7.2 Key country dynamics
7.1.3.7.3 Competitive scenario
7.1.3.7.4 Regulatory framework
7.1.4 Latin America
7.1.4.1 Latin America market estimates and forecast, 2018 - 2030 (USD Million)
7.1.4.2 Brazil
7.1.4.2.1 Brazil market estimates and forecast, 2018 - 2030 (USD Million)
7.1.4.2.2 Key country dynamics
7.1.4.2.3 Competitive scenario
7.1.4.2.4 Regulatory framework
7.1.4.3 Mexico
7.1.4.3.1 Mexico market estimates and forecast, 2018 - 2030 (USD Million)
7.1.4.3.2 Key country dynamics
7.1.4.3.3 Competitive scenario
7.1.4.3.4 Regulatory framework
7.1.4.4 Argentina
7.1.4.4.1 Argentina market estimates and forecast, 2018 - 2030 (USD Million)
7.1.4.4.2 Key country dynamics
7.1.4.4.3 Competitive scenario
7.1.4.4.4 Regulatory framework
7.1.5 Middle East & Africa
7.1.5.1 Middle East & Africa market estimates and forecast, 2018 - 2030 (USD Million)
7.1.5.2 South Africa
7.1.5.2.1 South Africa market estimates and forecast, 2018 - 2030 (USD Million)
7.1.5.2.2 Key country dynamics
7.1.5.2.3 Competitive scenario
7.1.5.2.4 Regulatory framework
7.1.5.3 Saudi Arabia
7.1.5.3.1 Saudi Arabia market estimates and forecast, 2018 - 2030 (USD Million)
7.1.5.3.2 Key country dynamics
7.1.5.3.3 Competitive scenario
7.1.5.3.4 Regulatory framework
7.1.5.4 UAE
7.1.5.4.1 UAE market estimates and forecast, 2018 - 2030 (USD Million)
7.1.5.4.2 Key country dynamics
7.1.5.4.3 Competitive scenario
7.1.5.4.4 Regulatory framework
7.1.5.5 Kuwait
7.1.5.5.1 Kuwait market estimates and forecast, 2018 - 2030 (USD Million)
7.1.5.5.2 Key country dynamics
7.1.5.5.3 Competitive scenario
7.1.5.5.4 Regulatory framework
Chapter 8 Real-time PCR (qPCR), end point PCR, and dPCR Market - Competitive Landscape
8.1 Company Categorization
8.2 Strategy Mapping
8.2.1 New Product Launch
8.2.2 Partnerships
8.2.3 Acquisition
8.2.4 Collaboration
8.2.5 Funding
8.3 Key Company Market Share Analysis, 2023
8.4 Company Profiles
8.4.1 Abbott
8.4.1.1 Company Overview
8.4.1.2 Financial Performance
8.4.1.3 Product Benchmarking
8.4.1.4 Strategic Initiatives
8.4.2 Qiagen
8.4.2.1 Company Overview
8.4.2.2 Financial Performance
8.4.2.3 Product Benchmarking
8.4.2.4 Strategic Initiatives
8.4.3 Bio-Rad Laboratories, Inc.
8.4.3.1 Company Overview
8.4.3.2 Financial Performance
8.4.3.3 Product Benchmarking
8.4.3.4 Strategic Initiatives
8.4.4 Agilent Technologies, Inc.
8.4.4.1 Company Overview
8.4.4.2 Financial Performance
8.4.4.3 Product Benchmarking
8.4.4.4 Strategic Initiatives
8.4.5 Thermo Fisher Scientific, Inc.
8.4.5.1 Company Overview
8.4.5.2 Affymetrix
8.4.5.3 Company Overview
8.4.5.4 Financial Performance
8.4.5.5 Product Benchmarking
8.4.5.6 Strategic Initiatives
8.4.6 Ge Healthcare
8.4.6.1 Company Overview
8.4.6.2 Financial Performance
8.4.6.3 Product Benchmarking
8.4.6.4 Strategic Initiatives
8.4.7 Biomérieux Sa
8.4.7.1 Company Overview
8.4.7.2 Financial Performance
8.4.7.3 Product Benchmarking
8.4.7.4 Strategic Initiatives
8.4.8 F. Hoffmann-La Roche Ltd
8.4.8.1 Company Overview
8.4.8.2 Financial Performance
8.4.8.3 Product Benchmarking
8.4.8.4 Strategic Initiatives
8.4.9 Fluidigm Corporation
8.4.9.1 Company Overview
8.4.9.2 Financial Performance
8.4.9.3 Product Benchmarking
8.4.9.4 Strategic Initiatives
List of Tables
Table 1 List of key distributors and channel partners
Table 2 List of key emerging companies’ /technology disruptors/innovators
Table 3 North America real time PCR, digital PCR and end-point PCR market, by technology, 2018 - 2030 (USD Million)
Table 4 North America real time PCR, digital PCR and end-point PCR market, by product, 2018 - 2030 (USD Million)
Table 5 North America qPCR and dPCR consumables & reagents market, by technology, 2018 - 2030 (USD Million)
Table 6 North America qPCR and dPCR instruments market, by technology, 2018 - 2030 (USD Million)
Table 7 North America qPCR and dPCR software & services market, by technology, 2018 - 2030 (USD Million)
Table 8 North America real time PCR, digital PCR and end-point PCR market, by application, 2018 - 2030 (USD Million)
Table 9 North America real time PCR, digital PCR and end-point PCR market, by clinical application, 2018 - 2030 (USD Million)
Table 10 North America real time PCR, digital PCR and end-point PCR market, by research application, 2018 - 2030 (USD Million)
Table 11 U.S. real time PCR, digital PCR and end-point PCR market, by technology, 2018 - 2030 (USD Million)
Table 12 U.S. real time PCR, digital PCR and end-point PCR market, by product, 2018 - 2030 (USD Million)
Table 13 U.S. qPCR and dPCR consumables & reagents market, by technology, 2018 - 2030 (USD Million)
Table 14 U.S. qPCR and dPCR instruments market, by technology, 2018 - 2030 (USD Million)
Table 15 U.S. qPCR and dPCR software & services market, by technology, 2018 - 2030 (USD Million)
Table 16 U.S. real time PCR, digital PCR and end-point PCR market, by application, 2018 - 2030 (USD Million)
Table 17 U.S. real time PCR, digital PCR and end-point PCR market, by clinical application, 2018 - 2030 (USD Million)
Table 18 U.S. real time PCR, digital PCR and end-point PCR market, by research application, 2018 - 2030 (USD Million)
Table 19 Canada real time PCR, digital PCR and end-point PCR market, by technology, 2018 - 2030 (USD Million)
Table 20 Canada real time PCR, digital PCR and end-point PCR market, by product, 2018 - 2030 (USD Million)
Table 21 Canada qPCR and dPCR consumables & reagents market, by technology, 2018 - 2030 (USD Million)
Table 22 Canada qPCR and dPCR instruments market, by technology, 2018 - 2030 (USD Million)
Table 23 Canada qPCR and dPCR software & services market, by technology, 2018 - 2030 (USD Million)
Table 24 Canada real time PCR, digital PCR and end-point PCR market, by application, 2018 - 2030 (USD Million)
Table 25 Canada real time PCR, digital PCR and end-point PCR market, by clinical application, 2018 - 2030 (USD Million)
Table 26 Canada real time PCR, digital PCR and end-point PCR market, by research application, 2018 - 2030 (USD Million)
Table 27 Europe real time PCR, digital PCR and end-point PCR market, by technology, 2018 - 2030 (USD Million)
Table 28 Europe real time PCR, digital PCR and end-point PCR market, by product, 2018 - 2030 (USD Million)
Table 29 Europe qPCR and dPCR consumables & reagents market, by technology, 2018 - 2030 (USD Million)
Table 30 Europe qPCR and dPCR instruments market, by technology, 2018 - 2030 (USD Million)
Table 31 Europe qPCR and dPCR software & services market, by technology, 2018 - 2030 (USD Million)
Table 32 Europe real time PCR, digital PCR and end-point PCR market, by application, 2018 - 2030 (USD Million)
Table 33 Europe real time PCR, digital PCR and end-point PCR market, by clinical application, 2018 - 2030 (USD Million)
Table 34 Europe real time PCR, digital PCR and end-point PCR market, by research application, 2018 - 2030 (USD Million)
Table 35 U.K. real time PCR, digital PCR and end-point PCR market, by technology, 2018 - 2030 (USD Million)
Table 36 U.K. real time PCR, digital PCR and end-point PCR market, by product, 2018 - 2030 (USD Million)
Table 37 U.K. qPCR and dPCR consumables & reagents market, by technology, 2018 - 2030 (USD Million)
Table 38 U.K. qPCR and dPCR instruments market, by technology, 2018 - 2030 (USD Million)
Table 39 U.K. qPCR and dPCR software & services market, by technology, 2018 - 2030 (USD Million)
Table 40 U.K. real time PCR, digital PCR and end-point PCR market, by application, 2018 - 2030 (USD Million)
Table 41 U.K. real time PCR, digital PCR and end-point PCR market, by clinical application, 2018 - 2030 (USD Million)
Table 42 U.K. real time PCR, digital PCR and end-point PCR market, by research application, 2018 - 2030 (USD Million)
Table 43 Germany real time PCR, digital PCR and end-point PCR market, by technology, 2018 - 2030 (USD Million)
Table 44 Germany real time PCR, digital PCR and end-point PCR market, by product, 2018 - 2030 (USD Million)
Table 45 Germany qPCR and dPCR consumables & reagents market, by technology, 2018 - 2030 (USD Million)
Table 46 Germany qPCR and dPCR instruments market, by technology, 2018 - 2030 (USD Million)
Table 47 Germany qPCR and dPCR software & services market, by technology, 2018 - 2030 (USD Million)
Table 48 Germany real time PCR, digital PCR and end-point PCR market, by application, 2018 - 2030 (USD Million)
Table 49 Germany real time PCR, digital PCR and end-point PCR market, by clinical application, 2018 - 2030 (USD Million)
Table 50 Germany real time PCR, digital PCR and end-point PCR market, by research application, 2018 - 2030 (USD Million)
Table 51 Italy real time PCR, digital PCR and end-point PCR market, by technology, 2018 - 2030 (USD Million)
Table 52 Italy real time PCR, digital PCR and end-point PCR market, by product, 2018 - 2030 (USD Million)
Table 53 Italy qPCR and dPCR consumables & reagents market, by technology, 2018 - 2030 (USD Million)
Table 54 Italy qPCR and dPCR instruments market, by technology, 2018 - 2030 (USD Million)
Table 55 Italy qPCR and dPCR software & services market, by technology, 2018 - 2030 (USD Million)
Table 56 Italy real time PCR, digital PCR and end-point PCR market, by application, 2018 - 2030 (USD Million)
Table 57 Italy real time PCR, digital PCR and end-point PCR market, by clinical application, 2018 - 2030 (USD Million)
Table 58 Italy real time PCR, digital PCR and end-point PCR market, by research application, 2018 - 2030 (USD Million)
Table 59 Spain real time PCR, digital PCR and end-point PCR market, by technology, 2018 - 2030 (USD Million)
Table 60 Spain real time PCR, digital PCR and end-point PCR market, by product, 2018 - 2030 (USD Million)
Table 61 Spain qPCR and dPCR consumables & reagents market, by technology, 2018 - 2030 (USD Million)
Table 62 Spain qPCR and dPCR instruments market, by technology, 2018 - 2030 (USD Million)
Table 63 Spain qPCR and dPCR software & services market, by technology, 2018 - 2030 (USD Million)
Table 64 Spain real time PCR, digital PCR and end-point PCR market, by application, 2018 - 2030 (USD Million)
Table 65 Spain real time PCR, digital PCR and end-point PCR market, by clinical application, 2018 - 2030 (USD Million)
Table 66 Spain real time PCR, digital PCR and end-point PCR market, by research application, 2018 - 2030 (USD Million)
Table 67 France real time PCR, digital PCR and end-point PCR market, by technology, 2018 - 2030 (USD Million)
Table 68 France real time PCR, digital PCR and end-point PCR market, by product, 2018 - 2030 (USD Million)
Table 69 France qPCR and dPCR consumables & reagents market, by technology, 2018 - 2030 (USD Million)
Table 70 France qPCR and dPCR instruments market, by technology, 2018 - 2030 (USD Million)
Table 71 France qPCR and dPCR software & services market, by technology, 2018 - 2030 (USD Million)
Table 72 France real time PCR, digital PCR and end-point PCR market, by application, 2018 - 2030 (USD Million)
Table 73 France real time PCR, digital PCR and end-point PCR market, by clinical application, 2018 - 2030 (USD Million)
Table 74 France real time PCR, digital PCR and end-point PCR market, by research application, 2018 - 2030 (USD Million)
Table 75 Denmark real time PCR, digital PCR and end-point PCR market, by technology, 2018 - 2030 (USD Million)
Table 76 Denmark real time PCR, digital PCR and end-point PCR market, by product, 2018 - 2030 (USD Million)
Table 77 Denmark qPCR and dPCR consumables & reagents market, by technology, 2018 - 2030 (USD Million)
Table 78 Denmark qPCR and dPCR instruments market, by technology, 2018 - 2030 (USD Million)
Table 79 Denmark qPCR and dPCR software & services market, by technology, 2018 - 2030 (USD Million)
Table 80 Denmark real time PCR, digital PCR and end-point PCR market, by application, 2018 - 2030 (USD Million)
Table 81 Denmark real time PCR, digital PCR and end-point PCR market, by clinical application, 2018 - 2030 (USD Million)
Table 82 Denmark real time PCR, digital PCR and end-point PCR market, by research application, 2018 - 2030 (USD Million)
Table 83 Sweden real time PCR, digital PCR and end-point PCR market, by technology, 2018 - 2030 (USD Million)
Table 84 Sweden real time PCR, digital PCR and end-point PCR market, by product, 2018 - 2030 (USD Million)
Table 85 Sweden qPCR and dPCR consumables & reagents market, by technology, 2018 - 2030 (USD Million)
Table 86 Sweden qPCR and dPCR instruments market, by technology, 2018 - 2030 (USD Million)
Table 87 Sweden qPCR and dPCR software & services market, by technology, 2018 - 2030 (USD Million)
Table 88 Sweden real time PCR, digital PCR and end-point PCR market, by application, 2018 - 2030 (USD Million)
Table 89 Sweden real time PCR, digital PCR and end-point PCR market, by clinical application, 2018 - 2030 (USD Million)
Table 90 Sweden real time PCR, digital PCR and end-point PCR market, by research application, 2018 - 2030 (USD Million)
Table 91 Norway real time PCR, digital PCR and end-point PCR market, by technology, 2018 - 2030 (USD Million)
Table 92 Norway real time PCR, digital PCR and end-point PCR market, by product, 2018 - 2030 (USD Million)
Table 93 Norway qPCR and dPCR consumables & reagents market, by technology, 2018 - 2030 (USD Million)
Table 94 Norway qPCR and dPCR instruments market, by technology, 2018 - 2030 (USD Million)
Table 95 Norway qPCR and dPCR software & services market, by technology, 2018 - 2030 (USD Million)
Table 96 Norway real time PCR, digital PCR and end-point PCR market, by application, 2018 - 2030 (USD Million)
Table 97 Norway real time PCR, digital PCR and end-point PCR market, by clinical application, 2018 - 2030 (USD Million)
Table 98 Norway real time PCR, digital PCR and end-point PCR market, by research application, 2018 - 2030 (USD Million)
Table 99 Asia Pacific real time PCR, digital PCR and end-point PCR market, by technology, 2018 - 2030 (USD Million)
Table 100 Asia Pacific real time PCR, digital PCR and end-point PCR market, by product, 2018 - 2030 (USD Million)
Table 101 Asia Pacific qPCR and dPCR consumables & reagents market, by technology, 2018 - 2030 (USD Million)
Table 102 Asia Pacific qPCR and dPCR instruments market, by technology, 2018 - 2030 (USD Million)
Table 103 Asia Pacific qPCR and dPCR software & services market, by technology, 2018 - 2030 (USD Million)
Table 104 Asia Pacific real time PCR, digital PCR and end-point PCR market, by application, 2018 - 2030 (USD Million)
Table 105 Asia Pacific real time PCR, digital PCR and end-point PCR market, by clinical application, 2018 - 2030 (USD Million)
Table 106 Asia Pacific real time PCR, digital PCR and end-point PCR market, by research application, 2018 - 2030 (USD Million)
Table 107 China real time PCR, digital PCR and end-point PCR market, by technology, 2018 - 2030 (USD Million)
Table 108 China real time PCR, digital PCR and end-point PCR market, by product, 2018 - 2030 (USD Million)
Table 109 China qPCR and dPCR consumables & reagents market, by technology, 2018 - 2030 (USD Million)
Table 110 China qPCR and dPCR instruments market, by technology, 2018 - 2030 (USD Million)
Table 111 China qPCR and dPCR software & services market, by technology, 2018 - 2030 (USD Million)
Table 112 China real time PCR, digital PCR and end-point PCR market, by application, 2018 - 2030 (USD Million)
Table 113 China real time PCR, digital PCR and end-point PCR market, by clinical application, 2018 - 2030 (USD Million)
Table 114 China real time PCR, digital PCR and end-point PCR market, by research application, 2018 - 2030 (USD Million)
Table 115 Japan real time PCR, digital PCR and end-point PCR market, by technology, 2018 - 2030 (USD Million)
Table 116 Japan real time PCR, digital PCR and end-point PCR market, by product, 2018 - 2030 (USD Million)
Table 117 Japan qPCR and dPCR consumables & reagents market, by technology, 2018 - 2030 (USD Million)
Table 118 Japan qPCR and dPCR instruments market, by technology, 2018 - 2030 (USD Million)
Table 119 Japan qPCR and dPCR software & services market, by technology, 2018 - 2030 (USD Million)
Table 120 Japan real time PCR, digital PCR and end-point PCR market, by application, 2018 - 2030 (USD Million)
Table 121 Japan real time PCR, digital PCR and end-point PCR market, by clinical application, 2018 - 2030 (USD Million)
Table 122 Japan real time PCR, digital PCR and end-point PCR market, by research application, 2018 - 2030 (USD Million)
Table 123 India real time PCR, digital PCR and end-point PCR market, by technology, 2018 - 2030 (USD Million)
Table 124 India real time PCR, digital PCR and end-point PCR market, by product, 2018 - 2030 (USD Million)
Table 125 India qPCR and dPCR consumables & reagents market, by technology, 2018 - 2030 (USD Million)
Table 126 India qPCR and dPCR instruments market, by technology, 2018 - 2030 (USD Million)
Table 127 India qPCR and dPCR software & services market, by technology, 2018 - 2030 (USD Million)
Table 128 India real time PCR, digital PCR and end-point PCR market, by application, 2018 - 2030 (USD Million)
Table 129 India real time PCR, digital PCR and end-point PCR market, by clinical application, 2018 - 2030 (USD Million)
Table 130 India real time PCR, digital PCR and end-point PCR market, by research application, 2018 - 2030 (USD Million)
Table 131 Australia real time PCR, digital PCR and end-point PCR market, by technology, 2018 - 2030 (USD Million)
Table 132 Australia real time PCR, digital PCR and end-point PCR market, by product, 2018 - 2030 (USD Million)
Table 133 Australia qPCR and dPCR consumables & reagents market, by technology, 2018 - 2030 (USD Million)
Table 134 Australia qPCR and dPCR instruments market, by technology, 2018 - 2030 (USD Million)
Table 135 Australia qPCR and dPCR software & services market, by technology, 2018 - 2030 (USD Million)
Table 136 Australia real time PCR, digital PCR and end-point PCR market, by application, 2018 - 2030 (USD Million)
Table 137 Australia real time PCR, digital PCR and end-point PCR market, by clinical application, 2018 - 2030 (USD Million)
Table 138 Australia real time PCR, digital PCR and end-point PCR market, by research application, 2018 - 2030 (USD Million)
Table 139 South Korea real time PCR, digital PCR and end-point PCR market, by technology, 2018 - 2030 (USD Million)
Table 140 South Korea real time PCR, digital PCR and end-point PCR market, by product, 2018 - 2030 (USD Million)
Table 141 South Korea qPCR and dPCR consumables & reagents market, by technology, 2018 - 2030 (USD Million)
Table 142 South Korea qPCR and dPCR instruments market, by technology, 2018 - 2030 (USD Million)
Table 143 South Korea qPCR and dPCR software & services market, by technology, 2018 - 2030 (USD Million)
Table 144 South Korea real time PCR, digital PCR and end-point PCR market, by application, 2018 - 2030 (USD Million)
Table 145 South Korea real time PCR, digital PCR and end-point PCR market, by clinical application, 2018 - 2030 (USD Million)
Table 146 South Korea
Table 147 Thailand real time PCR, digital PCR and end-point PCR market, by technology, 2018 - 2030 (USD Million)
Table 148 Thailand real time PCR, digital PCR and end-point PCR market, by product, 2018 - 2030 (USD Million)
Table 149 Thailand qPCR and dPCR consumables & reagents market, by technology, 2018 - 2030 (USD Million)
Table 150 Thailand qPCR and dPCR instruments market, by technology, 2018 - 2030 (USD Million)
Table 151 Thailand qPCR and dPCR software & services market, by technology, 2018 - 2030 (USD Million)
Table 152 Thailand real time PCR, digital PCR and end-point PCR market, by application, 2018 - 2030 (USD Million)
Table 153 Thailand real time PCR, digital PCR and end-point PCR market, by clinical application, 2018 - 2030 (USD Million)
Table 154 Thailand real time PCR, digital PCR and end-point PCR market, by research application, 2018 - 2030 (USD Million)
Table 155 Latin America real time PCR, digital PCR and end-point PCR market, by technology, 2018 - 2030 (USD Million)
Table 156 Latin America real time PCR, digital PCR and end-point PCR market, by product, 2018 - 2030 (USD Million)
Table 157 Latin America qPCR and dPCR consumables & reagents market, by technology, 2018 - 2030 (USD Million)
Table 158 Latin America qPCR and dPCR instruments market, by technology, 2018 - 2030 (USD Million)
Table 159 Latin America qPCR and dPCR software & services market, by technology, 2018 - 2030 (USD Million)
Table 160 Latin America real time PCR, digital PCR and end-point PCR market, by application, 2018 - 2030 (USD Million)
Table 161 Latin America real time PCR, digital PCR and end-point PCR market, by clinical application, 2018 - 2030 (USD Million)
Table 162 Latin America real time PCR, digital PCR and end-point PCR market, by research application, 2018 - 2030 (USD Million)
Table 163 Brazil real time PCR, digital PCR and end-point PCR market, by technology, 2018 - 2030 (USD Million)
Table 164 Brazil real time PCR, digital PCR and end-point PCR market, by product, 2018 - 2030 (USD Million)
Table 165 Brazil qPCR and dPCR consumables & reagents market, by technology, 2018 - 2030 (USD Million)
Table 166 Brazil qPCR and dPCR instruments market, by technology, 2018 - 2030 (USD Million)
Table 167 Brazil qPCR and dPCR software & services market, by technology, 2018 - 2030 (USD Million)
Table 168 Brazil real time PCR, digital PCR and end-point PCR market, by application, 2018 - 2030 (USD Million)
Table 169 Brazil real time PCR, digital PCR and end-point PCR market, by clinical application, 2018 - 2030 (USD Million)
Table 170 Brazil real time PCR, digital PCR and end-point PCR market, by research application, 2018 - 2030 (USD Million)
Table 171 Mexico real time PCR, digital PCR and end-point PCR market, by technology, 2018 - 2030 (USD Million)
Table 172 Mexico real time PCR, digital PCR and end-point PCR market, by product, 2018 - 2030 (USD Million)
Table 173 Mexico qPCR and dPCR consumables & reagents market, by technology, 2018 - 2030 (USD Million)
Table 174 Mexico qPCR and dPCR instruments market, by technology, 2018 - 2030 (USD Million)
Table 175 Mexico qPCR and dPCR software & services market, by technology, 2018 - 2030 (USD Million)
Table 176 Mexico real time PCR, digital PCR and end-point PCR market, by application, 2018 - 2030 (USD Million)
Table 177 Mexico real time PCR, digital PCR and end-point PCR market, by clinical application, 2018 - 2030 (USD Million)
Table 178 Mexico real time PCR, digital PCR and end-point PCR market, by research application, 2018 - 2030 (USD Million)
Table 179 Argentina real time PCR, digital PCR and end-point PCR market, by technology, 2018 - 2030 (USD Million)
Table 180 Argentina real time PCR, digital PCR and end-point PCR market, by product, 2018 - 2030 (USD Million)
Table 181 Argentina qPCR and dPCR consumables & reagents market, by technology, 2018 - 2030 (USD Million)
Table 182 Argentina qPCR and dPCR instruments market, by technology, 2018 - 2030 (USD Million)
Table 183 Argentina qPCR and dPCR software & services market, by technology, 2018 - 2030 (USD Million)
Table 184 Argentina real time PCR, digital PCR and end-point PCR market, by application, 2018 - 2030 (USD Million)
Table 185 Argentina real time PCR, digital PCR and end-point PCR market, by clinical application, 2018 - 2030 (USD Million)
Table 186 Argentina real time PCR, digital PCR and end-point PCR market, by research application, 2018 - 2030 (USD Million)
Table 187 MEA real time PCR, digital PCR and end-point PCR market, by technology, 2018 - 2030 (USD Million)
Table 188 MEA real time PCR, digital PCR and end-point PCR market, by product, 2018 - 2030 (USD Million)
Table 189 MEA qPCR and dPCR consumables & reagents market, by technology, 2018 - 2030 (USD Million)
Table 190 MEA qPCR and dPCR instruments market, by technology, 2018 - 2030 (USD Million)
Table 191 MEA qPCR and dPCR software & services market, by technology, 2018 - 2030 (USD Million)
Table 192 MEA real time PCR, digital PCR and end-point PCR market, by application, 2018 - 2030 (USD Million)
Table 193 MEA real time PCR, digital PCR and end-point PCR market, by clinical application, 2018 - 2030 (USD Million)
Table 194 MEA real time PCR, digital PCR and end-point PCR market, by research application, 2018 - 2030 (USD Million)
Table 195 South Africa real time PCR, digital PCR and end-point PCR market, by technology, 2018 - 2030 (USD Million)
Table 196 South Africa real time PCR, digital PCR and end-point PCR market, by product, 2018 - 2030 (USD Million)
Table 197 South Africa qPCR and dPCR consumables & reagents market, by technology, 2018 - 2030 (USD Million)
Table 198 South Africa qPCR and dPCR instruments market, by technology, 2018 - 2030 (USD Million)
Table 199 South Africa qPCR and dPCR software & services market, by technology, 2018 - 2030 (USD Million)
Table 200 South Africa real time PCR, digital PCR and end-point PCR market, by application, 2018 - 2030 (USD Million)
Table 201 South Africa real time PCR, digital PCR and end-point PCR market, by clinical application, 2018 - 2030 (USD Million)
Table 202 South Africa real time PCR, digital PCR and end-point PCR market, by research application, 2018 - 2030 (USD Million)
Table 203 Saudi Arabia real time PCR, digital PCR and end-point PCR market, by technology, 2018 - 2030 (USD Million)
Table 204 Saudi Arabia real time PCR, digital PCR and end-point PCR market, by product, 2018 - 2030 (USD Million)
Table 205 Saudi Arabia qPCR and dPCR consumables & reagents market, by technology, 2018 - 2030 (USD Million)
Table 206 Saudi Arabia qPCR and dPCR instruments market, by technology, 2018 - 2030 (USD Million)
Table 207 Saudi Arabia qPCR and dPCR software & services market, by technology, 2018 - 2030 (USD Million)
Table 208 Saudi Arabia real time PCR, digital PCR and end-point PCR market, by application, 2018 - 2030 (USD Million)
Table 209 Saudi Arabia real time PCR, digital PCR and end-point PCR market, by clinical application, 2018 - 2030 (USD Million)
Table 210 Saudi Arabia real time PCR, digital PCR and end-point PCR market, by research application, 2018 - 2030 (USD Million)
Table 211 UAE real time PCR, digital PCR and end-point PCR market, by technology, 2018 - 2030 (USD Million)
Table 212 UAE real time PCR, digital PCR and end-point PCR market, by product, 2018 - 2030 (USD Million)
Table 213 UAE qPCR and dPCR consumables & reagents market, by technology, 2018 - 2030 (USD Million)
Table 214 UAE qPCR and dPCR instruments market, by technology, 2018 - 2030 (USD Million)
Table 215 UAE qPCR and dPCR software & services market, by technology, 2018 - 2030 (USD Million)
Table 216 UAE real time PCR, digital PCR and end-point PCR market, by application, 2018 - 2030 (USD Million)
Table 217 UAE real time PCR, digital PCR and end-point PCR market, by clinical application, 2018 - 2030 (USD Million)
Table 218 UAE real time PCR, digital PCR and end-point PCR market, by research application, 2018 - 2030 (USD Million)
Table 219 Kuwait real time PCR, digital PCR and end-point PCR market, by technology, 2018 - 2030 (USD Million)
Table 220 Kuwait real time PCR, digital PCR and end-point PCR market, by product, 2018 - 2030 (USD Million)
Table 221 Kuwait qPCR and dPCR consumables & reagents market, by technology, 2018 - 2030 (USD Million)
Table 222 Kuwait qPCR and dPCR instruments market, by technology, 2018 - 2030 (USD Million)
Table 223 Kuwait qPCR and dPCR software & services market, by technology, 2018 - 2030 (USD Million)
Table 224 Kuwait real time PCR, digital PCR and end-point PCR market, by application, 2018 - 2030 (USD Million)
Table 225 Kuwait real time PCR, digital PCR and end-point PCR market, by clinical application, 2018 - 2030 (USD Million)
Table 226 Kuwait real time PCR, digital PCR and end-point PCR market, by research application, 2018 - 2030 (USD Million)
List of Figures
Fig. 1 Real-time PCR (qPCR), end point PCR, and dPCR market segmentation
Fig. 2 Market research process
Fig. 3 Data triangulation techniques
Fig. 4 Primary research pattern
Fig. 5 Market research approaches
Fig. 6 Value-chain-based sizing & forecasting
Fig. 7 QFD modeling for market share assessment
Fig. 8 Market formulation & validation
Fig. 9 Real-time PCR (qPCR), end point PCR, and dPCR market snapshot
Fig. 10 Parent market outlook
Fig. 11 Related/ancillary market outlook
Fig. 12 Penetration and growth prospect mapping
Fig. 13 Real-time PCR (qPCR), end point PCR, and dPCR market driver impact
Fig. 14 Real-time PCR (qPCR), end point PCR, and dPCR market restraint impact
Fig. 15 SWOT analysis, by factor (Political & legal, economic, and technological)
Fig. 16 Industry Analysis - Porter’s
Fig. 17 Strategy mapping
Fig. 18 Ansoff Matrix
Fig. 19 Competitive dashboard analysis
Fig. 20 Regional network map
Fig. 21 Real-time PCR (qPCR), end point PCR, and dPCR market: Technology outlook and key takeaways
Fig. 22 Real-time PCR (qPCR), end point PCR, and dPCR market: Technology movement analysis& market share 2023 & 2030
Fig. 23 Quantitative market estimates and forecast, 2018 - 2030(USD Million)
Fig. 24 Digital market estimates and forecast, 2018 - 2030 (USD Million)
Fig. 25 End-point PCR market estimates and forecast, 2018 - 2030(USD Million)
Fig. 26 Real-time PCR (qPCR), end point PCR, and dPCR market: Products outlook and key takeaways
Fig. 27 Real-time PCR (qPCR), end point PCR, and dPCR market: Products movement analysis & market share 2023 & 2030
Fig. 28 Consumables & reagents market estimates and forecast, 2018 - 2030 (USD Million)
Fig. 29 Instruments market estimates and forecast, 2018 - 2030 (USD Million)
Fig. 30 Software & services market estimates and forecast, 2018 - 2030 (USD Million)
Fig. 31 Real-time PCR (qPCR), end point PCR, and dPCR market: Application outlook and key takeaways
Fig. 32 Real-time PCR (qPCR), end point PCR, and dPCR market: Application movement analysis & market share 2023 & 2030
Fig. 33 Clinical market estimates and forecast, 2018 - 2030 (USD Million)
Fig. 34 Pathogen testing market estimates and forecast, 2018 - 2030 (USD Million)
Fig. 35 Oncology testing market estimates and forecast, 2018 - 2030 (USD Million)
Fig. 36 Blood screening market estimates and forecast, 2018 - 2030 (USD Million)
Fig. 37 Liquid Biopsy testing market estimates and forecast, 2018 - 2030 (USD Million)
Fig. 38 dPCR-based Non-Invasive Prenatal Testing (NIPT) market estimates and forecast, 2018 - 2030 (USD Million)
Fig. 39 Others market estimates and forecast, 2018 - 2030 (USD Million)
Fig. 40 Research market estimates and forecast, 2018 - 2030 (USD Million)
Fig. 41 Stem cell research market estimates and forecast, 2018 - 2030 (USD Million)
Fig. 42 DNA cloning & sequencing market estimates and forecast, 2018 - 2030 (USD Million)
Fig. 43 Recombinant DNA technology market estimates and forecast, 2018 - 2030 (USD Million)
Fig. 44 Rare mutation detection market estimates and forecast, 2018 - 2030 (USD Million)
Fig. 45 Gene expression market estimates and forecast, 2018 - 2030 (USD Million)
Fig. 46 Single-cell analysis market estimates and forecast, 2018 - 2030 (USD Million)
Fig. 47 Microbiome analysis market estimates and forecast, 2018 - 2030 (USD Million)
Fig. 48 Copy number variation analysis market estimates and forecast, 2018 - 2030 (USD Million)
Fig. 49 Library quantification (NGS) market estimates and forecast, 2018 - 2030 (USD Million)
Fig. 50 Characterization of low-fold changes in mRNA and miRNA expression market estimates and forecast, 2018 - 2030 (USD Million)
Fig. 51 Species identification market estimates and forecast, 2018 - 2030 (USD Million)
Fig. 52 GMO detection market estimates and forecast, 2018 - 2030 (USD Million)
Fig. 53 Forensics and others market estimates and forecast, 2018 - 2030 (USD Million)
Fig. 54 Real-time PCR (qPCR), end point PCR, and dPCR market: Regional outlook and key takeaways
Fig. 55 Regional outlook, 2023 & 2030
Fig. 56 North America
Fig. 57 North America. market estimates and forecast, 2018 - 2030 (USD Million)
Fig. 58 U.S.
Fig. 59 U.S. market estimates and forecast, 2018 - 2030 (USD Million)
Fig. 60 Canada
Fig. 61 Canada market estimates and forecast, 2018 - 2030 (USD Million)
Fig. 62 Europe
Fig. 63 Europe market estimates and forecast, 2018 - 2030 (USD Million)
Fig. 64 UK
Fig. 65 UK market estimates and forecast, 2018 - 2030 (USD Million)
Fig. 66 Germany
Fig. 67 Germany market estimates and forecast, 2018 - 2030 (USD Million)
Fig. 68 France
Fig. 69 France market estimates and forecast, 2018 - 2030 (USD Million)
Fig. 70 Italy
Fig. 71 Italy market estimates and forecast, 2018 - 2030 (USD Million)
Fig. 72 Spain
Fig. 73 Spain market estimates and forecast, 2018 - 2030 (USD Million)
Fig. 74 Denmark
Fig. 75 Denmark market estimates and forecast, 2018 - 2030 (USD Million)
Fig. 76 Sweden
Fig. 77 Sweden market estimates and forecast, 2018 - 2030 (USD Million)
Fig. 78 Norway
Fig. 79 Norway market estimates and forecast, 2018 - 2030 (USD Million)
Fig. 80 Asia-Pacific
Fig. 81 Asia-Pacific market estimates and forecast, 2018 - 2030 (USD Million)
Fig. 82 Japan
Fig. 83 Japan market estimates and forecast, 2018 - 2030(USD Million)
Fig. 84 India
Fig. 85 India. market estimates and forecast, 2018 - 2030 (USD Million)
Fig. 86 China
Fig. 87 China market estimates and forecast, 2018 - 2030 (USD Million)
Fig. 88 Australia
Fig. 89 Australia market estimates and forecast, 2018 - 2030 (USD Million)
Fig. 90 South Korea
Fig. 91 South Korea market estimates and forecast, 2018 - 2030 (USD Million)
Fig. 92 Thailand
Fig. 93 Thailand market estimates and forecast, 2018 - 2030 (USD Million)
Fig. 94 Latin America
Fig. 95 Latin America. market estimates and forecast, 2018 - 2030 (USD Million)
Fig. 96 Brazil
Fig. 97 Brazil market estimates and forecast, 2018 - 2030 (USD Million)
Fig. 98 Mexico
Fig. 99 Mexico market estimates and forecast, 2018 - 2030 (USD Million)
Fig. 100 Argentina
Fig. 101 Argentina market estimates and forecast, 2018 - 2030 (USD Million)
Fig. 102 Middle East & Africa
Fig. 103 MEA market estimates and forecast, 2018 - 2030 (USD Million)
Fig. 104 South Africa
Fig. 105 South Africa market estimates and forecast, 2018 - 2030 (USD Million)
Fig. 106 Saudi Arabia
Fig. 107 Saudi Arabia market estimates and forecast, 2018 - 2030 (USD Million)
Fig. 108 UAE
Fig. 109 UAE market estimates and forecast, 2018 - 2030 (USD Million)
Fig. 110 Kuwait
Fig. 111 Kuwait market estimates and forecast, 2018 - 2030 (USD Million)
Market Segmentation
The increasing prevalence of chronic & infectious diseases and genetic disorders, such as Alzheimer’s disease, Turner syndrome, & Parkinson’s disease, is expected to boost the market demand during the forecast period. According to the CDC, chronic diseases, such as cancer, diabetes, & chronic kidney diseases, and respiratory diseases including asthma, are accountable for 7 in 10 deaths in the U.S. each year. Moreover, 6 out of 10 adults suffer from a chronic disease in the U.S. These chronic diseases are accountable for USD 3.5 trillion in healthcare costs in the U.S. annually. In addition, the Hepatitis B Foundation estimated that nearly 2 billion people were infected with hepatitis B infection in 2016. A recent study published by the NCBI states that as of 2018, 292 million people globally were infected chronically by hepatitis B. Moreover, 780,000 deaths occur due to hepatitis B annually. Rapid detection of infectious diseases with the use of PCR facilitates timely intervention and appropriate treatment. For instance, the detection of tuberculosis is slow through conventional techniques, which can be overcome with the use of PCR for faster results.
Over the recent years, PCR has witnessed technological advancements in terms of sensitivity, accuracy, efficiency, and cost-effectiveness. Key market players are introducing novel technologies to maintain a competitive edge. A growing number of automated instruments and their easy availability are among the factors expected to drive market growth. In addition, improvements in technology and the consequent introduction of affordable & high-efficacy products in the market are expected to drive the market. qPCR offers several benefits over traditional methods of PCR, such as automation, precision, detection of small pathogens, and reduction in errors. dPCR has a high-throughput system that reduces the time required for obtaining results. It also requires a relatively low amount of sample and provides higher accuracy, thereby creating a huge demand for these systems. Key players operating in the market are focusing on introducing novel & technologically advanced devices for PCR tests. For instance, in July 2017, Bio-Rad Laboratories launched droplet digital PCR Genome Edit Detection Assays to quantify the efficiency of CRISPR-Cas9 or any other genome using the technology of Bio-Rad’s droplet digital PCR.
The current cost associated with Real-time PCR (qPCR) devices is on the higher side. The cost of the CFX Connect PCR Detection System by Bio-Rad Laboratories is approximately USD 17,995, whereas the cost of Thermo Fisher Scientific’s 7900 HT qPCR system ranges from USD 20,000 to USD 30,000. Digital PCR instruments with more accurate results and sensitivity cost more than real-time PCR instruments. A manual dPCR costs between USD 65,000 and USD 70,000, whereas an automated dPCR costs USD 100,000. Thermo Fisher Scientific’s Open Array Real-Time PCR System (with TaqMan OpenArray Digital PCR Plates) costs USD 140,000 for the complete system and Bio-Rad Laboratories QX100 ddPCR system costs USD 89,000. The high cost of qPCR devices is expected to restrain the market growth.
This section will provide insights into the contents included in this real-time pcr, digital pcr, and end-point pcr market report and help gain clarity on the structure of the report to assist readers in navigating smoothly.
Industry overview
Industry trends
Market drivers and restraints
Market size
Growth prospects
Porter’s analysis
PESTEL analysis
Key market opportunities prioritized
Competitive landscape
Company overview
Financial performance
Product benchmarking
Latest strategic developments
Market size, estimates, and forecast from 2018 to 2030
Market estimates and forecast for product segments up to 2030
Regional market size and forecast for product segments up to 2030
Market estimates and forecast for application segments up to 2030
Regional market size and forecast for application segments up to 2030
Company financial performance
A three-pronged approach was followed for deducing the real-time pcr, digital pcr, and end-point pcr market estimates and forecasts. The process has three steps: information procurement, analysis, and validation. The whole process is cyclical, and steps repeat until the estimates are validated. The three steps are explained in detail below:
Information procurement: Information procurement is one of the most extensive and important stages in our research process, and quality data is critical for accurate analysis. We followed a multi-channel data collection process for real-time pcr, digital pcr, and end-point pcr market to gather the most reliable and current information possible.
Analysis: We mine the data collected to establish baselines for forecasting, identify trends and opportunities, gain insight into consumer demographics and drivers, and so much more. We utilized different methods of real-time pcr, digital pcr, and end-point pcr market data depending on the type of information we’re trying to uncover in our research.
Market Research Efforts: Bottom-up Approach for estimating and forecasting demand size and opportunity, top-down Approach for new product forecasting and penetration, and combined approach of both Bottom-up and Top-down for full coverage analysis.
Value-Chain-Based Sizing & Forecasting: Supply-side estimates for understanding potential revenue through competitive benchmarking, forecasting, and penetration modeling.
Demand-side estimates for identifying parent and ancillary markets, segment modeling, and heuristic forecasting.
Qualitative Functional Deployment (QFD) Modelling for market share assessment.
Market formulation and validation: We mine the data collected to establish baselines for forecasting, identify trends and opportunities, gain insight into consumer demographics and drivers, and so much more. We utilize different methods of data analysis depending on the type of information we’re trying to uncover in our research.
Market Formulation: This step involves the finalization of market numbers. This step on an internal level is designed to manage outputs from the Data Analysis step.
Data Normalization: The final market estimates and forecasts are then aligned and sent to industry experts, in-panel quality control managers for validation.
This step also entails the finalization of the report scope and data representation pattern.
Validation: The process entails multiple levels of validation. All these steps run in parallel, and the study is forwarded for publishing only if all three levels render validated results.
The real-time pcr, digital pcr, and end-point pcr market was categorized into four segments, namely technology (Quantitative, Digital, End-point), application (Clinical, Research, Forensic), product,(Consumables & Reagents, Instruments, Software & Services) and regions (North America, Europe, Asia Pacific, Latin America, Middle East & Africa).
The real-time pcr, digital pcr, and end-point pcr market was segmented into technology, application, product, and regions. The demand at a segment level was deduced using a funnel method. Concepts like the TAM, SAM, SOM, etc., were put into practice to understand the demand. We at GVR deploy three methods to deduce market estimates and determine forecasts. These methods are explained below:
Demand estimation of each product across countries/regions summed up to from the total market.
Variable analysis for demand forecast.
Demand estimation via analyzing paid database, and company financials either via annual reports or paid database.
Primary interviews for data revalidation and insight collection.
Used extensively for new product forecasting or analyzing penetration levels.
Tool used invoice product flow and penetration models Use of regression multi-variant analysis for forecasting Involves extensive use of paid and public databases.
Primary interviews and vendor-based primary research for variable impact analysis.
The real-time pcr, digital pcr, and end-point pcr market was analyzed at a regional level. The globe was divided into North America, Europe, Asia Pacific, Latin America, and Middle East & Africa, keeping in focus variables like consumption patterns, export-import regulations, consumer expectations, etc. These regions were further divided into twenty-three countries, namely, the U.S.; Canada; Germany; the UK; France; Italy; Spain; Denmark; Sweden; Norway; China; Japan; India; Australia; South Korea; Thailand; Brazil; Mexico; Argentina; South Africa; Saudi Arabia; UAE; Kuwait.
All three above-mentioned market research methodologies were applied to arrive at regional-level conclusions. The regions were then summed up to form the global market.
The real-time pcr, digital pcr, and end-point pcr market was analyzed via companies operating in the sector. Analyzing these companies and cross-referencing them to the demand equation helped us validate our assumptions and conclusions. Key market players analyzed include:
Abbott, Abbott was established in 1888 and is headquartered in the U.S. Abbott Laboratories has four core business segments: pharmaceuticals, devices, nutrition, and diagnostics. The company has a presence in more than 160 countries with research, manufacturing, sales, and distribution facilities. The diagnostic segment provides diagnostic systems, reagents, and tests for various applications. The company offers products based on technologies, such as PCR, fluorescence in situ hybridization, and DNA & RNA sequencing. As of December 2019, the company employed 107,000 people globally.
Qiagen, Qiagen is a holding company that caters to the biotechnology industry. Qiagen provides samples and assay technologies for academic research, applied testing, molecular diagnostics, and pharmaceutical research. The company markets over 500 products including consumable kits and automation systems. Qiagen products for molecular diagnostics cover relevant areas of healthcare ranging from early diagnosis of diseases, establishment of diagnosis, diagnostic testing for determination of suitable treatment, and point-of-need testing. The company’s customers include healthcare providers, pharmaceutical & biotechnology companies, government or industrial customers, and researchers. As of December 2019, 5,200 employees were working in the company. Qiagen has direct operations in 34 nations.
Bio-Rad Laboratories, Inc., Bio-Rad Laboratories, Inc. manufactures systems and products used to separate complex biological & chemical materials and analyze, identify, & purify their respective components. The company operates through two segments: clinical diagnostics and life sciences. The clinical diagnostics segment includes informatics systems, test systems, quality controls, and test kits. Similarly, the life sciences segment is employed in the creation and discovery of tools required in biological processes. The company manufactures reagents, apparatus, and laboratory instruments that are used in the process of biopharmaceutical production, research techniques, and food testing regimes. Primary users of Bio-Rad products include hospitals, research institutions, laboratories, biotechnology companies, and pharmaceutical firms. The company has direct distribution channels in approximately 35 countries. The company had 8,120 employees as of December 2019.
Agilent Technologies, Inc., Agilent Technologies, Inc. is involved in providing analytical instruments & software for analytical scientists & clinical researchers. The company has operations in pharmaceuticals, food, chemical & energy, environmental & forensics, and research segments. Its life sciences and applied market segment offers liquid & gas chromatography, mass spectrometry, spectroscopy, genomics & diagnostic consumables, services, and software. This company was formed in 1999 after it spun off from Hewlett-Packard. It delivers its products through direct sales, resellers, distributors, electronic commerce, and representatives of manufacturers. It has operations across the globe including the Americas, Europe, Africa, and Asia Pacific. The company’s diagnostics business includes companion diagnostics, nucleic acid contract manufacturing & pathology, genomics, and reagent partnership businesses. Its genomics portfolio includes genotyping, DNA methylation profiling, identification of gene rearrangements, gene expression profiling, gene copy number determination, arrays for DNA mutation detection, NGS target enrichment, and genetic data management & interpretation support software.
Thermo Fisher Scientific, Inc., Thermo Fisher Scientific, Inc. manufactures and supplies scientific equipment, analytical instruments, and other laboratory equipment. The company operates in pharmaceutical and biotechnology, industrial & applied research, diagnostics & healthcare, and academic & government segments. Thermo Fisher Scientific provides chromatographs, Erlenmeyer flasks, gene sequencers & spectrometers, clinical analytical tools, and diagnostic testing products. The company serves more than 400,000 customers around the world through its brands such as Applied Biosystems, Fisher Scientific, Thermo Scientific, Unity Lab Services, and Invitrogen. It is headquartered in the U.S. and employed more than 75,000 people as of 2019.
Affymetrix, Affymetrix, Inc. is an American company that manufactures DNA microarrays. The company is headquartered in Santa Clara, California, U.S. Affymetrix was acquired by Thermo Fisher Scientific, Inc. in March 2016. Its product line includes innovative technologies that allow parallel and multiplex analysis of biological systems at protein, cell, and gene levels. Its microarray solutions comprise all important components that are required for a microarray experiment, from reagents and arrays to software and instruments, allowing clinicians and scientists to understand underlying disease mechanisms, identify biomarkers for personalized medicine, and create novel molecular diagnostic tests.
Cytiva (GE Healthcare), Cytiva (GE Healthcare) changed its name from GE Healthcare Life Sciences in April 2020. GE Healthcare was incorporated in 1951 and is headquartered in Chicago, U.S. It is engaged in manufacturing and developing diagnostic solutions, bioprocessing, genomics, protein research, lab filtration, cellular therapy, and cell & gene therapy. The company offers services such as technology solutions for drug discovery, medical equipment, and solutions for clinicians & healthcare administrators. The company employs around 7,000 people worldwide. Moreover, it has a presence in over 40 nations globally.
bioMérieux SA, bioMérieux SA is a multinational biotechnology company and a subsidiary of Institut Mérieux. It is a maker of in vitro diagnostics with a focus on infectious diseases. The company is engaged in manufacturing instruments, chemical reagents, and software systems used by clinical laboratories to test for infections, such as tuberculosis, sepsis, hospital-acquired infections, & AIDS, cardiovascular conditions, and cancer. The company has 19 production sites and 20 R&D sites. bioMérieux is present in 43 countries and distributes its products in 160 countries.
F. Hoffmann-La Roche Ltd., F. Hoffmann-La Roche Ltd. is a healthcare company with business operations in the following two divisions: pharmaceuticals and diagnostics. Roche Diagnostics comprises Roche Professional Diagnostics (RPD), Roche Molecular Diagnostics (RMD), Roche Tissue Diagnostics, and Roche Diabetes Care. The product portfolio of Roche Diagnostics includes blood glucose meters, point-of-care testing devices, high-throughput analyzers for commercial & hospital diagnostic laboratories, and reagents & instruments for life sciences research. RMD, a segment of Roche Diagnostics, is engaged in the development, manufacture, and distribution of tests based on PCR technology & medical diagnostic products, platforms, and services. RMD’s automated platforms and diagnostic tests focus on areas including virology, genomics & oncology, blood screening tests, HPV & CT/NG, and microbiology. The company caters to a number of clients, including physicians, researchers, laboratories, hospitals, patients, and blood banks.
Fluidigm Corporation, Fluidigm Corporation, formerly known as Mycometrix Corporation, manufactures and develops microfluidic systems & technologies for life sciences and applied markets. The company offers consumables and instruments that include high performance. assays for gene expression & genotyping, integrated fluid circuits, and software. Fluidigm Corporation sells its products to agricultural, pharmaceutical & biotechnology companies; clinical research laboratories; and academic institutions. The company provides its 20 innovative solutions & services to 35 countries globally. The technologies provided by Fluidigm allow users to accelerate the development of therapeutics by supporting the identification of meaningful biomarkers.
Supply Side Estimates
Company revenue estimation via referring to annual reports, investor presentations, and Hoover’s.
Segment revenue determination via variable analysis and penetration modeling.
Competitive benchmarking to identify market leaders and their collective revenue shares.
Forecasting via analyzing commercialization rates, pipelines, market initiatives, distribution networks, etc.
Demand side estimates
Identifying parent markets and ancillary markets
Segment penetration analysis to obtain pertinent
revenue/volume
Heuristic forecasting with the help of subject matter experts
Forecasting via variable analysis
Understanding market dynamics (in terms of drivers, restraints, & opportunities) in the countries.
Understanding trends & variables in the individual countries & their impact on growth and using analytical tools to provide high-level insights into the market dynamics and the associated growth pattern.
Understanding market estimates and forecasts (with the base year as 2023, historic information from 2018 to 2022, and forecast from 2024 to 2030). Regional estimates & forecasts for each category are available and are summed up to form the global market estimates.
The report provides market value for the base year 2023 and a yearly forecast till 2030 in terms of revenue/volume or both. The market for each of the segment outlooks has been provided on region & country basis for the above-mentioned forecast period.
The key industry dynamics, major technological trends, and application markets are evaluated to understand their impact on the demand for the forecast period. The growth rates were estimated using correlation, regression, and time-series analysis.
We have used the bottom-up approach for market sizing, analyzing key regional markets, dynamics, & trends for various products and end-users. The total market has been estimated by integrating the country markets.
All market estimates and forecasts have been validated through primary interviews with the key industry participants.
Inflation has not been accounted for to estimate and forecast the market.
Numbers may not add up due to rounding off.
Europe consists of EU-8, Central & Eastern Europe, along with the Commonwealth of Independent States (CIS).
Asia Pacific includes South Asia, East Asia, Southeast Asia, and Oceania (Australia & New Zealand).
Latin America includes Central American countries and the South American continent
Middle East includes Western Asia (as assigned by the UN Statistics Division) and the African continent.
GVR strives to procure the latest and unique information for reports directly from industry experts, which gives it a competitive edge. Quality is of utmost importance to us, therefore every year we focus on increasing our experts’ panel. Primary interviews are one of the critical steps in identifying recent market trends and scenarios. This process enables us to justify and validate our market estimates and forecasts to our clients. With more than 8,000 reports in our database, we have connected with some key opinion leaders across various domains, including healthcare, technology, consumer goods, and the chemical sector. Our process starts with identifying the right platform for a particular type of report, i.e., emails, LinkedIn, seminars, or telephonic conversation, as every report is unique and requires a differentiated approach.
We send out questionnaires to different experts from various regions/ countries, which is dependent on the following factors:
Report/Market scope: If the market study is global, we send questionnaires to industry experts across various regions, including North America, Europe, Asia Pacific, Latin America, and MEA.
Market Penetration: If the market is driven by technological advancements, population density, disease prevalence, or other factors, we identify experts and send out questionnaires based on region or country dominance.
The time to start receiving responses from industry experts varies based on how niche or well-penetrated the market is. Our reports include a detailed chapter on the KoL opinion section, which helps our clients understand the perspective of experts already in the market space.
NEED A CUSTOM REPORT?
We can customize every report - free of charge - including purchasing stand-alone sections or country-level reports, as well as offer affordable discounts for start-ups & universities. Contact us now
We are GDPR and CCPA compliant! Your transaction & personal information is safe and secure. For more details, please read our privacy policy.
"The quality of research they have done for us has been excellent."