GVR Report cover Filters Market Size, Share & Trends Report

Filters Market Size, Share & Trends Analysis Report By Product (ICE, Air, Fluid Filters), By Application (Motor Vehicles, Consumer Goods, Industrial & Manufacturing, Utilities), By Region, And Segment Forecasts, 2024 - 2030

  • Report ID: 978-1-68038-195-5
  • Number of Pages: 124
  • Format: Electronic (PDF)

Filters Market Size & Trends

The global filters market size was estimated at USD 79.25 billion in 2023 and is expected to grow at a compound annual growth rate (CAGR) of 5.2% from 2024 to 2030. Growing emphasis on the reduction of emissions from automotive and industrial applications is expected to drive market growth over the forecast period. An increase in product usage in several consumer goods, such as air and water purifiers, is expected to have a positive impact on the industry’s growth. The rapidly growing adoption of air purifiers in homes, hotels, restaurants, airplanes, and train compartments for killing harmful microbes, such as bacteria and viruses, is expected to open new opportunities for market growth.

U.S. Filters market size and growth rate, 2024 - 2030

The market in the U.S. is expected to exhibit high growth on account of factors rising product demand from the automotive industries as per the environmental regulations laid down by the Environmental Protection Agency (EPA) for the installation of air emission control solutions in vehicles. In addition, economic revival and government initiatives to promote environmental protection are expected to drive market growth in the country. The global market growth is also credited to the increasing focus of the government on water treatment schemes for the construction of water treatment facilities due to factors such as the scarcity of quality drinking water, growing population, and contamination of ground and surface water bodies.

The industry is significantly affected by the availability of raw materials, such as paper, cotton, synthetic textiles & fibers, metals like iron & steel, adhesives, rubber, chemicals, and plastics. Thus, the fluctuations in the raw material prices have a direct impact on the manufacturing costs that limits the industry growth to some extent. The market growth is also expected to be driven by the rise in the global automotive industry on account of the growing population and increasing disposable income levels, especially in the developing regions, such as Asia Pacific, Middle East & Africa, and Central & South America. Filters are used in several applications in the automotive industry, such as oil intake, cabin air filtration, and emission filtration.

Market Concentration & Characteristics

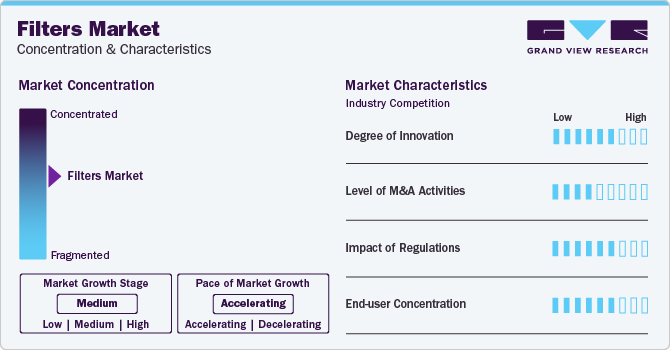
The degree of innovation is higher as the technological developments are aimed at manufacturing products that offer better cleaning properties, longer operational life, and low maintenance, which, in turn, are expected to play an important role in ascending the market over the forecast period.
filters Market Concentration & Characteristics

The market is also characterized by a medium to high level of merger and acquisition (M&A) activity by the leading players. This is due to several factors, including the need to consolidate in a growing market and increasing strategic importance for the distribution of products in various geographies.

Growing environmental concerns and changing consumer behavior have prompted various governments to implement regulations and initiatives in order to safeguard the environment. Stringent implementation of pollution control acts like the Safe Drinking Water Act (SDWA) and Clean Water Act (CWA), coupled with a rise in the number of water treatment plants, have created a wide scope for the utilization of filters. Such a stringent regulatory framework is anticipated to play a key role in shaping the filters market over the forecast period.

End-user concentration is a significant factor in the filters demand. Moderately growing demand for automobiles owing to factors such as rising disposable incomes, rising standards of living, and switching consumer trends for owning a private vehicle in developing regions such as Asia Pacific are likely to positively affect the market growth in the near future.

Product Insights

The ICE filters product segment led the market in 2023 and accounted for the maximum revenue share of more than 40%. This high share was credited to the rapid growth in the automobile industry as ICE filters are widely used in automobiles to improve fuel efficiency. The implementation of environmental regulations, such as the Kyoto Protocol, Euro 5, and Euro 6 to control the release of harmful emissions, is expected to drive the segment further. The usage of ICE filters is expected to rise over the coming years owing to the high adoption of a start-stop system for automatic shutdown & restart of the internal combustion engines, to reduce the emissions & fuel consumption and idling time of engines. The advancements in the automotive industry, such as electric and hybrid vehicles, will also drive the segment growth.

The market growth for fluid filters is expected to be driven by the rising investments by governments in the construction of water treatment plants to provide safe water for various residential, commercial, and industrial filtration market. In addition, wide usage of fluid filters in a variety of other applications, such as cold sterilization of beverages & pharmaceuticals, petroleum refining, and dairy processing, is expected to support the segment growth. The air filtration market size is expected to witness the fastest CAGR from 2022 to 2030 owing to the rising focus of governments on the reduction of pollutants from vehicle emissions. In addition, the rising adoption of air purifiers in recent times is expected to fuel the demand for using cabin air filters that help in removing pollen & allergens from the air in homes, offices, aircraft, and train compartments. Thereby, fueling the growth of air filters market.

Application Insights

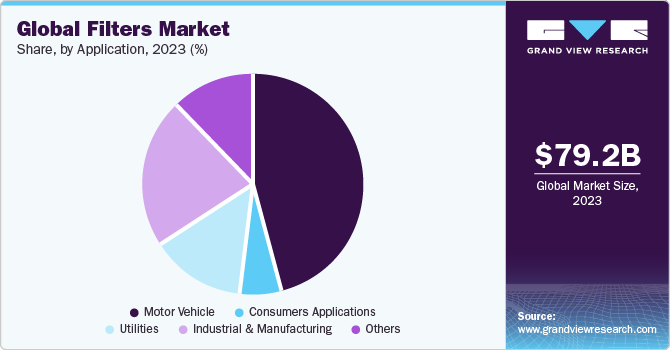
The motor vehicles segment led the market in 2023 and accounted for more than 46% of the global revenue share. The increasing automotive production, primarily in countries such as China, Indonesia, South Korea, Japan, Malaysia, and Taiwan, supports the segment growth. In addition, stringent regulations for the reduction of automotive pollution levels by agencies, such as the U.S. EPA and the Department of Energy, are expected to increase the usage of filters, thus driving the product demand in motor vehicle applications. The usage of filtration equipment in several consumer goods, such as water filters, air purifiers, and air conditioners, is expected to drive the growth of the market over the coming years.
Global Filters market share and size, 2023

The manufacturing of portable air purifiers by several companies, such as Dyson and Philips, is expected to drive the consumer goods segment. The demand for filters in the industrial & manufacturing segment is expected to be driven by the well-established industrial setup in Europe and North America coupled with stringent regulations in these regions regarding emission from these facilities. Moreover, rapid industrialization in developing countries, such as India, South Africa, Brazil, Thailand, and Indonesia, is expected to drive the market. Other major application industries include pharmaceutical manufacturing and wine production. Microfiltration equipment is widely used in wine industries for the removal of contaminants, such as bacteria, particulates, crystals, and yeasts, to improve the quality of wine and provide stabilization.

Regional Insights

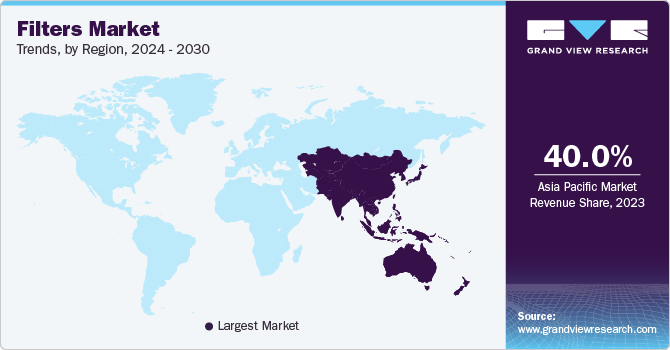
Asia Pacific dominated the market in 2023 and accounted for over 44% share of the global revenue in 2020 owing to the rapid industrialization coupled with stringent regulations by local governments to maintain the environmental quality. Increasing atmospheric pollution levels and growing environmental concerns are anticipated to promote the usage of air filtration and water filtration processes, thereby propelling market growth. The product demand in Europe is driven by the rising adoption of air filtration equipment in several industries, such as cement, chemicals, and metallurgy, to lower their emission levels, as per the directives laid down by several agencies, such as the International Plant Protection Convention (IPPC) by the European Commission.
Filters Market Trends, by Region, 2024 - 2030

North America is expected to grow at a steady CAGR from 2024 to 2030 due to the high automobile production levels as a result of the presence of major manufacturers, such as Ford, General Motors, and BMW. In addition, technological advancements, such as the implementation of nanotechnology in the filtration process are anticipated to boost the product demand in the region.

Key Companies & Market Share Insights

Prominent players operating in the filters market are aiming to invest in R&D to enhance the performance of filters they offer and to introduce new filtration technologies in the market. These industrial filtration companies hold a product line that caters to a wide range of industries including automobile, healthcare, industrial, and wastewater treatment to increase the production efficiency and maintain environmental safety. Major players in the market include the 3M Company, Donaldson Company, Inc., Parker Hannifin Corporation, and Freudenberg Filtration Technologies SE & Co. KG and others.

  • In May 2023, 3M collaborated with Svante Technologies for the development of a material to trap and permanently remove carbon dioxide in the atmosphere. 3M’s venture capital division had participated in the Series E fundraising round of Svante earlier to accelerate its carbon capture and removal technology manufacturing. Svante has developed a process to coat solid sorbents onto laminate sheets and stacking into high-performance filters for both direct air capture and industrial point-source capture.

  • In February 2023, Camfil launched its CamPure 8 media in the U.S. for the efficient removal of gaseous contaminants and odors, including sulfur dioxide, hydrogen sulfide, formaldehyde, and ethylene. The molecular filtration media can be utilized extensively in industries such as pulp & paper, oil & gas, wastewater treatment, and mining & metal refining, while also preserving fruits, flowers, and vegetables by removing odors and contaminants.

Key Filters Companies:

  • Sika AG
  • USG Corporation
  • Duraamen Engineered Products, Inc.
  • Durabond Products Limited
  • Larsen Building Products
  • TCC Materials
  • MYK Shomburg
  • Harricrete Ltd
  • Koster Bauchemie AG
  • Laticrete International, Inc.
  • CTS Cement
  • Dayton Superior Corporation
  • W.R. Meadows, Inc.

Filters Market Report Scope

Report Attribute

Details

Market size value in 2024

USD 83.23 billion

Revenue forecast in 2030

USD 112.87 million

Growth Rate

CAGR of 5.2% from 2024 to 2030

Historical data

2018 - 2023

Forecast period

2024 - 2030

Quantitative units

Revenue in USD million and CAGR from 2024 to 2030

Report coverage

Revenue forecast, company ranking, competitive landscape, growth factors, and trends

Segments covered

Product, application, region

Regional scope

North America, Europe, Asia Pacific, Central & South America, MEA

Country scope

U.S., Canada, Mexico, China, India, Japan, Malaysia, Thailand, Australia, Germany, UK, France, Spain, Italy, South Africa, Egypt, Saudi Arabia, Brazil

Key companies profiled

3M; Airex Filter Corp.; Koch Filter; Freudenberg Filtration Technologies SE & Co. KG; Donaldson Company, Inc.; Camfil AB; Parker Hannifin Corp.; DENSO Corp.; Clark Air Systems; Spectrum Filtration Pvt. Ltd.

Customization scope

Free report customization (equivalent up to 8 analysts working days) with purchase. Addition or alteration to country, regional & segment scope.

Pricing and purchase options

Avail customized purchase options to meet your exact research needs. Explore purchase options


Global Filters Market Report Segmentation

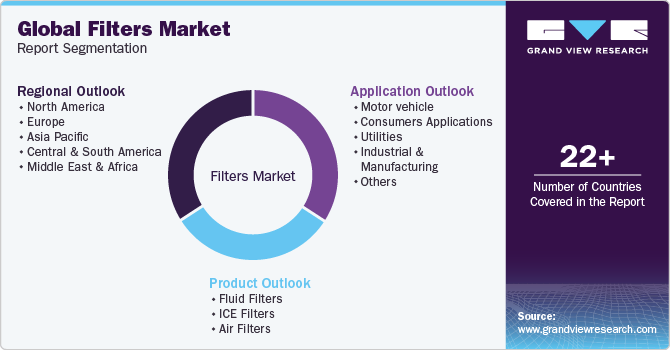
This report forecasts revenue growth at global, regional, and country levels and provides an analysis of the latest industry trends in each of the sub-segments from 2018 to 2030. For this study, Grand View Research has segmented the global filters market report based on product, application, and region.
Global Filters Market Report Segmentation

  • Product Outlook (Revenue, USD Million, 2018 - 2030)

    • Fluid Filters

    • ICE Filters

    • Air Filters

  • Application Outlook (Revenue, USD Million, 2018 - 2030)

    • Motor vehicle

    • Consumers applications

    • Utilities

    • Industrial & Manufacturing

    • Others

  • Regional Outlook (Revenue, USD Billion, 2018 - 2030)

    • North America

      • U.S.

      • Canada

      • Mexico

    • Europe

      • Germany

      • UK

      • France

      • Italy

      • Spain

    • Asia Pacific

      • China

      • Japan

      • India

      • Malaysia

      • Thailand

      • Australia

    • Central & South America

      • Brazil

    • Middle East and Africa (MEA)

      • Saudi Arabia

      • South Africa

      • Egypt

Frequently Asked Questions About This Report

Table of Contents

Chapter 1. Filters Market: Methodology and Scope
                   1.1. Market Segmentation & Scope
                   1.2. Market Definition
                   1.3. Information Procurement
                       1.3.1. Purchased Database
                       1.3.2. GVR’s Internal Database
                       1.3.3. Secondary Sources & Third-Party Perspectives
                       1.3.4. Primary Research
                   1.4. Information Analysis
                       1.4.1. Data Analysis Models
                   1.5. Market Formulation & Data Visualization
                   1.6. Data Validation & Publishing
Chapter 2. Filters Market: Executive Summary
                   2.1. Market Snapshot
                   2.2. Segment Snapshot
                   2.3. Competitive Landscape Snapshot
Chapter 3. Filters Market: Variables, Trends & Scope
                   3.1. Market Lineage Outlook
                       3.1.1. Parent Market Outlook
                       3.1.2. Related Market Outlook
                   3.2. Industry Value Chain Analysis
                       3.2.1. Distribution Channel Analysis
                       3.2.2. Raw Material Trends
                       3.2.3. Technological Overview
                   3.3. Regulatory Framework
                   3.4. Technology Framework
                   3.5. Market Dynamics
                       3.5.1. Market Driver Analysis
                       3.5.2. Market Restraint Analysis
                       3.5.3. Industry Challenges
                       3.5.4. Industry Opportunities
                   3.6. Industry Analysis Tools
                       3.6.1. Porter’s Five Forces Analysis
                       3.6.2. Macro-environmental Analysis
Chapter 4. Filters Market: Product Estimates & Trend Analysis
                   4.1. System Type Movement Analysis & Market Share, 2023 & 2030
                   4.2. Filters Market Estimates & Forecast, By Product, 2018 to 2030 (USD Million)
                   4.3. Fluid Filters
                       4.3.1. Market Revenue Estimates and Forecasts, 2018 - 2030 (USD Million)
                   4.4. ICE Filters
                       4.4.1. Market Revenue Estimates and Forecasts, 2018 - 2030 (USD Million)
                   4.5. Air Filters
                       4.5.1. Market Revenue Estimates and Forecasts, 2018 - 2030 (USD Million)
Chapter 5. Filters Market: Application Estimates & Trend Analysis
                   5.1. End-use Movement Analysis & Market Share, 2023 & 2030
                   5.2. Filters Market Estimates & Forecast, By Application, 2018 to 2030 (USD Million)
                   5.3. Motor Vehicle
                       5.3.1. Market Revenue Estimates and Forecasts, 2018 - 2030 (USD Million)
                   5.4. Consumers Goods
                       5.4.1. Market Revenue Estimates and Forecasts, 2018 - 2030 (USD Million)
                   5.5. Utilities
                       5.5.1. Market Revenue Estimates and Forecasts, 2018 - 2030 (USD Million)
                   5.6. Industrial & Manufacturing
                       5.6.1. Market Revenue Estimates and Forecasts, 2018 - 2030 (USD Million)
                   5.7. Others
                       5.7.1. Market Revenue Estimates and Forecasts, 2018 - 2030 (USD Million)
Chapter 6. Filters Market: Regional Estimates & Trend Analysis
                   6.1. Regional Movement Analysis & Market Share, 2023 & 2030
                   6.2. North America
                       6.2.1. North America filters market estimates & forecast, 2018 - 2030, (USD Million)
                       6.2.2. North America filters market estimates & forecast, by product, 2018 - 2030, (USD Million)
                       6.2.3. North America filters market estimates & forecast, by application, 2018 - 2030, (USD Million)
                       6.2.4. U.S.
                           6.2.4.1. U.S. filters market estimates & forecast, 2018 - 2030, (USD Million)
                           6.2.4.2. U.S. filters market estimates & forecast, by product, 2018 - 2030, (USD Million)
                           6.2.4.3. U.S. filters market estimates & forecast, by application, 2018 - 2030, (USD Million)
                       6.2.5. Canada
                           6.2.5.1. Canada filters market estimates & forecast, 2018 - 2030, (USD Million)
                           6.2.5.2. Canada filters market estimates & forecast, by product, 2018 - 2030, (USD Million)
                           6.2.5.3. Canada filters market estimates & forecast, by application, 2018 - 2030, (USD Million)
                       6.2.6. Mexico
                           6.2.6.1. Mexico filters market estimates & forecast, 2018 - 2030, (USD Million)
                           6.2.6.2. Mexico filters market estimates & forecast, by product, 2018 - 2030, (USD Million)
                           6.2.6.3. Mexico filters market estimates & forecast, by application, 2018 - 2030, (USD Million)
                   6.3. Europe
                       6.3.1. Europe filters market estimates & forecast, 2018 - 2030, (USD Million)
                       6.3.2. Europe filters market estimates & forecast, by product, 2018 - 2030, (USD Million)
                       6.3.3. Europe filters market estimates & forecast, by application, 2018 - 2030, (USD Million)
                       6.3.4. Germany
                           6.3.4.1. Germany filters market estimates & forecast, 2018 - 2030, (USD Million)
                           6.3.4.2. Germany filters market estimates & forecast, by product, 2018 - 2030, (USD Million)
                           6.3.4.3. Germany filters market estimates & forecast, by application, 2018 - 2030, (USD Million)
                       6.3.5. UK
                           6.3.5.1. UK filters market estimates & forecast, 2018 - 2030, (USD Million)
                           6.3.5.2. UK filters market estimates & forecast, by product, 2018 - 2030, (USD Million)
                           6.3.5.3. UK filters market estimates & forecast, by application, 2018 - 2030, (USD Million)
                       6.3.6. France
                           6.3.6.1. France filters market estimates & forecast, 2018 - 2030, (USD Million)
                           6.3.6.2. France filters market estimates & forecast, by product, 2018 - 2030, (USD Million)
                           6.3.6.3. France filters market estimates & forecast, by application, 2018 - 2030, (USD Million)
                       6.3.7. Spain
                           6.3.7.1. Spain filters market estimates & forecast, 2018 - 2030, (USD Million)
                           6.3.7.2. Spain filters market estimates & forecast, by product, 2018 - 2030, (USD Million)
                           6.3.7.3. Spain filters market estimates & forecast, by application, 2018 - 2030, (USD Million)
                       6.3.8. Italy
                           6.3.8.1. Italy filters market estimates & forecast, 2018 - 2030, (USD Million)
                           6.3.8.2. Italy filters market estimates & forecast, by product, 2018 - 2030, (USD Million)
                           6.3.8.3. Italy filters market estimates & forecast, by application, 2018 - 2030, (USD Million)
                   6.4. Asia Pacific
                       6.4.1. Asia Pacific filters market estimates & forecast, 2018 - 2030, (USD Million)
                       6.4.2. Asia Pacific filters market estimates & forecast, by product, 2018 - 2030, (USD Million)
                       6.4.3. Asia Pacific filters market estimates & forecast, by application, 2018 - 2030, (USD Million)
                       6.4.4. China
                           6.4.4.1. China filters market estimates & forecast, 2018 - 2030, (USD Million)
                           6.4.4.2. China filters market estimates & forecast, by product, 2018 - 2030, (USD Million)
                           6.4.4.3. China filters market estimates & forecast, by application, 2018 - 2030, (USD Million)
                       6.4.5. Japan
                           6.4.5.1. Japan filters market estimates & forecast, 2018 - 2030, (USD Million)
                           6.4.5.2. Japan filters market estimates & forecast, by product, 2018 - 2030, (USD Million)
                           6.4.5.3. Japan filters market estimates & forecast, by application, 2018 - 2030, (USD Million)
                       6.4.6. India
                           6.4.6.1. India filters market estimates & forecast, 2018 - 2030, (USD Million)
                           6.4.6.2. India filters market estimates & forecast, by product, 2018 - 2030, (USD Million)
                           6.4.6.3. India filters market estimates & forecast, by application, 2018 - 2030, (USD Million)
                       6.4.7. Malaysia
                           6.4.7.1. Malaysia filters market estimates & forecast, 2018 - 2030, (USD Million)
                           6.4.7.2. Malaysia filters market estimates & forecast, by product, 2018 - 2030, (USD Million)
                           6.4.7.3. Malaysia filters market estimates & forecast, by application, 2018 - 2030, (USD Million)
                       6.4.8. Australia
                           6.4.8.1. Australia filters market estimates & forecast, 2018 - 2030, (USD Million)
                           6.4.8.2. Australia filters market estimates & forecast, by product, 2018 - 2030, (USD Million)
                           6.4.8.3. Australia filters market estimates & forecast, by application, 2018 - 2030, (USD Million)
                       6.4.9. Thailand
                           6.4.9.1. Thailand filters market estimates & forecast, 2018 - 2030, (USD Million)
                           6.4.9.2. Thailand filters market estimates & forecast, by product, 2018 - 2030, (USD Million)
                           6.4.9.3. Thailand filters market estimates & forecast, by application, 2018 - 2030, (USD Million)
                   6.5. Central & South America
                       6.5.1. Central & South America filters market estimates & forecast, 2018 - 2030, (USD Million)
                       6.5.2. Central & South America filters market estimates & forecast, by product, 2018 - 2030, (USD Million)
                       6.5.3. Central & South America filters market estimates & forecast, by application, 2018 - 2030, (USD Million)
                       6.5.4. Brazil
                           6.5.4.1. Brazil filters market estimates & forecast, 2018 - 2030, (USD Million)
                           6.5.4.2. Brazil filters market estimates & forecast, by product, 2018 - 2030, (USD Million)
                           6.5.4.3. Brazil filters market estimates & forecast, by application, 2018 - 2030, (USD Million)
                   6.6. Middle East & Africa
                       6.6.1. Middle East & Africa filters market estimates & forecast, 2018 - 2030, (USD Million)
                       6.6.2. Middle East & Africa filters market estimates & forecast, by product, 2018 - 2030, (USD Million)
                       6.6.3. Middle East & Africa filters market estimates & forecast, by application, 2018 - 2030, (USD Million)
                       6.6.4. Saudi Arabia
                           6.6.4.1. Saudi Arabia filters market estimates & forecast, 2018 - 2030, (USD Million)
                           6.6.4.2. Saudi Arabia filters market estimates & forecast, by product, 2018 - 2030, (USD Million)
                           6.6.4.3. Saudi Arabia filters market estimates & forecast, by application, 2018 - 2030, (USD Million)
                       6.6.5. South Africa
                           6.6.5.1. South Africa filters market estimates & forecast, 2018 - 2030, (USD Million)
                           6.6.5.2. South Africa filters market estimates & forecast, by product, 2018 - 2030, (USD Million)
                           6.6.5.3. South Africa filters market estimates & forecast, by application, 2018 - 2030, (USD Million)
                       6.6.6. Egypt
                           6.6.6.1. Egypt filters market estimates & forecast, 2018 - 2030, (USD Million)
                           6.6.6.2. Egypt filters market estimates & forecast, by product, 2018 - 2030, (USD Million)
                           6.6.6.3. Egypt filters market estimates & forecast, by application, 2018 - 2030, (USD Million)
Chapter 7. Filters Market - Competitive Landscape
                   7.1. Recent Developments & Impact Analysis, By Key Market Participants
                   7.2. Company Categorization
                   7.3. Company Heat Map Analysis
                   7.4. Strategy Mapping
                       7.4.1. Expansion
                       7.4.2. Mergers & Acquisition
                       7.4.3. Partnerships & Collaborations
                       7.4.4. New Product Launches
                       7.4.5. Research And Development
                   7.5. Company Profiles
                       7.5.1. 3M Company
                           7.5.1.1. Participant’s overview
                           7.5.1.2. Financial performance
                           7.5.1.3. Product benchmarking
                           7.5.1.4. Recent developments
                       7.5.2. Airex Filter Corporation
                           7.5.2.1. Participant’s overview
                           7.5.2.2. Financial performance
                           7.5.2.3. Product benchmarking
                           7.5.2.4. Recent developments
                       7.5.3. Freudenberg Filtration Technologies SE & Co. KG
                           7.5.3.1. Participant’s overview
                           7.5.3.2. Financial performance
                           7.5.3.3. Product benchmarking
                           7.5.3.4. Recent developments
                       7.5.4. Donaldson Company, Inc.
                           7.5.4.1. Participant’s overview
                           7.5.4.2. Financial performance
                           7.5.4.3. Product benchmarking
                           7.5.4.4. Recent developments
                       7.5.5. Koch Filter
                           7.5.5.1. Participant’s overview
                           7.5.5.2. Financial performance
                           7.5.5.3. Product benchmarking
                           7.5.5.4. Recent developments
                       7.5.6. Camfil AB
                           7.5.6.1. Participant’s overview
                           7.5.6.2. Financial performance
                           7.5.6.3. Product benchmarking
                           7.5.6.4. Recent developments
                       7.5.7. Parker Hannifin Corporation.
                           7.5.7.1. Participant’s overview
                           7.5.7.2. Financial performance
                           7.5.7.3. Product benchmarking
                           7.5.7.4. Recent developments
                       7.5.8. DENSO Corporation
                           7.5.8.1. Participant’s overview
                           7.5.8.2. Financial performance
                           7.5.8.3. Product benchmarking
                           7.5.8.4. Recent developments
                       7.5.9. Clark Air Systems
                           7.5.9.1. Participant’s overview
                           7.5.9.2. Financial performance
                           7.5.9.3. Product benchmarking
                           7.5.9.4. Recent developments
                       7.5.10. Spectrum Filtration Pvt. Ltd
                           7.5.10.1. Participant’s overview
                           7.5.10.2. Financial performance
                           7.5.10.3. Product benchmarking
                           7.5.10.4. Recent developments


List of Tables

Table 1. Fluid filters market estimates and forecasts, 2018 - 2030 (USD Million)
Table 2. ICE filters market estimates and forecasts, 2018 - 2030 (USD Million)
Table 3. Air filters market estimates and forecasts, 2018 - 2030 (USD Million)
Table 4. Filters market estimates and forecasts, in motor vehicles, 2018 - 2030 (USD Million)
Table 5. Filters market estimates and forecasts, in consumer goods, 2018 - 2030 (USD Million)
Table 6. Filters market estimates and forecasts, in utilities, 2018 - 2030 (USD Million)
Table 7. Filters market estimates and forecasts, in industrial and manufacturing, 2018 - 2030 (USD Million)
Table 8. Filters market estimates and forecasts, in other applications, 2018 - 2030 (USD Million)
Table 9. North America filters market estimates and forecasts, 2018 - 2030 (USD Million)
Table 10. North America filters market estimates and forecasts, by product, 2018 - 2030 (USD Million)
Table 11. North America filters market estimates and forecasts, by application, 2018 - 2030 (USD Million)
Table 12. U.S. filters market estimates and forecasts, 2018 - 2030 (USD Million)
Table 13. U.S. filters market estimates and forecasts, by product, 2018 - 2030 (USD Million)
Table 14. U.S. filters market estimates and forecasts, by application, 2018 - 2030 (USD Million)
Table 15. Canada filters market estimates and forecasts, 2018 - 2030 (USD Million)
Table 16. Canada filters market estimates and forecasts, by product, 2018 - 2030 (USD Million)
Table 17. Canada filters market estimates and forecasts, by application, 2018 - 2030 (USD Million)
Table 18. Mexico filters market estimates and forecasts, 2018 - 2030 (USD Million)
Table 19. Mexico filters market estimates and forecasts, by product, 2018 - 2030 (USD Million)
Table 20. Mexico filters market estimates and forecasts, by application, 2018 - 2030 (USD Million)
Table 21. Europe filters market estimates and forecasts, 2018 - 2030 (USD Million)
Table 22. Europe filters market estimates and forecasts, by product, 2018 - 2030 (USD Million)
Table 23. Europe filters market estimates and forecasts, by application, 2018 - 2030 (USD Million)
Table 24. Germany filters market estimates and forecasts, 2018 - 2030 (USD Million)
Table 25. Germany filters market estimates and forecasts, by product, 2018 - 2030 (USD Million)
Table 26. Germany filters market estimates and forecasts, by application, 2018 - 2030 (USD Million)
Table 27. U.K. filters market estimates and forecasts, 2018 - 2030 (USD Million)
Table 28. U.K. filters market estimates and forecasts, by product, 2018 - 2030 (USD Million)
Table 29. U.K. filters market estimates and forecasts, by application, 2018 - 2030 (USD Million)
Table 30. France filters market estimates and forecasts, 2018 - 2030 (USD Million)
Table 31. France filters market estimates and forecasts, by product, 2018 - 2030 (USD Million)
Table 32. France filters market estimates and forecasts, by application, 2018 - 2030 (USD Million)
Table 33. Italy filters market estimates and forecasts, 2018 - 2030 (USD Million)
Table 34. Italy filters market estimates and forecasts, by product, 2018 - 2030 (USD Million)
Table 35. Italy filters market estimates and forecasts, by application, 2018 - 2030 (USD Million)
Table 36. Spain filters market estimates and forecasts, 2018 - 2030 (USD Million)
Table 37. Spain filters market estimates and forecasts, by product, 2018 - 2030 (USD Million)
Table 38. Spain filters market estimates and forecasts, by application, 2018 - 2030 (USD Million)
Table 39. Asia Pacific filters market estimates and forecasts, 2018 - 2030 (USD Million)
Table 40. Asia Pacific filters market estimates and forecasts, by product, 2018 - 2030 (USD Million)
Table 41. Asia Pacific filters market estimates and forecasts, by application, 2018 - 2030 (USD Million)
Table 42. China filters market estimates and forecasts, 2018 - 2030 (USD Million)
Table 43. China filters market estimates and forecasts, by product, 2018 - 2030 (USD Million)
Table 44. China filters market estimates and forecasts, by application, 2018 - 2030 (USD Million)
Table 45. India filters market estimates and forecasts, 2018 - 2030 (USD Million)
Table 46. India filters market estimates and forecasts, by product, 2018 - 2030 (USD Million)
Table 47. India filters market estimates and forecasts, by application, 2018 - 2030 (USD Million)
Table 48. Japan filters market estimates and forecasts, 2018 - 2030 (USD Million)
Table 49. Japan filters market estimates and forecasts, by product, 2018 - 2030 (USD Million)
Table 50. Japan filters market estimates and forecasts, by application, 2018 - 2030 (USD Million)
Table 51. Australia filters market estimates and forecasts, 2018 - 2030 (USD Million)
Table 52. Australia filters market estimates and forecasts, by product, 2018 - 2030 (USD Million)
Table 53. Australia filters market estimates and forecasts, by application, 2018 - 2030 (USD Million)
Table 54. Malaysia filters market estimates and forecasts, 2018 - 2030 (USD Million)
Table 55. Malaysia filters market estimates and forecasts, by product, 2018 - 2030 (USD Million)
Table 56. Malaysia filters market estimates and forecasts, by application, 2018 - 2030 (USD Million)
Table 57. Thailand filters market estimates and forecasts, 2018 - 2030 (USD Million)
Table 58. Thailand filters market estimates and forecasts, by product, 2018 - 2030 (USD Million)
Table 59. Thailand filters market estimates and forecasts, by application, 2018 - 2030 (USD Million)
Table 60. Central & South America filters market estimates and forecasts, 2018 - 2030 (USD Million)
Table 61. Central & South America filters market estimates and forecasts, by product, 2018 - 2030 (USD Million)
Table 62. Central & South America filters market estimates and forecasts, by application, 2018 - 2030 (USD Million)
Table 63. Brazil filters market estimates and forecasts, 2018 - 2030 (USD Million)
Table 64. Brazil filters market estimates and forecasts, by product, 2018 - 2030 (USD Million)
Table 65. Brazil filters market estimates and forecasts, by application, 2018 - 2030 (USD Million)
Table 66. Middle East & Africa filters market estimates and forecasts, 2018 - 2030 (USD Million)
Table 67. Middle East & Africa filters market estimates and forecasts, by product, 2018 - 2030 (USD Million)
Table 68. Middle East & Africa filters market estimates and forecasts, by application, 2018 - 2030 (USD Million)
Table 69. South Africa filters market estimates and forecasts, 2018 - 2030 (USD Million)
Table 70. South Africa filters market estimates and forecasts, by product, 2018 - 2030 (USD Million)
Table 71. South Africa filters market estimates and forecasts, by application, 2018 - 2030 (USD Million)
Table 72. Saudi Arabia filters market estimates and forecasts, 2018 - 2030 (USD Million)
Table 73. Saudi Arabia filters market estimates and forecasts, by product, 2018 - 2030 (USD Million)
Table 74. Saudi Arabia filters market estimates and forecasts, by application, 2018 - 2030 (USD Million)
Table 75. Egypt filters market estimates and forecasts, 2018 - 2030 (USD Million)
Table 76. Egypt filters market estimates and forecasts, by product, 2018 - 2030 (USD Million)
Table 77. Egypt filters market estimates and forecasts, by application, 2018 - 2030 (USD Million)


List of Figures

Fig. 1. Filters market segmentation
Fig. 2. Information Procurement
Fig. 3. Primary Research Pattern
Fig. 4. Primary Research Process
Fig. 5. Market research approaches - Bottom Up Approach
Fig. 6. Market research approaches - Top Down Approach
Fig. 7. Market research approaches - Combined Approach
Fig. 8. Filters market: Penetration & growth prospect mapping
Fig. 9. Filters market: Value chain analysis
Fig. 10. Market dynamics
Fig. 11. Filters market driver impact analysis
Fig. 12. Global automobile demand, 2010 - 2018 (Million Units)
Fig. 13. Filters market restraint impact
Fig. 14. Key opportunities - prioritized
Fig. 15. Filters market: Product movement analysis, 2021 & 2030
Fig. 16. Filters market: Application movement analysis, 2021 & 2030
Fig. 17. Filters market: Key company/ competition categorization
Fig. 18. Filters market: Strategic framework

What questions do you have? Get quick response from our industry experts. Request a Free Consultation

Market Segmentation

  • Filters Product Outlook (Revenue, USD Million, 2018 - 2030)
    • Fluid Filters
    • ICE Filters
    • Air Filters
  • Filters Application Outlook (Revenue, USD Million, 2018 - 2030)
    • Motor Vehicle
    • Consumers Goods
    • Utilities
    • Industrial & Manufacturing
    • Others
  • Filters Regional Outlook (Revenue, USD Million, 2018 - 2030)
    • North America
      • North America Filters Market, By Product
        • Fluid Filters
        • ICE Filters
        • Air Filters
      • North America Filters Market, By Application
        • Motor Vehicle
        • Consumers Goods
        • Utilities
        • Industrial & Manufacturing
        • Others
      • U.S.
        • U.S. Filters Market, By Product
          • Fluid Filters
          • ICE Filters
          • Air Filters
        • U.S. Filters Market, By Application
          • Motor Vehicle
          • Consumers Goods
          • Utilities
          • Industrial & Manufacturing
          • Others
      • Canada
        • Canada Filters Market, By Product
          • Fluid Filters
          • ICE Filters
          • Air Filters
        • Canada Filters Market, By Application
          • Motor Vehicle
          • Consumers Goods
          • Utilities
          • Industrial & Manufacturing
          • Others
      • Mexico
        • Mexico Filters Market, By Product
          • Fluid Filters
          • ICE Filters
          • Air Filters
        • Mexico Filters Market, By Application
          • Motor Vehicle
          • Consumers Goods
          • Utilities
          • Industrial & Manufacturing
          • Others
    • Europe
      • Europe Filters Market, By Product
        • Fluid Filters
        • ICE Filters
        • Air Filters
      • Europe Filters Market, By Application
        • Motor Vehicle
        • Consumers Goods
        • Utilities
        • Industrial & Manufacturing
        • Others
      • Germany
        • Germany Filters Market, By Product
          • Fluid Filters
          • ICE Filters
          • Air Filters
        • Germany Filters Market, By Application
          • Motor Vehicle
          • Consumers Goods
          • Utilities
          • Industrial & Manufacturing
          • Others
      • UK
        • UK Filters Market, By Product
          • Fluid Filters
          • ICE Filters
          • Air Filters
        • UK Filters Market, By Application
          • Motor Vehicle
          • Consumers Goods
          • Utilities
          • Industrial & Manufacturing
          •  Others
      • France
        • France Filters Market, By Product
          • Fluid Filters
          • ICE Filters
          • Air Filters
        • France Filters Market, By Application
          • Motor Vehicle
          • Consumers Goods
          • Utilities
          • Industrial & Manufacturing
          • Others
      • Italy
        • Italy Filters Market, By Product
          • Fluid Filters
          • ICE Filters
          • Air Filters
        • Italy Filters Market, By Application
          • Motor Vehicle
          • Consumers Goods
          • Utilities
          • Industrial & Manufacturing
          • Others
        • Spain
          • Spain Filters Market, By Product
            • Fluid Filters
            • ICE Filters
            • Air Filters
          • Spain Filters Market, By Application
            • Motor Vehicle
            • Consumers Goods
            • Utilities
            • Industrial & Manufacturing
            • Others
    • Asia Pacific
      • Asia Pacific Filters Market, By Product
        • Fluid Filters
        • ICE Filters
        • Air Filters
      • Asia Pacific Filters Market, By Application
        • Motor Vehicle
        • Consumers Goods
        • Utilities
        • Industrial & Manufacturing
        • Others
      • China
        • China Filters Market, By Product
          • Fluid Filters
          • ICE Filters
          • Air Filters
        • China Filters Market, By Application
          • Motor Vehicle
          • Consumers Goods
          • Utilities
          • Industrial & Manufacturing
          • Others
      • India
        • India Filters Market, By Product
          • Fluid Filters
          • ICE Filters
          • Air Filters
        • India Filters Market, By Application
          • Motor Vehicle
          • Consumers Goods
          • Utilities
          • Industrial & Manufacturing
          • Others
      • Japan
        • Japan Filters Market, By Product
          • Fluid Filters
          • ICE Filters
          • Air Filters
        • Japan Filters Market, By Application
          • Motor Vehicle
          • Consumers Goods
          • Utilities
          • Industrial & Manufacturing
          • Others
      • Australia
        • Australia Filters Market, By Product
          • Fluid Filters
          • ICE Filters
          • Air Filters
        • Australia Filters Market, By Application
          • Motor Vehicle
          • Consumers Goods
          • Utilities
          • Industrial & Manufacturing
          • Others
      • Thailand
        • Thailand Filters Market, By Product
          • Fluid Filters
          • ICE Filters
          • Air Filters
        • Thailand Filters Market, By Application
          • Motor Vehicle
          • Consumers Goods
          • Utilities
          • Industrial & Manufacturing
          • Others
      • Malaysia
        • Malaysia Filters Market, By Product
          • Fluid Filters
          • ICE Filters
          • Air Filters
        • Malaysia Filters Market, By Application
          • Motor Vehicle
          • Consumers Goods
          • Utilities
          • Industrial & Manufacturing
          • Others
    • Central & South America
      • Central & South America Filters Market, By Product
        • Fluid Filters
        • ICE Filters
        • Air Filters
      • Central & South America Filters Market, By Application
        • Motor Vehicle
        • Consumers Goods
        • Utilities
        • Industrial & Manufacturing
        • Others
      • Brazil
        • Brazil Filters Market, By Product
          • Fluid Filters
          • ICE Filters
          • Air Filters
        • Brazil Filters Market, By Application
          • Motor Vehicle
          • Consumers Goods
          • Utilities
          • Industrial & Manufacturing
          • Others
    • Middle East & Africa
      • Middle East & Africa Filters Market, By Product
        • Fluid Filters
        • ICE Filters
        • Air Filters
      • Middle East & Africa Filters Market, By Application
        • Motor Vehicle
        • Consumers Goods
        • Utilities
        • Industrial & Manufacturing
        • Others
      • Saudi Arabia
        • Saudi Arabia Filters Market, By Product
          • Fluid Filters
          • ICE Filters
          • Air Filters
        • Saudi Arabia Filters Market, By Application
          • Motor Vehicle
          • Consumers Goods
          • Utilities
          • Industrial & Manufacturing
          • Others
      • South Africa
        • South Africa Filters Market, By Product
          • Fluid Filters
          • ICE Filters
          • Air Filters
        • South Africa Filters Market, By Application
          • Motor Vehicle
          • Consumers Goods
          • Utilities
          • Industrial & Manufacturing
          • Others
      • Egypt
        • Egypt Filters Market, By Product
          • Fluid Filters
          • ICE Filters
          • Air Filters
        • Egypt Filters Market, By Application
          • Motor Vehicle
          • Consumers Goods
          • Utilities
          • Industrial & Manufacturing
          • Others

Filters Market Dynamics

Drivers: Need For Filtration In Automobiles

The filter industry heavily relies on the automobile sector as a significant end-use market. The demand for automobiles has shown rapid growth from 2010 to 2019, and this trend is expected to continue at a moderate pace due to increased demand for passenger vehicles. Filters are used for applications such as oil intake, cabin air filtration, and emission filtration in the automotive industry. A rise in the demand for passenger cars and light commercial vehicles in Asia Pacific, the Middle East & Africa, and Latin America is expected to fuel the demand for automobiles over the forecast period, which, in turn, is likely to support market growth. Economies such as China, India, Brazil, and South Africa will lead their respective regional markets over the forecast period. The automobile industry is projected to grow slightly in developed regions such as North America and Europe.

Growing Demand For Water Treatment Processes

Water treatment processes have recently witnessed a brisk rise in demand, which can be attributed to several factors. One of the primary reasons for the increase in demand is the scarcity of quality drinking water. Growing population accelerated depletion of water resources, and contamination of ground and surface water bodies have further encouraged the adoption of water treatment processes. Water supplied to households by municipal corporations is not subjected to heavy treatment due to financial infeasibility, capacity crunch, and inability to perform high-intensity water filtration. Such a trend is more prevalent in developing regions such as the Asia Pacific and Central & South America. These regions have witnessed rapid growth in their population accompanied by rapid industrialization in the recent past and are likely to see similar trends in the near future as well. A shortage of pure water is expected to result in high demand for water filters and filtration systems. Water filters help purify water from physical and hazardous contaminants. Chemicals such as benzene, chlorobenzenes, trichloroethylene, carbon tetrachloride, methylene chloride, and vinyl chloride in drinking water pose health-related risks if they are present above the minimum critical barrier as specified by the EPA and Health Advisory Level (HAL).

Restraints: Exposure To Nanoparticles

Rising demand for clean water treatment has led to the usage of nano filters and membranes using nano metal oxides. Various organizations are currently studying the effect of exposure to nanometal oxides on humans and other species. Nanoparticles, such as metal oxides, are considered harmful to aquatic and terrestrial organisms. According to a study by the Department of Environmental Toxicology, nano sized ZnO and TiO2 caused reproductive effects in earthworms in artificial soil when exposed for a period of four weeks. Generally, nano-sized ZnO exhibited more toxicity than nano-sized TiO2 in Eisenia fetida. The main limitation of the use of nanoparticles in water treatment is the difficulty of removing the particles after completion of the treatment. The overall effect of exposure to nanoparticles is yet to be understood. This restraint is expected to be subdued over the forecast period with the help of more information and precautions by companies.

What Does This Report Include?

This section will provide insights into the contents included in this filters market report and help gain clarity on the structure of the report to assist readers in navigating smoothly.

Filters market qualitative analysis

  • Industry overview

  • Industry trends

  • Market drivers and restraints

  • Market size

  • Growth prospects

  • Porter’s analysis

  • PESTEL analysis

  • Key market opportunities prioritized

  • Competitive landscape

    • Company overview

    • Financial performance

    • Product benchmarking

    • Latest strategic developments

Filters market quantitative analysis

  • Market size, estimates, and forecast from 2018 to 2030

  • Market estimates and forecast for product segments up to 2030

  • Regional market size and forecast for product segments up to 2030

  • Market estimates and forecast for application segments up to 2030

  • Regional market size and forecast for application segments up to 2030

  • Company financial performance

What questions do you have? Get quick response from our industry experts. Request a Free Consultation

Research Methodology

A three-pronged approach was followed for deducing the filters market estimates and forecasts. The process has three steps: information procurement, analysis, and validation. The whole process is cyclical, and steps repeat until the estimates are validated. The three steps are explained in detail below:

Information procurement: Information procurement is one of the most extensive and important stages in our research process, and quality data is critical for accurate analysis. We followed a multi-channel data collection process for filters market to gather the most reliable and current information possible.

  • We buy access to paid databases such as Hoover’s and Factiva for company financials, industry information, white papers, industry journals, SME journals, and more.
  • We tap into Grand View’s proprietary database of data points and insights from active and archived monitoring and reporting.
  • We conduct primary research with industry experts through questionnaires and one-on-one phone interviews.
  • We pull from reliable secondary sources such as white papers and government statistics, published by organizations like WHO, NGOs, World Bank, etc., Key Opinion Leaders (KoL) publications, company filings, investor documents, and more.
  • We purchase and review investor analyst reports, broker reports, academic commentary, government quotes, and wealth management publications for insightful third-party perspectives.

Analysis: We mine the data collected to establish baselines for forecasting, identify trends and opportunities, gain insight into consumer demographics and drivers, and so much more. We utilized different methods of filters market data depending on the type of information we’re trying to uncover in our research.

  • Market Research Efforts: Bottom-up Approach for estimating and forecasting demand size and opportunity, top-down Approach for new product forecasting and penetration, and combined approach of both Bottom-up and Top-down for full coverage analysis.

  • Value-Chain-Based Sizing & Forecasting: Supply-side estimates for understanding potential revenue through competitive benchmarking, forecasting, and penetration modeling.

  • Demand-side estimates for identifying parent and ancillary markets, segment modeling, and heuristic forecasting.

  • Qualitative Functional Deployment (QFD) Modelling for market share assessment.

Market formulation and validation: We mine the data collected to establish baselines for forecasting, identify trends and opportunities, gain insight into consumer demographics and drivers, and so much more. We utilize different methods of data analysis depending on the type of information we’re trying to uncover in our research.

  • Market Formulation: This step involves the finalization of market numbers. This step on an internal level is designed to manage outputs from the Data Analysis step.

  • Data Normalization: The final market estimates and forecasts are then aligned and sent to industry experts, in-panel quality control managers for validation.

  • This step also entails the finalization of the report scope and data representation pattern.

  • Validation: The process entails multiple levels of validation. All these steps run in parallel, and the study is forwarded for publishing only if all three levels render validated results.

Filters Market Categorization:

The filters market was categorized into three segments, namely product (Fluid Filters, ICE Filters, Air Filters), application (Motor vehicle, Consumers applications, Utilities, Industrial & Manufacturing), and regions (North America, Europe, Asia Pacific, Central & South America, and Middle East and Africa).

Segment Market Methodology:

The filters market was segmented into product, application, and regions. The demand at a segment level was deduced using a funnel method. Concepts like the TAM, SAM, SOM, etc., were put into practice to understand the demand. We at GVR deploy three methods to deduce market estimates and determine forecasts. These methods are explained below:

Market research approaches: Bottom-up

  • Demand estimation of each product across countries/regions summed up to from the total market.

  • Variable analysis for demand forecast.

  • Demand estimation via analyzing paid database, and company financials either via annual reports or paid database.

  • Primary interviews for data revalidation and insight collection.

Market research approaches: Top-down

  • Used extensively for new product forecasting or analyzing penetration levels.

  • Tool used invoice product flow and penetration models Use of regression multi-variant analysis for forecasting Involves extensive use of paid and public databases.

  • Primary interviews and vendor-based primary research for variable impact analysis.

Market research approaches: Combined

  • This is the most common method. We apply concepts from both the top-down and bottom-up approaches to arrive at a viable conclusion.

Regional Market Methodology:

The filters market was analyzed at a regional level. The globe was divided into North America, Europe, Asia Pacific, Central & South America, and Middle East and Africa, keeping in focus variables like consumption patterns, export-import regulations, consumer expectations, etc. These regions were further divided into eighteen countries, namely, the U.S., Canada, Mexico, China, India, Japan, Malaysia, Thailand, Australia, Germany, the UK, France, Spain, Italy, South Africa, Egypt, Saudi Arabia, Brazil.

All three above-mentioned market research methodologies were applied to arrive at regional-level conclusions. The regions were then summed up to form the global market.

Filters market companies & financials:

The filters market was analyzed via companies operating in the sector. Analyzing these companies and cross-referencing them to the demand equation helped us validate our assumptions and conclusions. Key market players analyzed include:

  • The 3M Company - The 3M Company was incorporated in 1929 and is headquartered in Minnesota, U.S. The company operates through four business segments namely safety & industrial, transportation & electronics, healthcare, and consumer. Its safety & industrial segment consists of abrasives, automotive aftermarket, closure and masking systems, communication markets, electrical markets, industrial adhesives & tapes, and personal safety products. In contrast, transportation & electronics segment consists of advanced materials, automotive and aerospace, commercial solutions, display materials and systems, electronic materials solutions, transportation, and safety products. The company's healthcare segment products include drug delivery, food safety, health information systems, medical solutions, oral care solutions, and separation & purification products, whereas consumer segment's products consist of consumer health care, home care, home improvement, and stationery and office supplies. In 2020, the company generated 50.1% of the total revenue from the Americas, 19.4% from EMEA, and 30.5% from Asia Pacific. As of 2020, it had 95,000 employees and 97 manufacturing facilities in 35 countries

  • Parker Hannifin Corporation - Parker Hannifin Corporation was founded in 1917 and is headquartered in Ohio, U.S. The company manufactures motion and control technologies and systems, providing precision engineered solutions for a wide variety of mobile, industrial, and aerospace markets. Its operations are classified into two business segments: the diversified industrial segment and the aerospace systems segment. The company's diversified industrial segment is an aggregation of several business units that manufacture motion-control and fluid power system components for packaging, processing, transportation, agriculture, construction, and defense applications. This segment is further classified into three sub-segments, namely motion systems, flow and process control, and filtration and engineered materials. Aerospace systems segment produces hydraulic, fuel, pneumatic and electro-mechanical systems, and components utilized on domestic commercial, military, and general aviation aircraft. This segment is further classified into five sub segments namely flight control & actuation, fuel & inerting, hydraulics, engines, and fluid conveyance. As of 2020, diversified industrial segment accounted for 80 % and aerospace systems segment products accounted for 20% of the total company’s sales.

  • Donaldson Company, Inc. - Donaldson Company, Inc. was founded in 1915 and is headquartered in Minnesota, U.S. The company operates through two business segments, namely engine products and industrial products. Its engine products segment manufactures the replacement filters for both air & liquid filtration applications, air filtration systems, liquid filtration systems for fuel, lube & hydraulic applications, exhaust & emissions systems. It sells the products of this segment to OEMs in the construction, mining, agriculture, aerospace, defense, and transportation end markets. The company's industrial products segment manufactures dust, fume, mist collectors, compressed air purification systems, gas and liquid filtration for food, beverage, industrial processes, air filtration systems for gas turbines, and specialized air and gas filtration systems for applications including hard disk drives and semi-conductor manufacturing and sensors, indicators, and monitoring systems. It sells the products of this segment to various dealers, distributors, OEMs, and end users. As of 2020, engine products accounted for 67%, and industrial products accounted for 33% of the company's total sales. The company operates its business across U.S., Europe, Middle East and Africa, Asia Pacific, and Latin America. The majority of company's revenue is generated from sales to customers within U.S. As of July 2020, the company had 12,400 employees worldwide.

  • Mann+Hummel - Mann+Hummel GmbH was founded in 1938 and is headquartered in Ludwigsburg, Germany. The company operates through two business segments, namely the transportation segment and the life sciences and environment segment. Its transportation business segment comprises original equipment & aftermarket business units. Through this segment, the company serves automotive industry with air filter systems, intake systems, liquid filter systems, and plastic components. Its life sciences & environment business segment is classified into air filtration and water solutions business units. Through this segment, the company manufactures filters for indoor and outdoor spaces, industrial applications, and stationary and mobile air cleaners with HEPA filters for the safe separation of viruses, bacteria, and other microorganisms. In 2020, it generated a revenue of 92% from transportation business segment and a revenue of 8% from life sciences & environment business segment.

  • Cummins Inc. - Cummins Inc. was founded in 1919 and is headquartered in Columbus, Indiana, U.S. Its operations are classified into five business segments, namely engine, distribution, components, power systems, and new power. The company's engine business segment manufactures diesel and natural gas-powered engines for automotive, construction, marine, rail, oil & gas, defense, and agricultural markets. In contrast, distribution business segment provides sales and support to a wide range of products and services including power generation systems and heavy-duty and mid-range engines designed for on- and offhighway use. The company's components business segment supplies products for engine and power systems segments, including after treatment systems, turbochargers, transmissions, filtration products, electronics, and fuel systems for commercial diesel and natural gas applications, whereas the power systems segment manufactures and sells diesel and natural gas high-speed engines, power generators, A/C generators, and alternator products. Its new power segment manufactures electrified power systems ranging from fully electric to hybrid subsystems including battery, fuel cell, and hydrogen production technologies. In 2020, the company had generated 41% of the total sales from engine business, 36% of total sales from distribution business, 31% of total sales components business, and 18% of total sales from power systems business segment. It sells its products in more than 180 countries. As of December 2020, it had 57,825 employees, and customer centers in 190 countries.

  • Sartorius AG - Sartorius AG was founded in 1870 and is headquartered in Göttingen, Germany. Its operations are classified into two business divisions, namely bioprocess solution division and lab products & services division. The company’s bioprocess solutions segment manufactures filters for sterilization of biopharmaceutical media, single-use bags for cell cultivation & storage of biopharmaceuticals, and membrane adsorbers for purification in bioprocesses, whereas the lab products and services segment provides instruments, consumables, and services for laboratories including laboratory balances, laboratory water systems for storage of purified water, electronic pipettes, filter systems for sample preparation, and membrane filter systems for sterility testing of parenteral. In 2020, the company generated 35% of the total revenue from the Americas, 40% from EMEA, and 25% from Asia Pacific, whereas bioprocess solutions division accounted for 76% and lab products & services segment accounted for 24% of total company’s sales. As of 2020, it had approximately 10,600 employees, customer centers in 190 countries, and production and sales sites in 60 countries.

  • Danaher (Pall Corporation) - Danaher (Pall Corporation) was founded in 1969 and is headquartered in Washington, D.C., U.S. It comprises more than 20 operating companies, which operate through three business segments, namely life sciences, diagnostics, and environmental & applied solutions. The company’s life sciences segment offers a broad range of instruments and consumables that are primarily used by customers to study the basic building blocks of life, including genes, proteins, metabolites, and cells, in order to understand the causes of disease, identify new therapies, and test and manufacture new drugs and vaccines, whereas diagnostics segment offers analytical instruments, reagents, consumables, software, and services that hospitals, physicians’ offices, reference laboratories, and other critical care settings use to diagnose disease and make treatment decisions. Its environmental & applied solutions segment offers products and services that help protect important resources and keep global food and water supplies safe. As of December 2020, Danaher Corporation had 69,000 employees and facilities in over 60 countries, including 239 significant administrative, sales, research and development, manufacturing, and distribution facilities. These facilities are located in the U.S. in over 20 states and outside the U.S., primarily in Europe, Asia, South America, the rest of North America, and Australia.

  • Camfil - Camfil was incorporated in 1963 and is headquartered in Stockholm, Sweden. It provides industrial and commercial systems for air filtration and air pollution control that improve equipment productivity and minimize energy use. Its operations are classified into four business segments, namely filtration solutions, air pollution control, power systems, and molecular contamination control. Filtration solutions business unit offers a wide range of high-quality, energy-efficient filters for public and commercial buildings. These products deliver clean air for high indoor air quality (IAQ), which is free from harmful pollutants, dust, dirt, allergens, radiation, molecular gases, and life-threatening viruses. Air pollution control business unit produces dust, fume, and mist collectors for industrial exhaust-air cleaning. These products are widely used in metalworking, pharmaceutical, automotive, food & beverage, and mining industries.

  • American Air Filter Company, Inc. - American Air Filter Company, Inc. was founded in 1920 and is headquartered in Louisville, Kentucky, U.S. In April 2016, American Air Filter U.S. Co. Inc. (AAF International) acquired Flanders Corp. U.S. to form AAF Flanders. It designs and manufactures filters for three business sectors, namely residential, commercial & industrial, and power & industrial sectors. The company has production, warehousing, and distribution facilities in 22 countries across 4 continents. It operates as a subsidiary of Daikin Industries, Ltd., Japan, which specializes in the manufacturing of air conditioners. The company provides innovative gas and air filtration solutions designed to remove and control airborne particulates and gaseous contaminants. Its products are used in nuclear applications, refineries, wastewater treatment, data centers, commercial buildings, microelectronics, schools & universities, pulp & paper, food & beverage facilities, engine air filtration, agriculture & tobacco, and pharmaceutical production units. The company also specializes in real-time monitoring of filters, filter testing services, air filtration audit, system cost optimization, and lab services. It has ISO class 8 certification to manufacture filters.

  • Sofegi SpA - Sofegi SpA was established in 1863 and is headquartered in Milan, Italy. It is a global supplier of original parts for automotive industry. The company designs, develops, and produces filtration systems and flexible suspension components, as well as air management and engine cooling systems. Its operations are classified into three business units, namely air and cooling business unit, filtration business unit, and suspension business unit. Air and cooling business unit manufactures high tech plastic automotive components in direct liaison with engineering offices of car engine manufacturers, whereas filtration business unit manufactures filter products including oil, petrol, diesel fuel, and air and cabin air. Its suspension business unit produces a complete range of products, including helical springs, stabilizer bars, torsion bars, stabilinks, leaf springs, and track tensioners, engineered in close collaboration with automotive manufacturers. These products are designed for use on cars, light and heavy commercial vehicles, earthmoving equipment, armored vehicles, and rolling wagons. The group is listed on the Milan Stock Exchange (MES) in STAR segment and is a partner to the world’s leading manufacturers of cars, commercial vehicles, and earth-moving equipment. Sofegi SpA has a presence in 23 countries across 4 continents, with 40 manufacturing sites, and employs 6,026 employees as of December 2020

Value chain-based sizing & forecasting

Supply Side Estimates

  • Company revenue estimation via referring to annual reports, investor presentations, and Hoover’s.

  • Segment revenue determination via variable analysis and penetration modeling.

  • Competitive benchmarking to identify market leaders and their collective revenue shares.

  • Forecasting via analyzing commercialization rates, pipelines, market initiatives, distribution networks, etc.

Demand side estimates

  • Identifying parent markets and ancillary markets

  • Segment penetration analysis to obtain pertinent

  • revenue/volume

  • Heuristic forecasting with the help of subject matter experts

  • Forecasting via variable analysis

Filters Market Report Objectives:

  • Understanding market dynamics (in terms of drivers, restraints, & opportunities) in the countries.

  • Understanding trends & variables in the individual countries & their impact on growth and using analytical tools to provide high-level insights into the market dynamics and the associated growth pattern.

  • Understanding market estimates and forecasts (with the base year as 2023, historic information from 2018 to 2023, and forecast from 2024 to 2030). Regional estimates & forecasts for each category are available and are summed up to form the global market estimates.

Filters Market Report Assumptions:

  • The report provides market value for the base year 2023 and a yearly forecast till 2030 in terms of revenue/volume or both. The market for each of the segment outlooks has been provided on region & country basis for the above-mentioned forecast period.

  • The key industry dynamics, major technological trends, and application markets are evaluated to understand their impact on the demand for the forecast period. The growth rates were estimated using correlation, regression, and time-series analysis.

  • We have used the bottom-up approach for market sizing, analyzing key regional markets, dynamics, & trends for various products and end-users. The total market has been estimated by integrating the country markets.

  • All market estimates and forecasts have been validated through primary interviews with the key industry participants.

  • Inflation has not been accounted for to estimate and forecast the market.

  • Numbers may not add up due to rounding off.

  • Europe consists of EU-8, Central & Eastern Europe, along with the Commonwealth of Independent States (CIS).

  • Asia Pacific includes South Asia, East Asia, Southeast Asia, and Oceania (Australia & New Zealand).

  • Latin America includes Central American countries and the South American continent

  • Middle East includes Western Asia (as assigned by the UN Statistics Division) and the African continent.

Primary Research

GVR strives to procure the latest and unique information for reports directly from industry experts, which gives it a competitive edge. Quality is of utmost importance to us, therefore every year we focus on increasing our experts’ panel. Primary interviews are one of the critical steps in identifying recent market trends and scenarios. This process enables us to justify and validate our market estimates and forecasts to our clients. With more than 8,000 reports in our database, we have connected with some key opinion leaders across various domains, including healthcare, technology, consumer goods, and the chemical sector. Our process starts with identifying the right platform for a particular type of report, i.e., emails, LinkedIn, seminars, or telephonic conversation, as every report is unique and requires a differentiated approach.

We send out questionnaires to different experts from various regions/ countries, which is dependent on the following factors:

  • Report/Market scope: If the market study is global, we send questionnaires to industry experts across various regions, including North America, Europe, Asia Pacific, Latin America, and MEA.

  • Market Penetration: If the market is driven by technological advancements, population density, disease prevalence, or other factors, we identify experts and send out questionnaires based on region or country dominance.

The time to start receiving responses from industry experts varies based on how niche or well-penetrated the market is. Our reports include a detailed chapter on the KoL opinion section, which helps our clients understand the perspective of experts already in the market space.

What questions do you have? Get quick response from our industry experts. Request a Free Consultation
gvr icn

GET A FREE SAMPLE

gvr icn

This FREE sample includes data points, ranging from trend analyses to estimates and forecasts. See for yourself.

gvr icn

NEED A CUSTOM REPORT?

We can customize every report - free of charge - including purchasing stand-alone sections or country-level reports, as well as offer affordable discounts for start-ups & universities. Contact us now

Certified Icon

We are GDPR and CCPA compliant! Your transaction & personal information is safe and secure. For more details, please read our privacy policy.