Plastic Resins Beyond 2030: How Feedstock, Regional Scale, and Circularity Are Rewriting Competition
Global resin demand continues to expand, but the basis of competition is changing. Regional production concentration, feedstock economics, resin-family cycles, circular supply, and regulation are becoming as important as headline volume growth.
FIVE SHIFTS TO WATCH
- Production is becoming more geographically concentrated, raising the importance of regional feedstock and energy economics.
- PE and PP remain the volume anchors, but resin families are moving through different demand, margin, and operating-rate cycles.
- Integrated petrochemical positions are gaining strategic weight as the cost of feedstock, utilities, and logistics diverges by region.
- Recycled, bio-attributed, and other circular resin routes remain small in volume but increasingly influence procurement and market access.
- Regulation is reaching upstream into resin selection through recycled-content, traceability, recyclability, and documentation requirements.
Global plastics production increased from 370.6 Mt in 2018 to 436.2 Mt in 2025. The growth story, however, is increasingly regional rather than uniform. Plastics Europe reports that Asia Pacific accounted for over 58% of global production in 2025, with China alone at 32%, while Europe represented over 13%. For resin producers and buyers, this concentration changes the meaning of global scale: capacity location, feedstock access, utilities, freight, and trade exposure can matter as much as nominal nameplate volume.
The strategic consequence is a widening gap between cost-advantaged integrated production hubs and regions where local supply has become more exposed to energy costs, operating-rate pressure, and imports. Resin markets, therefore, need to be read through a regional cost curve, not only through global demand growth.
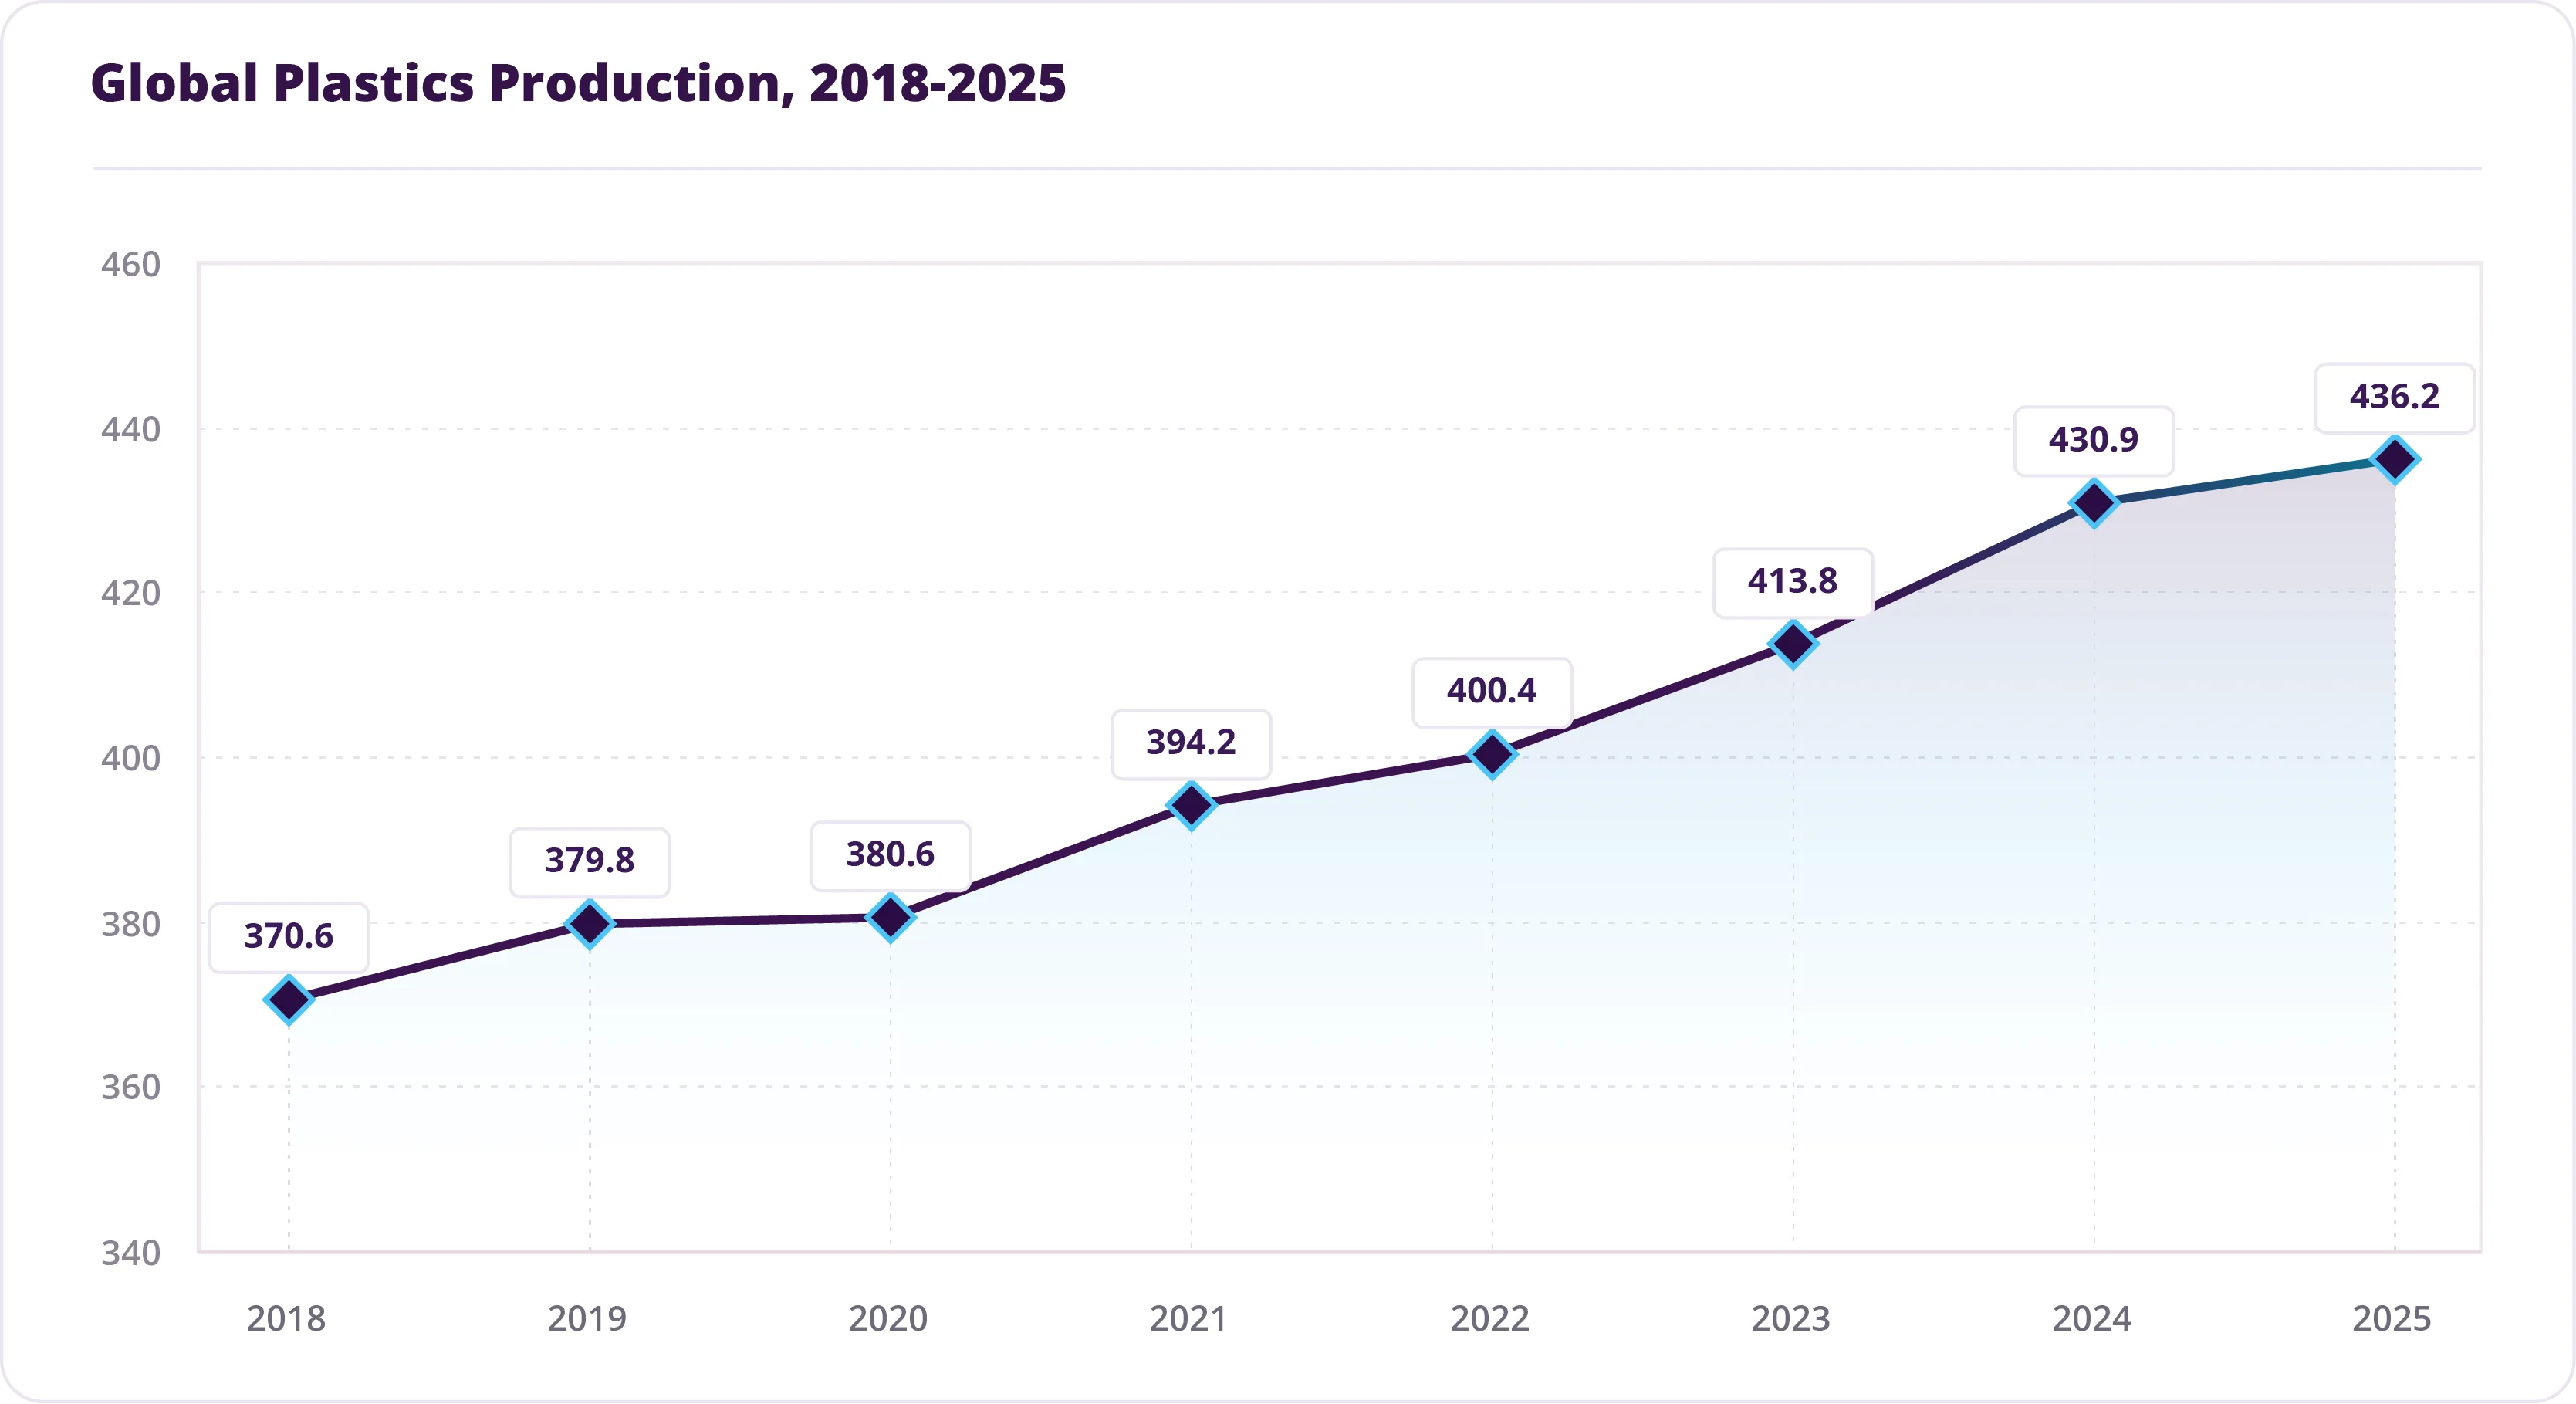
Figure 1. Global plastics production, 2018-2024 (Mt). Source: Plastics Europe, Plastics - The Fast Facts 2025-2024 data are preliminary
Regional production snapshot, 2024
Source: Plastics Europe, Plastics - The Fast Facts 2025
PE and PP remain the industry's volume anchors, together representing 52% of the 2025 global production mix. PVC, PET, PUR, and PS form the next major resin families, but the commercial cycle is not identical across them. A market with ample polyolefin capacity can coexist with tighter conditions in specific engineering, barrier, or application-led resin grades. This makes product mix, regional operating rates, and grade-level qualification increasingly important for producers deciding where to deploy capital and for buyers evaluating supply risk.
The implication is that a single plastics growth rate can conceal very different resin economics. Commodity families compete heavily on feedstock, integration, and scale, while more application-specific grades can place greater weight on specification, consistency, certification, and customer qualification. Through 2030, the strongest resin intelligence will therefore combine family-level demand with regional capacity additions, operating rates, trade flows, and price spreads.
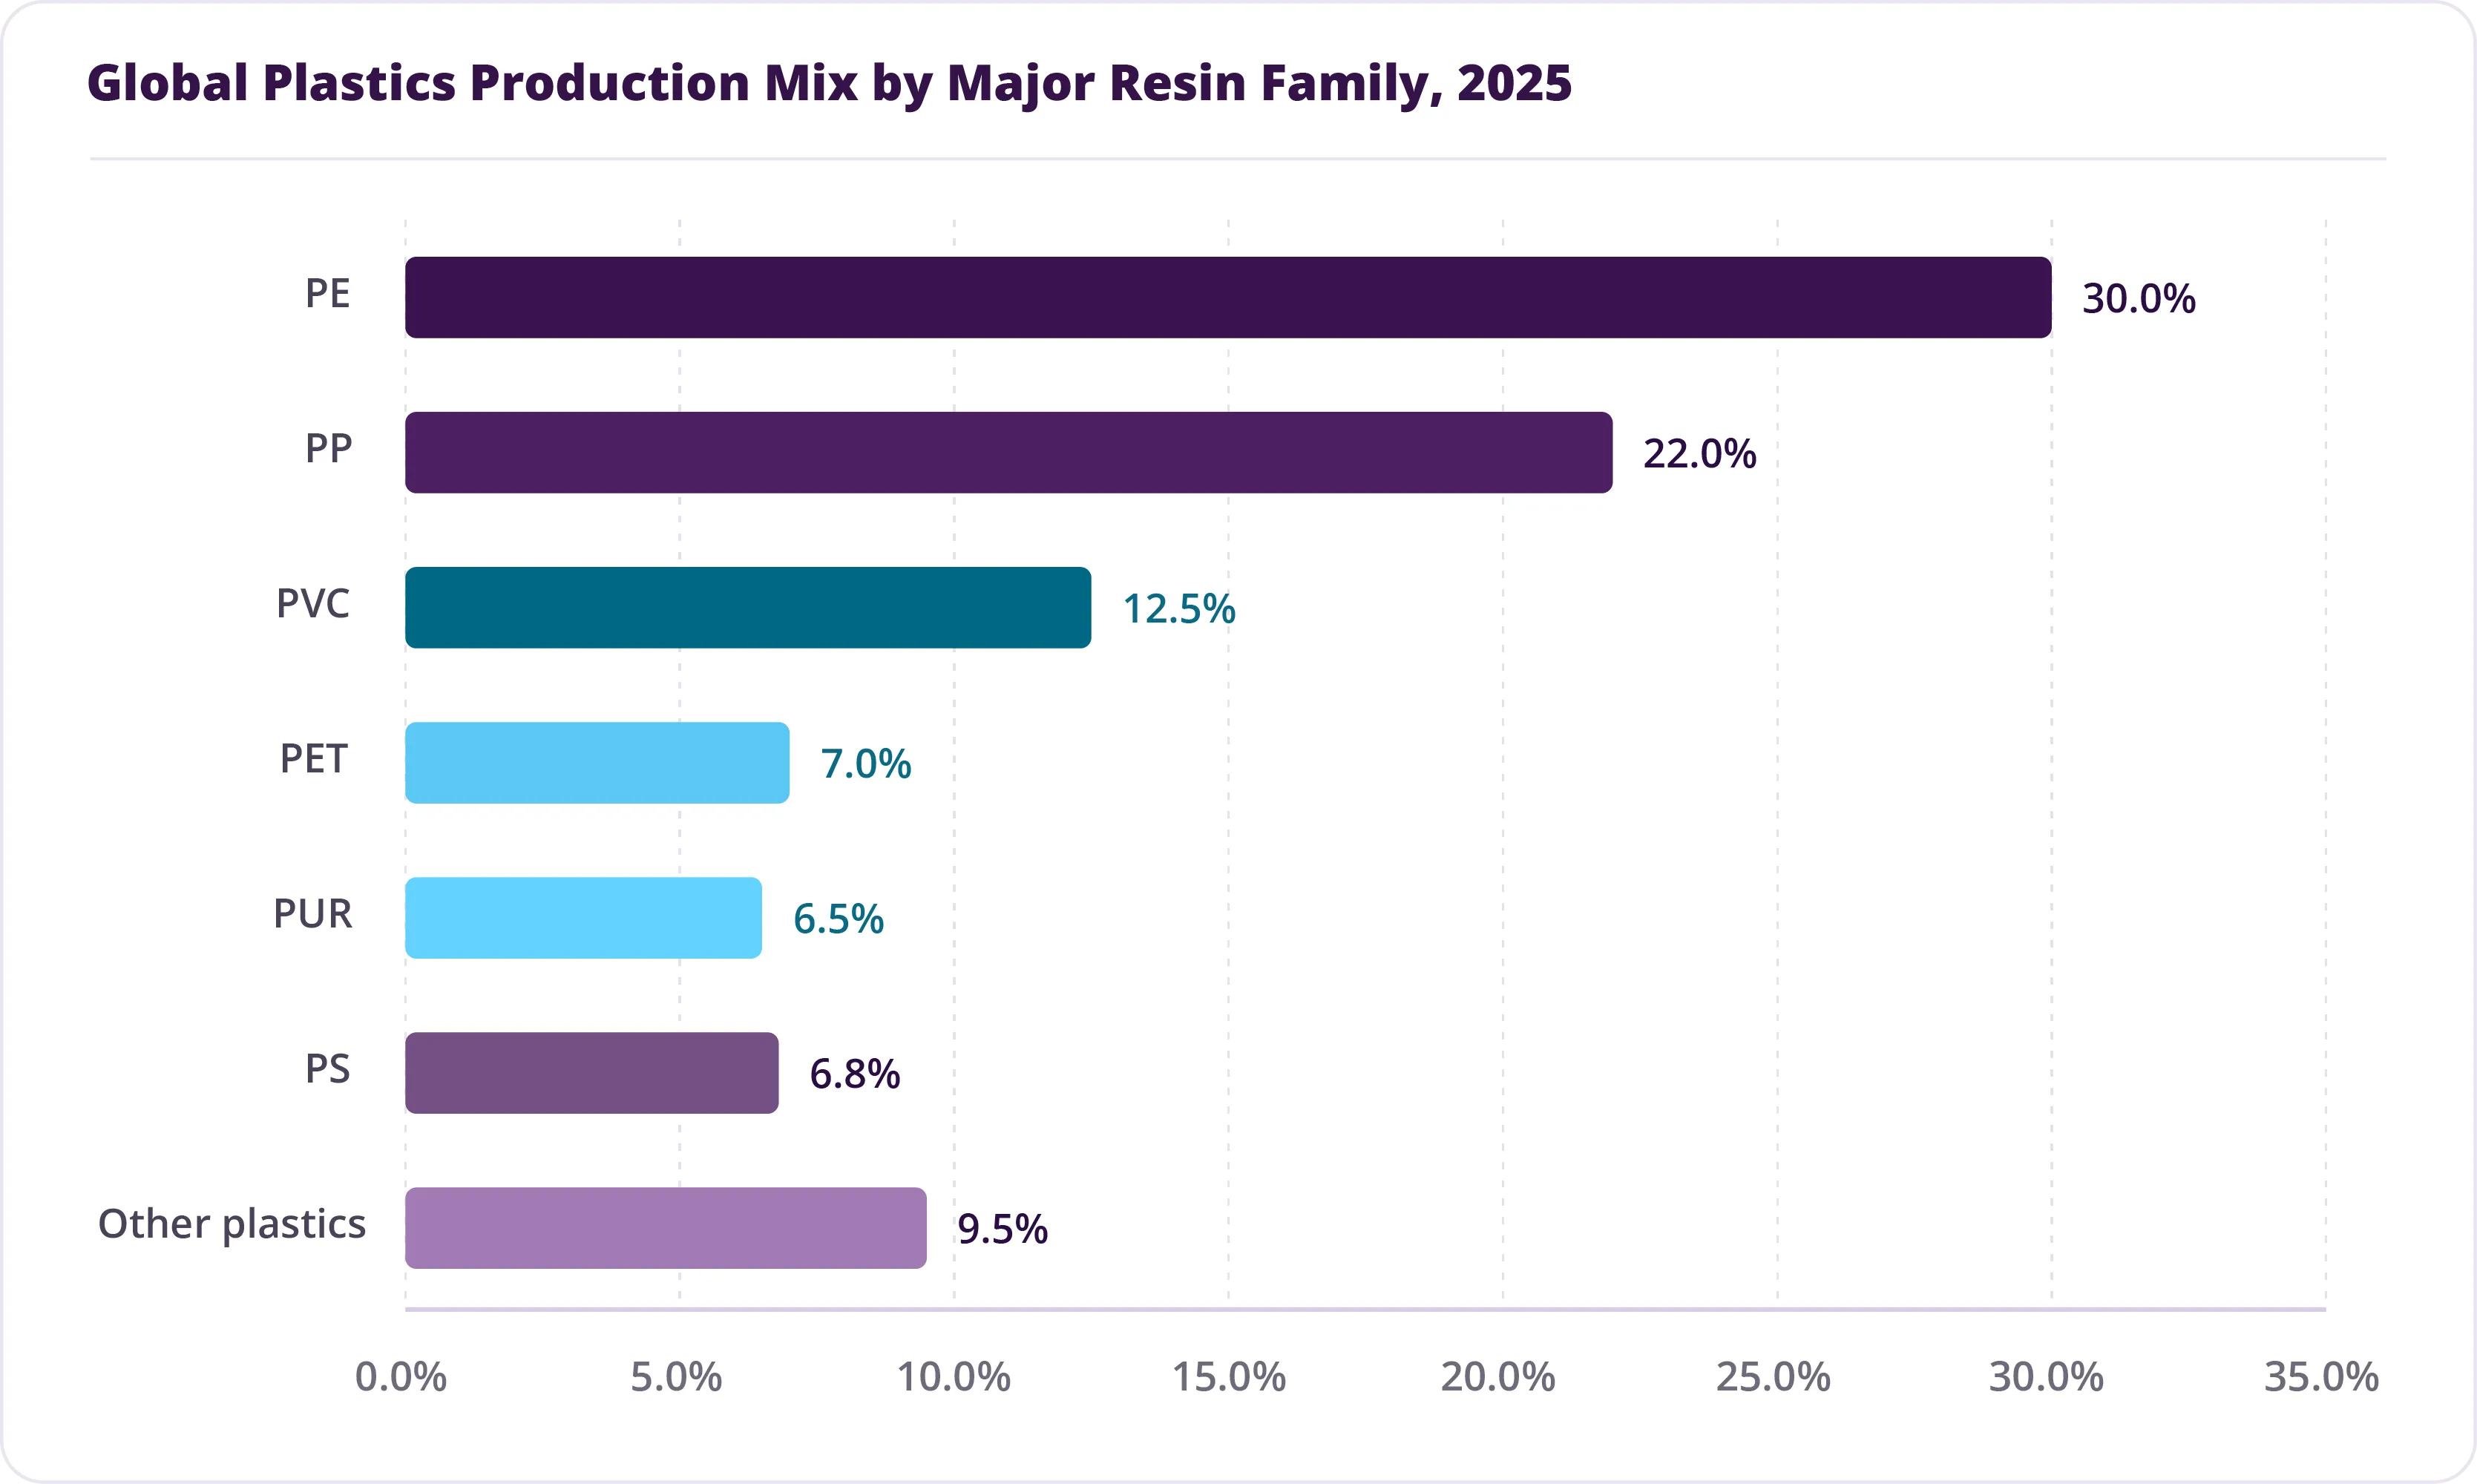
Figure 2. Global plastics production mix by major resin family, 2025. Source: Plastics Europe, Plastics - The Fast Facts 2025. PE includes LDPE/LLDPE and HDPE/MDPE categories
The strategic question is no longer only how much resin is produced, but where it is produced, with which feedstock advantage, and whether that supply can meet increasingly specific circularity and compliance requirements.
The next phase of resin competition will be shaped heavily by petrochemical integration. The International Energy Agency expects polymers and synthetic fibers to require 18.4 million barrels of oil per day by 2030, more than one in every six barrels, and identifies China and the United States as leading centers of petrochemical capacity build-out through the decade. That points to continued investment where feedstock, energy, and integrated infrastructure can support advantaged economics.
For resin suppliers, this makes landed cost a more useful competitive lens than ex-works price alone. Feedstock position, freight, tariffs, plant utilization, and regional supply-demand balance can materially change the economics of PE, PP, PVC, and other major families. It also raises the strategic value of geographic diversification: customers exposed to a single supply basin may face different risks from those able to qualify multiple regional sources.
The global production base remains overwhelmingly fossil-based. In 2024, Plastics Europe data place fossil-based plastics at 387.0 Mt, compared with 41.2 Mt of post-consumer mechanically and chemically recycled output, 2.6 Mt of bio-based or bio-attributed material, and a very small carbon-captured contribution. Circular routes are still a minority of the total supply, but their strategic importance is increasing faster than their volume share.
For resin producers, the challenge is not simply to add recycled tonnes. Commercially viable circular resin requires reliable waste feedstock, consistent quality, certification, traceability, and economics that customers can accept. Mechanical recycling will remain central for many streams, while chemical recycling and attributed feedstock models are being developed for applications where material performance or contamination constraints limit mechanical routes. The competitive issue is therefore moving from “recycled versus virgin” toward the ability to offer qualified resin portfolios with documented origin and predictable performance.
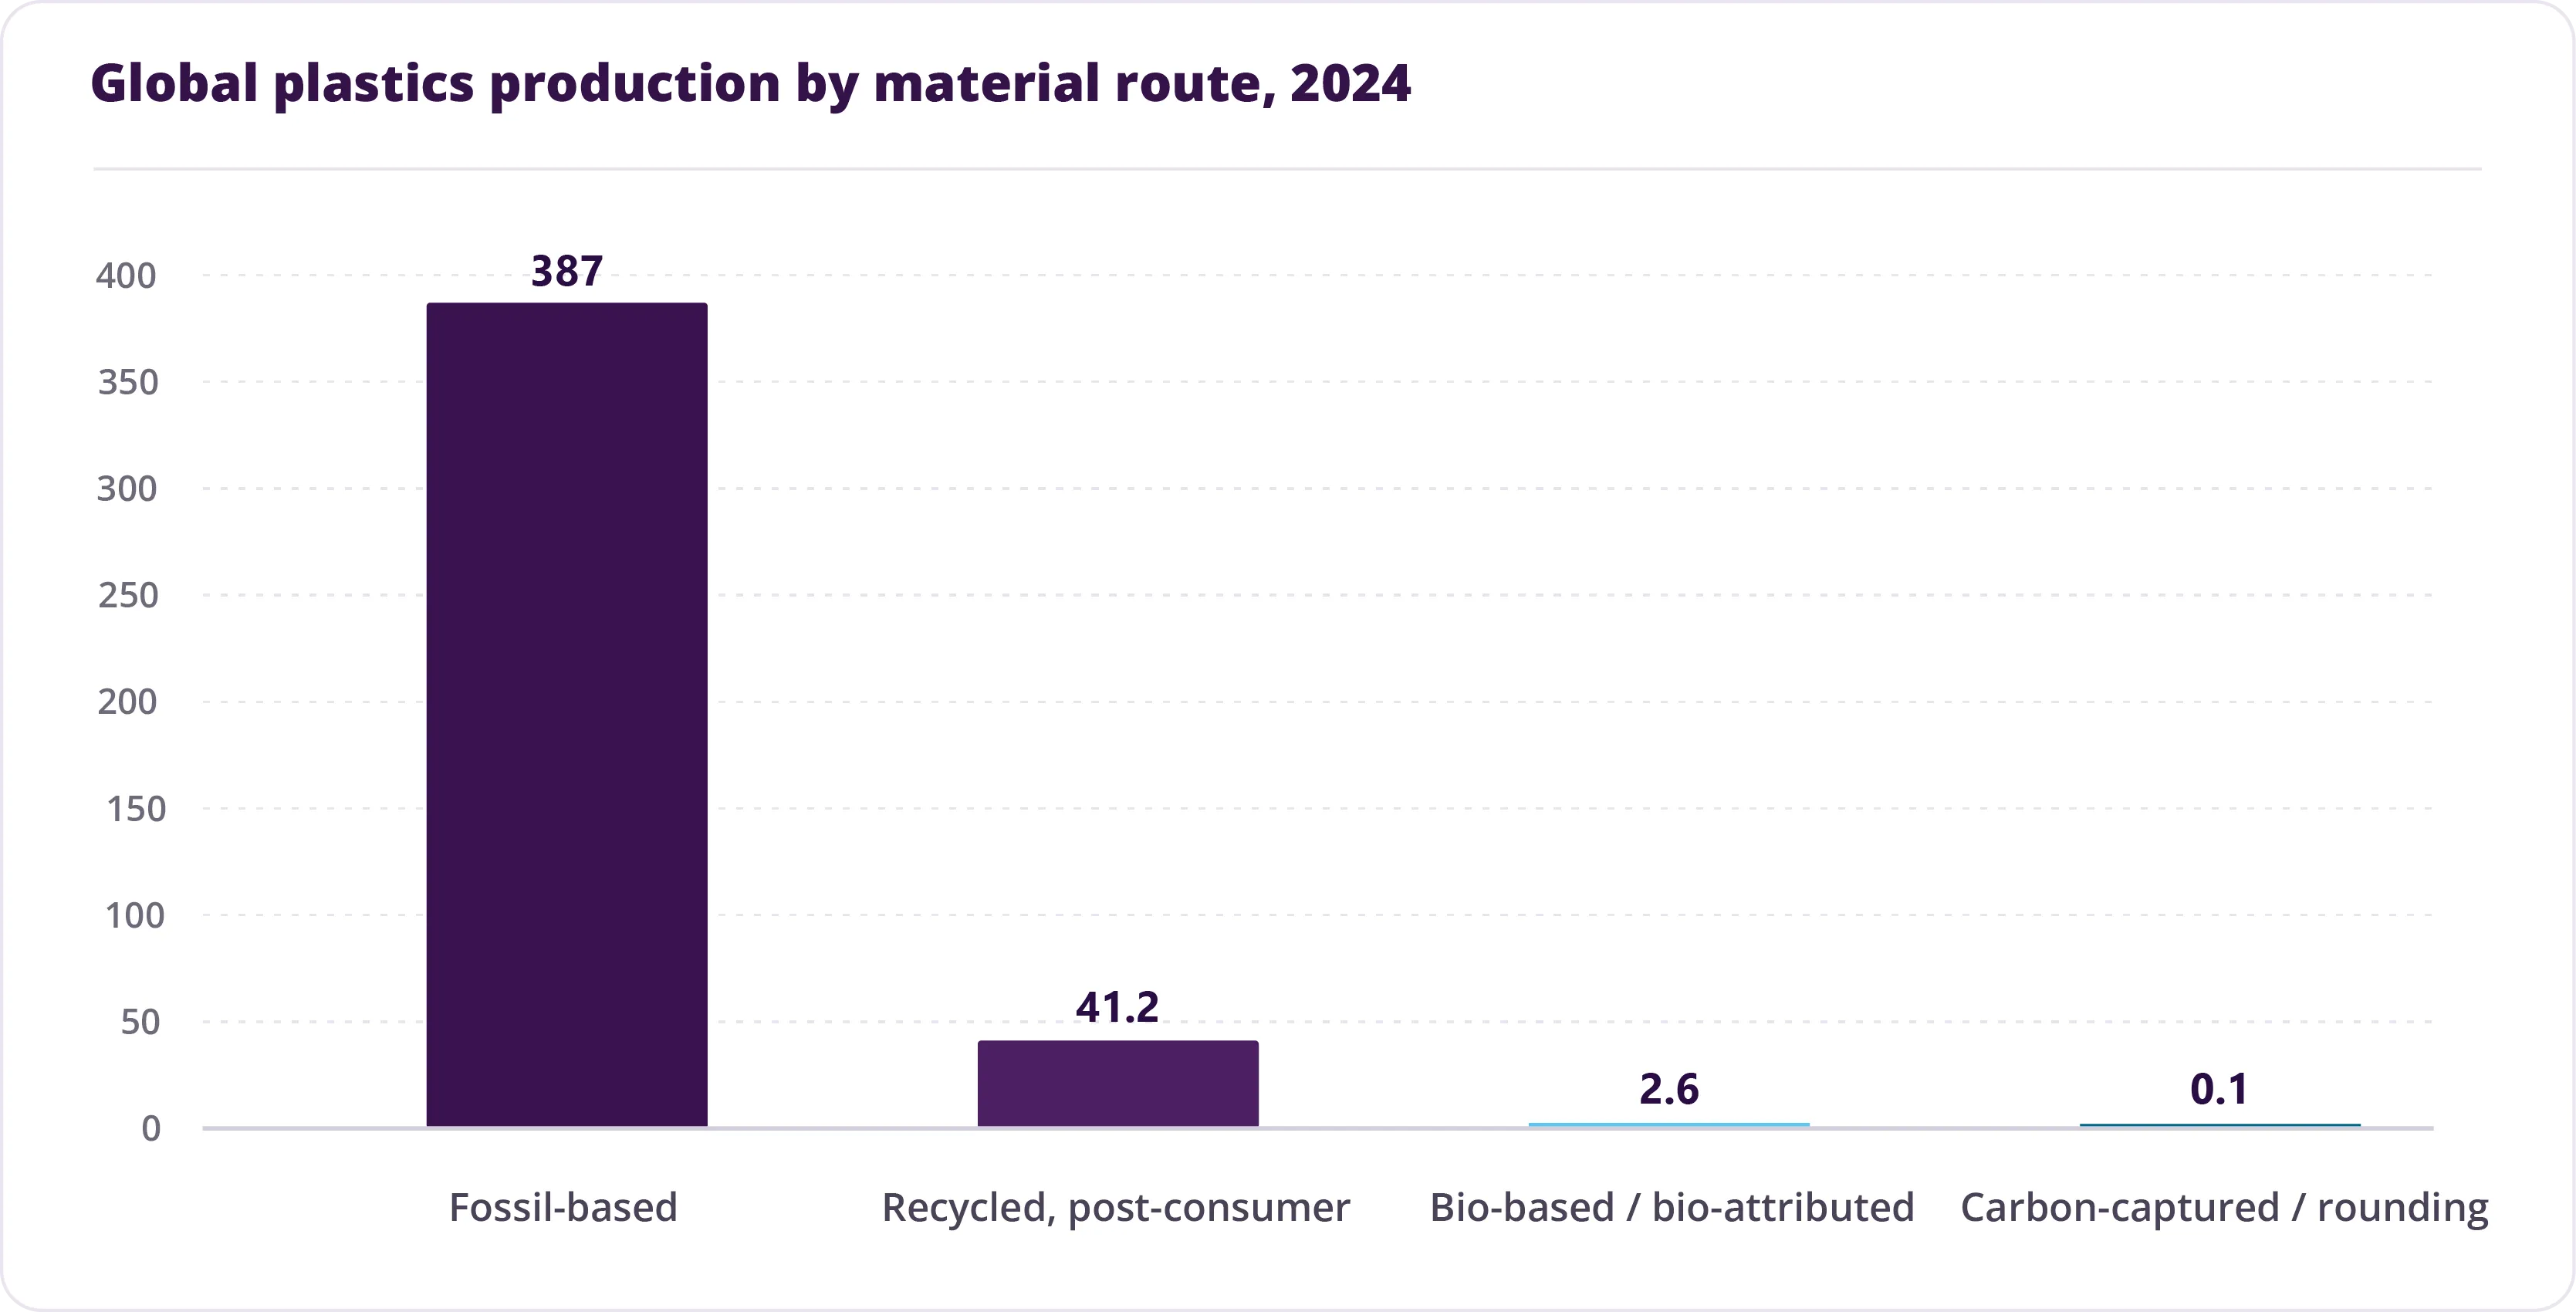
Figure 3. Global plastics production by material route, 2024 (Mt). Source: Plastics Europe, Plastics - The Fast Facts 2025.
Policy is increasingly reaching upstream into resin specifications. The EU Packaging and Packaging Waste Regulation entered into force in February 2025 and applies from 12 August 2026, with major recycled-content and packaging-recyclability requirements applying from 2030. Although PPWR is a packaging regulation, its effects move upstream because resin suppliers must increasingly support customers with material data, recycled-content documentation, traceability, and grades compatible with recyclability requirements.
This matters well beyond Europe. Multinational brand owners and packaging producers often rationalize material specifications across regions, while other jurisdictions are also tightening recycled-content, producer-responsibility, and waste rules. Resin suppliers that can demonstrate chain-of-custody, stable circular feedstock, and regulatory compatibility may therefore gain access to customer programs that cannot be served by price and mechanical performance alone.
Supply is concentrating around integrated petrochemical ecosystems, but demand growth is increasingly visible in manufacturing-heavy emerging markets. India is one example: Chemical & Petrochemical Manufacturers Association data show polymer demand at 21.23 Mt in FY2024-25, up 8.4% year over year, with demand estimated at 22.42 Mt for FY2025-26. Packaging, infrastructure, automotive, electrical, and consumer manufacturing all contribute to the pull on major resin families.
For global resin producers, this creates a two-sided geographic question: where is the lowest-cost molecule produced, and where is the fastest-growing qualified demand located? The answer will influence investment in capacity, distribution, inventory positioning, technical service, and customer development. Markets with strong demand growth but high import dependence may also become more sensitive to freight, tariffs, and supply disruptions.
Plastic resins are moving toward a more segmented competitive structure. High-volume commodity production will continue to reward scale, feedstock advantage, and integration. At the same time, circularity, traceability, grade-level qualification, and policy compatibility are adding new dimensions to material selection. The result is not the end of commodity economics, but a broader definition of what makes resin supply competitive.
For decision-makers, the practical implication is to stop treating plastic resins as one global cycle. The stronger lens is resin family × region × feedstock route × end-use demand. Producers that understand those intersections can better distinguish structural cost advantage from temporary price movement, identify where circular grades can command strategic value, and allocate capacity around the markets where demand, policy, and supply resilience are changing fastest.
stop treating plastic resins as one global cycle. The stronger lens is resin family × region × feedstock route × end-use demand.
Sources
- Plastics Europe, Plastics - The Fast Facts 2025
- International Energy Agency, Oil 2025
- European Union, Regulation (EU) 2025/40 on packaging and packaging waste and 2026 implementation guidance
- Chemical & Petrochemical Manufacturers Association, India Country Paper 2024


