Gold vs. Copper in 2026: A Procurement and Investment Intelligence Perspective
When you compare gold and copper, you aren’t just looking at two shiny metals dug out of the earth, you are looking at two entirely different economic heartbeats. Gold acts as an ultimate financial safe haven, responding to market anxiety, inflation fears, and monetary policy shifts. Copper often serves as a direct health check on global manufacturing, construction, and the energy transition.
To make strategic calls in this environment, market participants rely on comprehensive market intelligence that bridges high-level economic trends with physical commodity supply chains. Through its extensive tracking of global commodity markets, Grand View Signal enables businesses to gain insights on non-ferrous metals such as copper and gold, among other categories, giving decision-makers the granular data needed to hedge exposure, secure critical supply, and capture strategic upside.
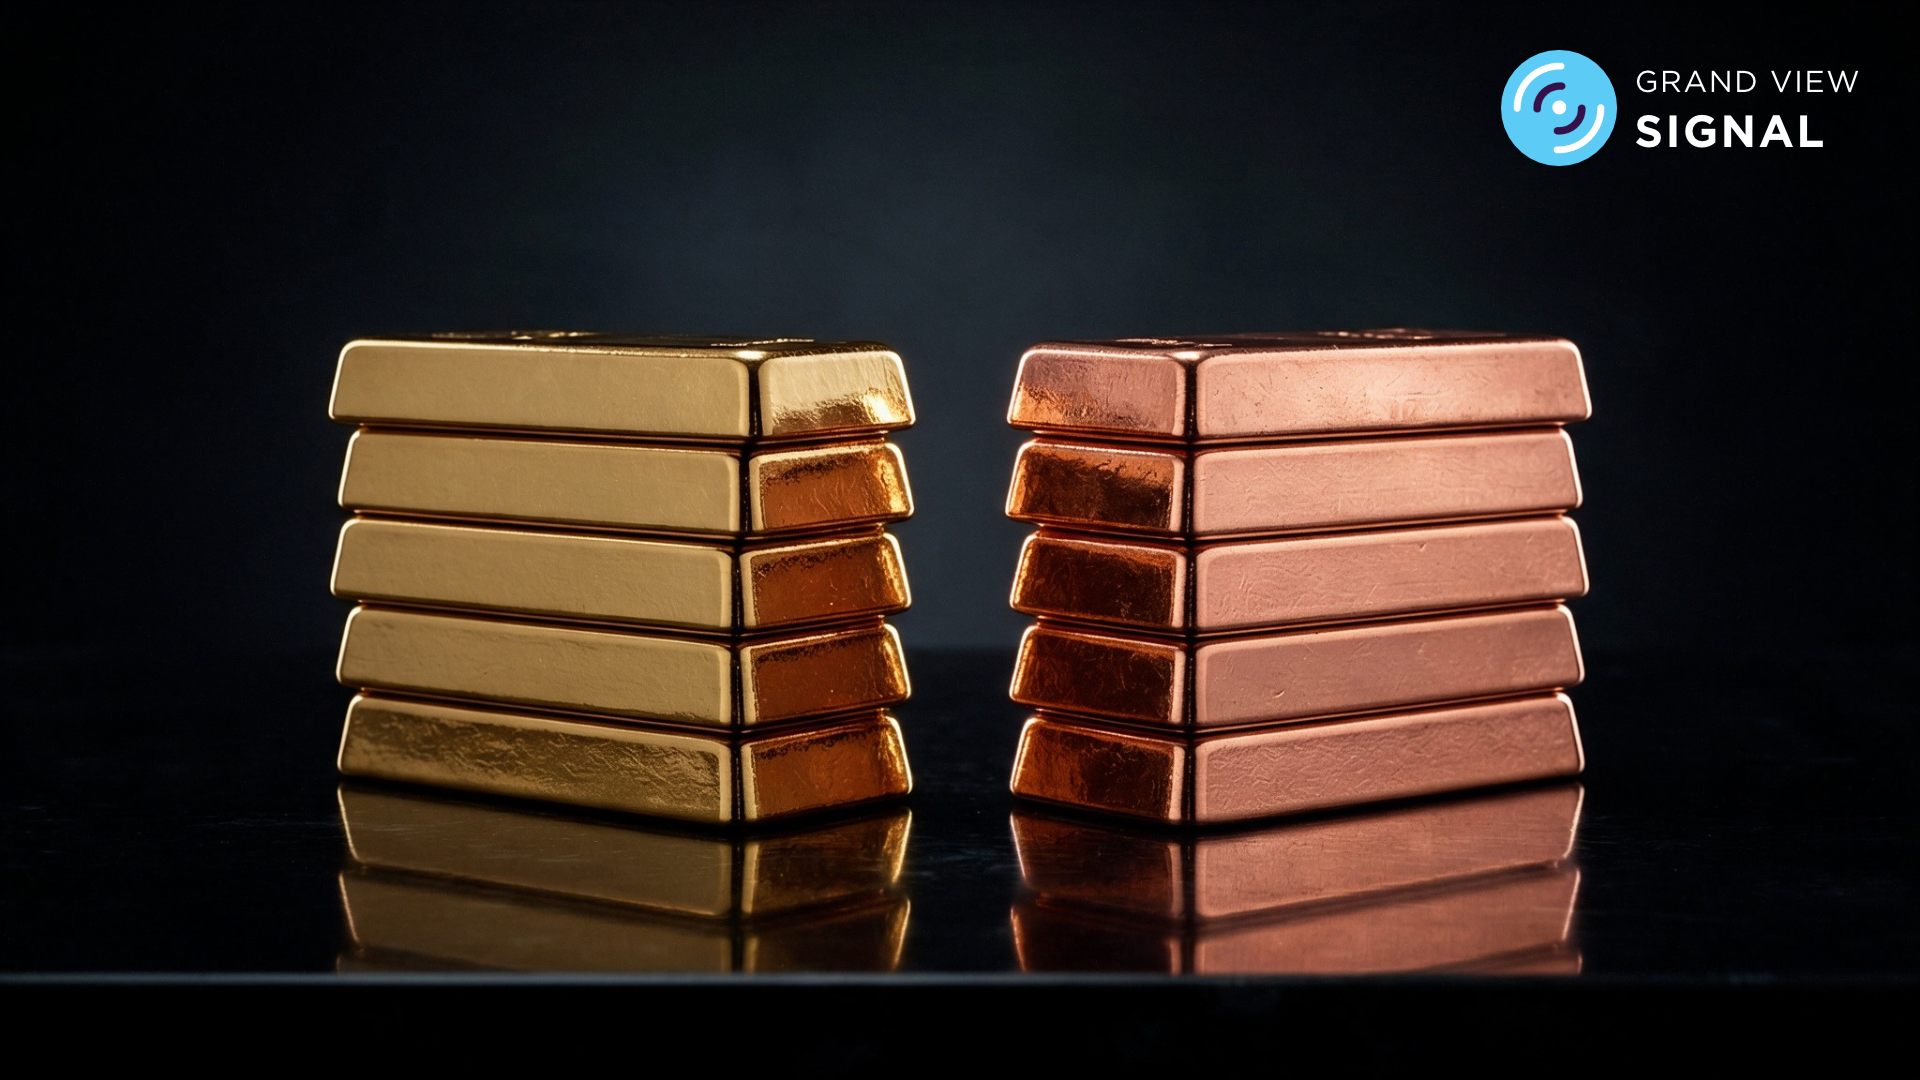
Whether you are an institutional investor seeking precious metals investment demand to buffer macro risk or a procurement executive managing raw material costs against volatile copper industrial demand, mastering the gold price vs copper price 2026 narrative is central to your strategy.
1. Macro Drivers: Safe Haven Hedging vs. Industrial Expansion
Understanding where these two metals derive their momentum requires taking a close look at what drives buyer behavior on each side of the spectrum.
Gold’s value proposition in 2026 continues to revolve around risk management. High central bank accumulation, ongoing geopolitical friction, and structural shifts away from dollar-denominated reserves keep official sector demand elevated.
-
Central Bank Buying: Sovereign entities continue to treat gold as a non-sovereign reserve asset, shielding portfolios from currency depreciation.
-
Interest Rate Sensitivity: As central banks refine monetary policy, lowering real yields typically reduces the opportunity cost of holding non-yielding bullion, boosting capital inflow.
-
Geopolitical Premium: Persistent global trade realignments ensure gold remains the go-to flight-to-quality asset during times of market turbulence.
Copper: The Engine of Clean Energy and AI
Unlike gold, copper derives almost all of its valuation from physical utility. You cannot build a modern electrical grid, produce an electric vehicle (EV), or power an AI-focused data center without massive quantities of copper wiring and busbars.
-
Energy Transition Imperative: Solar arrays, wind turbines, and EV charging infrastructure consume multiples of the copper required by traditional fossil-fuel systems.
-
AI Infrastructure Expansion: Datacenters powering advanced AI workloads demand heavy power-density upgrades, accelerating industrial consumption.
-
Supply Tightness: Long lead times for mine approvals, declining ore grades, and operational interruptions in major producing regions mean supply growth struggles to match demand expansion.
Access real-time impact analysis on commodity prices
Explore Grand View Signal
2. Deciphering the Gold-Copper Ratio in 2026
The gold-copper ratio, calculated by dividing the price of an ounce of gold by the price of a pound of copper, is one of the most reliable macroeconomic indicators in commodity analysis.
When the ratio spikes, it usually indicates that gold is vastly outperforming copper. The U.S. gold price was USD 4,400.0 per troy ounce in August 2026, and the U.S. copper price was USD 6.81 per pound in the same month, making the gold-copper ratio roughly 646. This tells us the market is pricing in economic slowdown, defensive risk-off sentiment, or systemic stress, where industrial activity cools while safe-haven demand accelerates.
Conversely, when the ratio declines, it signals that copper prices are surging faster than gold prices. This reflects industrial acceleration, rising global trade, and robust capital expenditure in construction, technology, and manufacturing.
The 2026 Divergence Mechanism
In recent market cycles, we have witnessed an intriguing structural shift: both gold and copper experiencing upward price pressure at the exact same time, albeit for totally different reasons. Gold moves on monetary easing and defensive hedging, while copper gains momentum from physical supply deficits and structural green-energy demand.
When both metals rally in tandem, procurement managers and portfolio strategists face a unique challenge: economic uncertainty remains high enough to keep gold elevated, yet fundamental industrial constraints push copper procurement costs to premium levels.
3. Investor Strategy: Navigating the 2026 Market Environment
For portfolio managers and private investors tracking precious metals investment demand, the core focus centers on balancing offensive equity growth with defensive capital preservation.
Gold functions primarily as insurance. It protects capital against currency debasement, fiscal deficit expansion, and equity market drawdowns. Investors rely on gold not for yield, but for liquidity and uncorrelated returns during market disruptions.
Copper, by contrast, operates as a growth play. Investing in copper, whether via physical futures, mining equities, or exchange-traded funds, allows investors to capture upside from structural megatrends like global electrification, grid modernization, and industrial automation. Combining both assets creates a balanced barbell strategy, providing downside protection through gold while participating in real-world infrastructure growth through copper.
4. Procurement Strategy: Securing Industrial Supply Lines
From a procurement perspective, buying copper requires a completely different playbook than purchasing precious metals. Category managers handling non-ferrous metals in 2026 must navigate structural cost pressures and supply chain volatility.
The Copper Sourcing Lifecycle
Rather than treating copper procurement as a simple spot-market transactional process, leading procurement teams structure their sourcing through an integrated multi-phase framework:
-
Macro Intelligence & Supply Auditing: Sourcing teams analyze mine output data, smelter treatment charges, and geopolitical stability across key supply zones such as Chile, Peru, and Central Africa.
-
Contract Structuring & Hedging: To mitigate price spikes, buyers combine long-term off-take agreements with financial hedging tools on exchanges such as the LME or COMEX.
-
Inventory & Scrappage Optimization: Industrial buyers increasingly integrate recycled copper (scrap) into their supply pipelines to lower input costs and meet strict corporate sustainability mandates.
Managing Price Risk
Procurement managers must continuously align inventory strategy with the macroeconomic signals sent by the gold price vs copper price in 2026 narrative. If macro indicators suggest a sudden surge in industrial demand alongside tight physical inventories, buyers must lock in forward contracts to hedge against margin compression.
5. Harnessing Integrated Intelligence Across Non-Ferrous Categories
Succeeding in today’s volatile commodity environment requires holistic visibility. You cannot evaluate gold without understanding macro monetary policy, nor can you forecast copper prices without tracking broader industrial manufacturing and energy markets.
This is where comprehensive intelligence platforms demonstrate their value. By leveraging Signal’s coverage of both precious metals and industrial commodities, market participants gain a unified view of cross-asset trends. Whether analyzing precious metal hedges or industrial input costs, access to a broad suite of research allows decision-makers to spot correlations, evaluate risk, and execute strategies with clarity.
Navigating the Road Ahead
As we look across 2026, the intersection of precious metals and industrial commodities will remain a critical focal point for corporate boardrooms and investment committees alike. The gold price vs copper price in 2026 dynamic highlights a global economy undergoing simultaneous structural transformations, balancing financial risk management against an aggressive re-engineering of world energy infrastructure.
Whether you are securing copper cathodes to build the next generation of power systems or managing institutional capital through precious metal allocations, success relies on clear, connected intelligence. By looking beyond isolated price charts and tracking the overarching supply and demand trends across the entire commodity spectrum, business leaders can transform market volatility into a sustainable strategic advantage.
Explore Grand View Signal
A SaaS based commodity pricing intelligence platform
Talk to an analyst
Tell us what you need. We reply within one working day.
Service Guarantee
-
Insured Buying
This report has a service guarantee. We stand by our report quality.
-
Confidentiality
Your transaction & personal information is safe and secure.
-
Custom research service
Design an exclusive study to serve your research needs.
-
24/5 Research support
Get your queries resolved from an industry expert.