
- Home
- »
- Next Generation Technologies
- »
-
Spectroscopy Market Size & Share Report, 2026-2033GVR Report cover

Process Spectroscopy Market (2026 - 2033)
Size, Share & Trends Analysis Report By Component (Hardware, Software), By Technology (Molecular Spectroscopy, Mass Spectroscopy, Atomic Spectroscopy), By Application (Polymer, Oil & Gas), By Region, And Segment Forecasts
Market Size, 2025
$24.7BMarket Estimate, 2026
$27.1BMarket Forecast, 2033
$52.5BCAGR, 2026–2033
9.9%Process Spectroscopy Market Summary
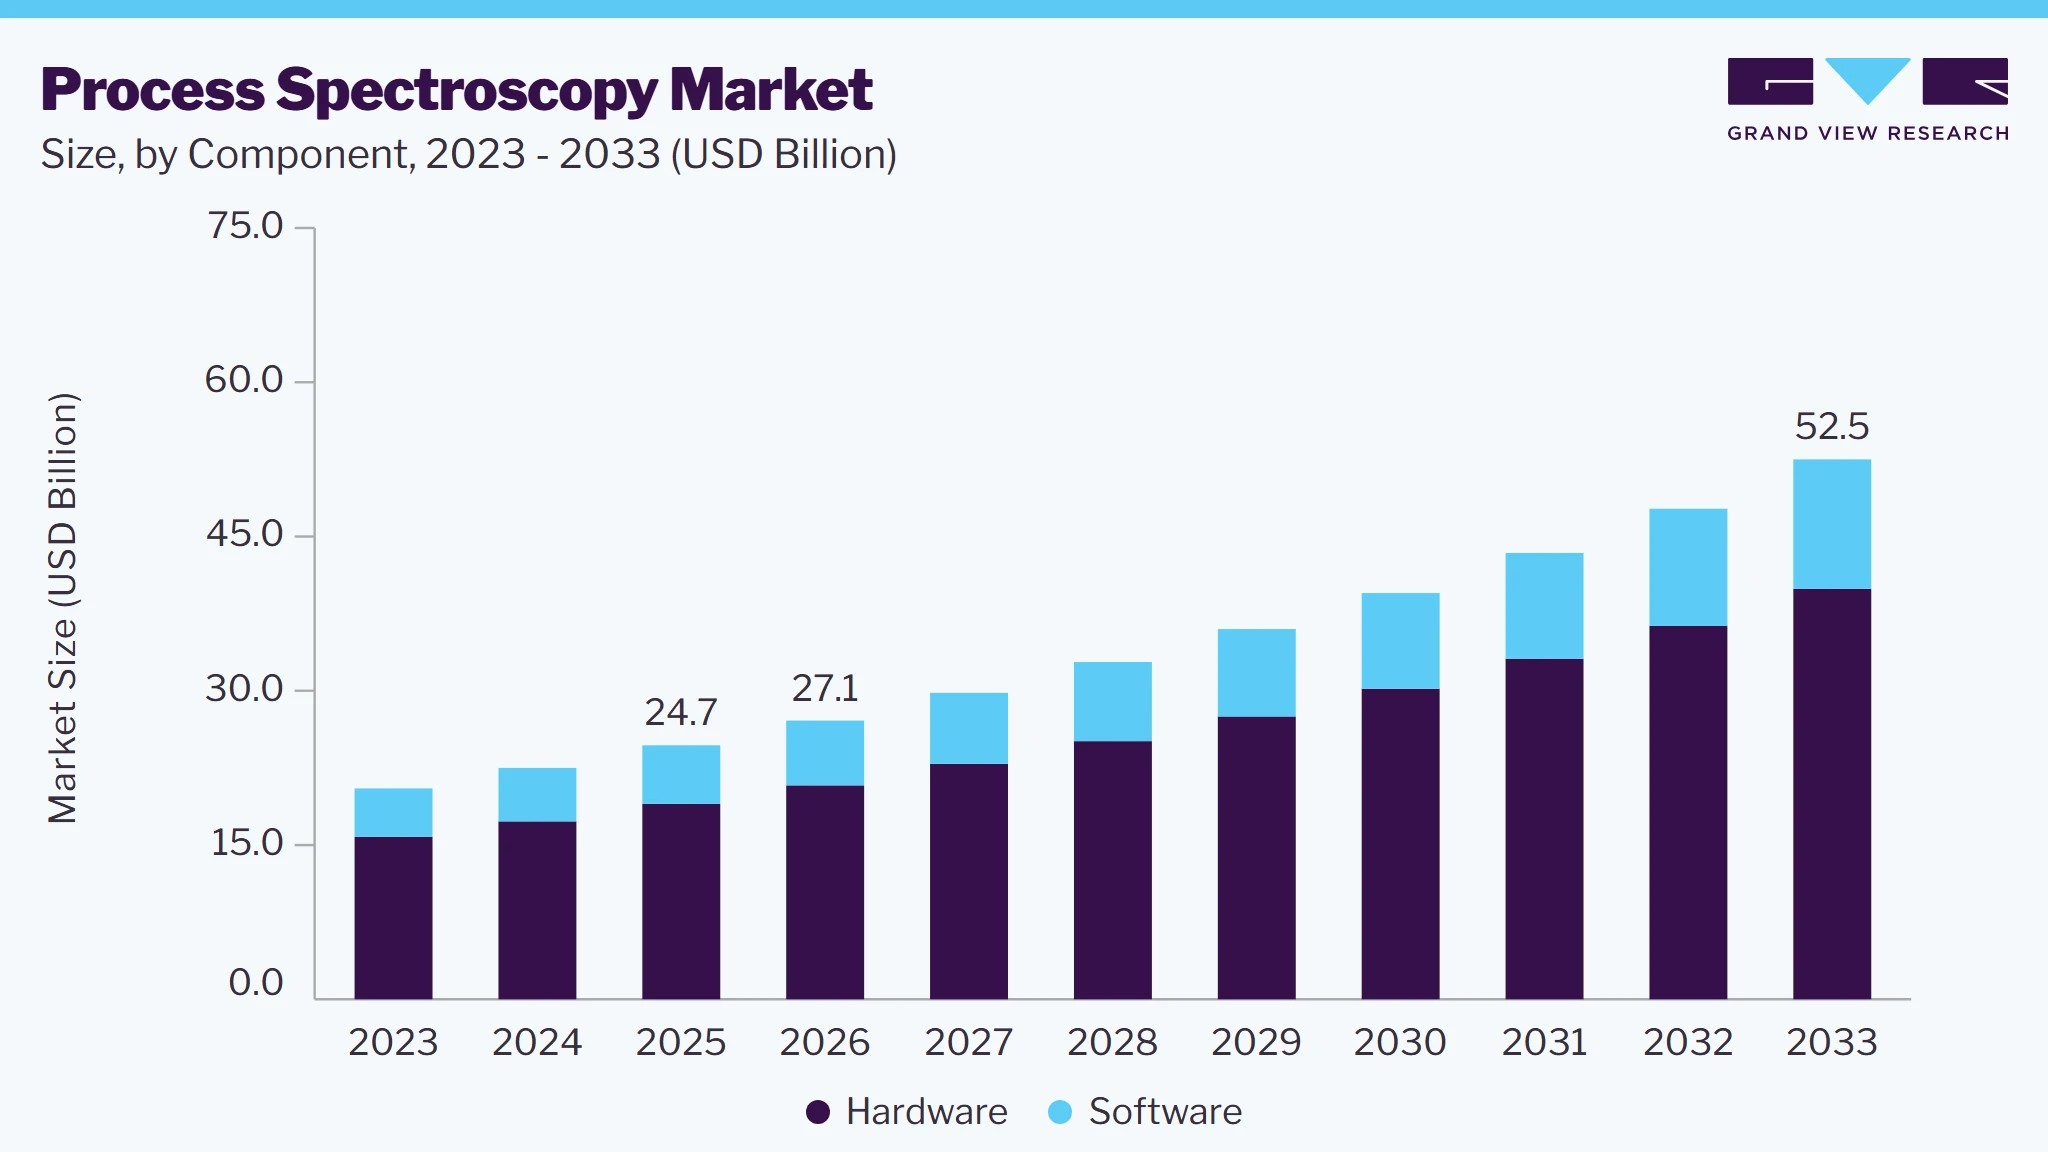
The global process spectroscopy market size was valued at USD 24.7 billion in 2025 and is projected to grow from USD 27.1 billion in 2026 to USD 52.5 billion by 2033, at a CAGR of 9.9% from 2026 to 2033. North America dominated the global market with the largest revenue share of 38.2% in 2025. The process spectroscopy market is driven by the increasing adoption of advanced process analytical technologies (PAT) and real-time quality monitoring solutions.
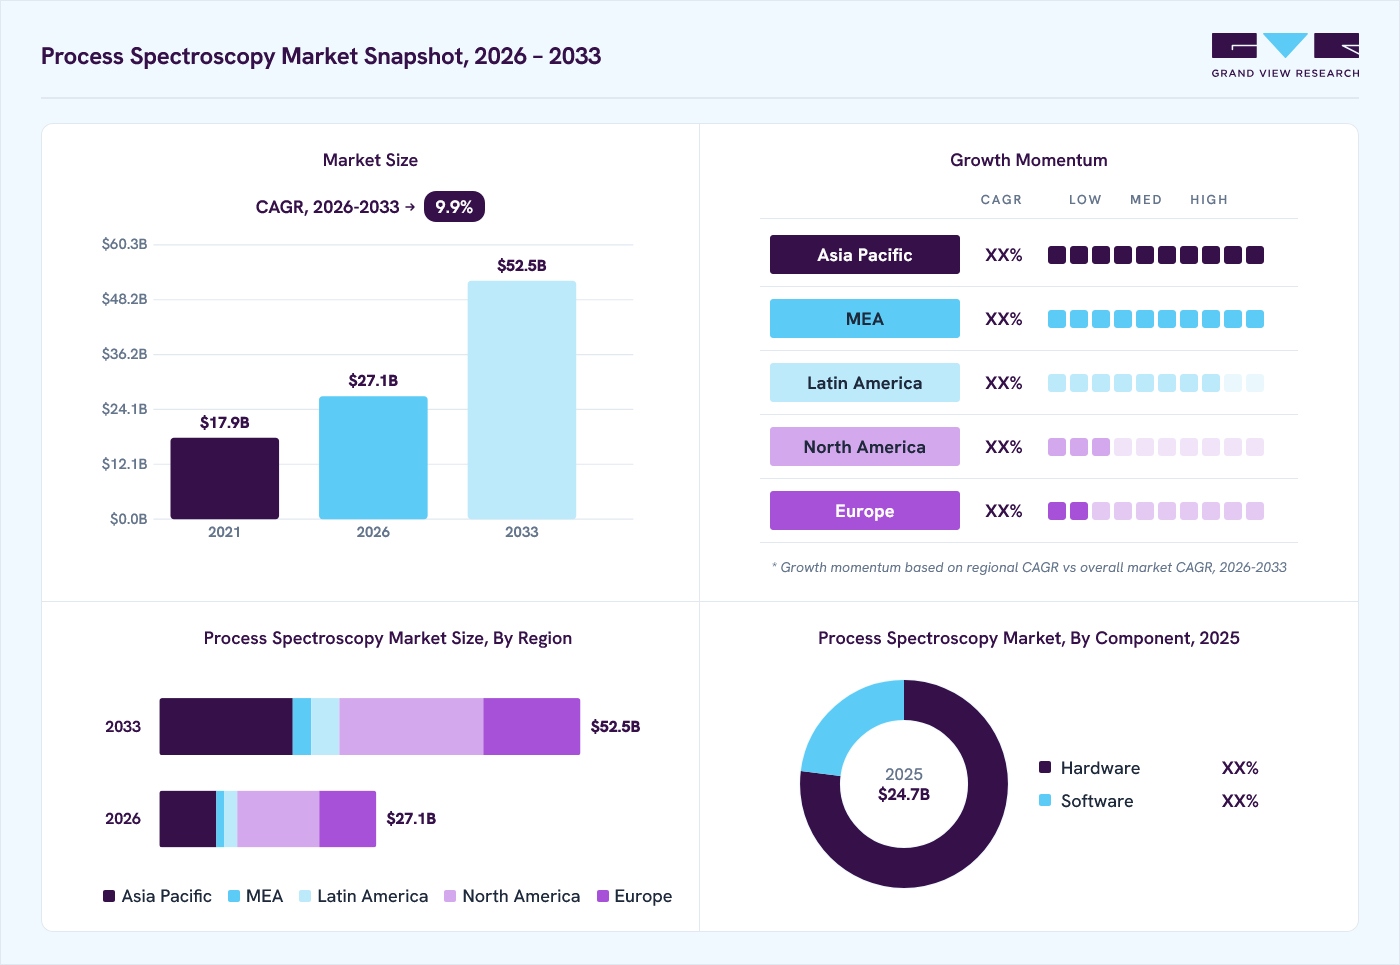 Source: Grand View Research, IR Documents, Primary Interviews, Paid DatabasesTo learn more about this report,
 Download Free Sample Report
 Key Market Trends & Insights
- By component: The hardware segment dominated the market, with a share of 77.0% in 2025.
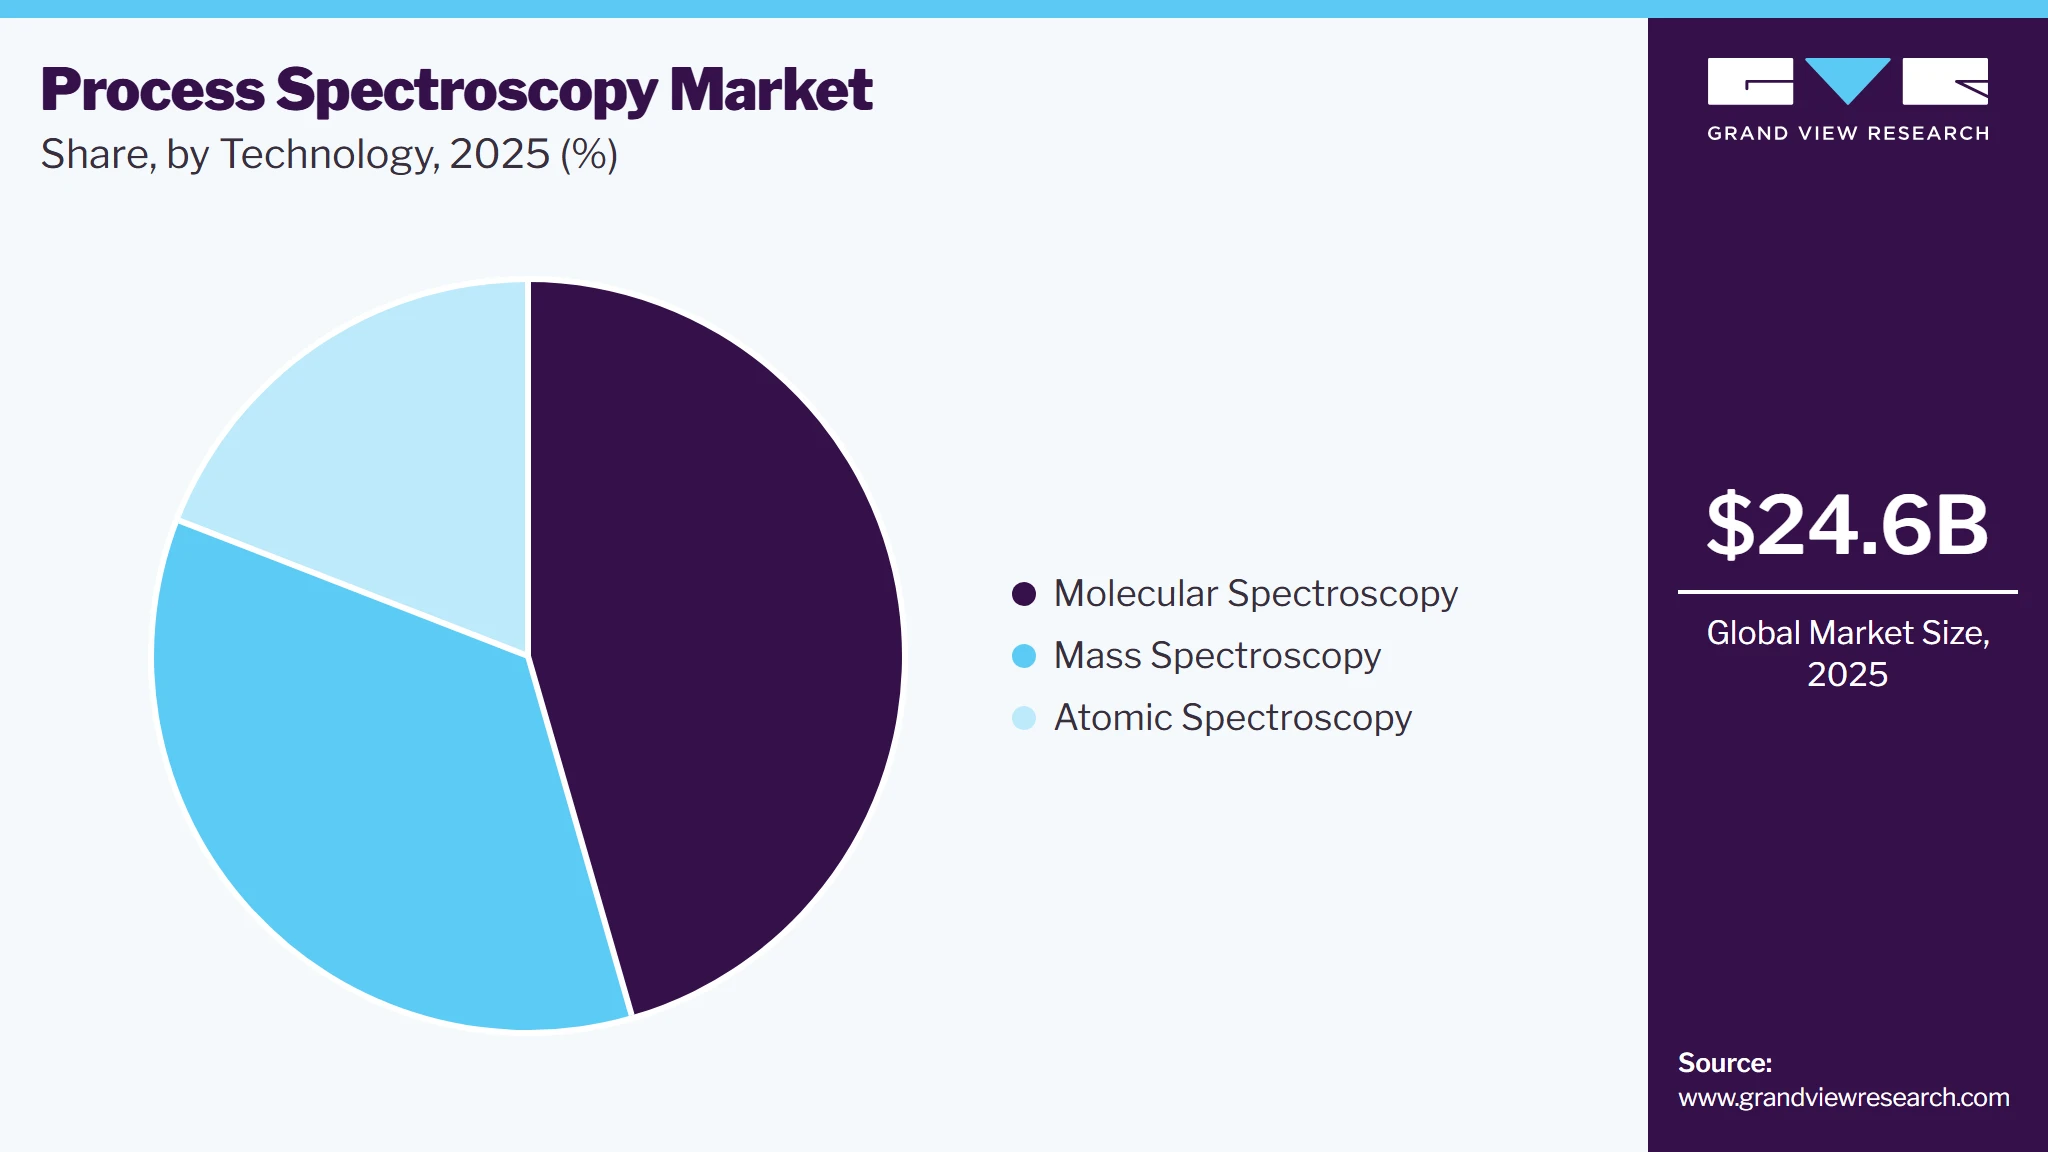
- By technology: The molecular spectroscopy segment accounted for the largest market share of 45.3% in 2025.
- By application: The pharmaceutical segment held the largest market share of 32.1% in 2025.
Regional Highlights
- Largest regional market: North America (38.2% revenue share in 2025)
- Fastest growing regional market: Asia Pacific (highest CAGR 12.9%, 2026-2033)
- By Country: The U.S. held the largest market share in 2025
Market Size & Forecast
- Market size in 2025: USD 24.7 Billion
- Estimated market size in 2026: USD 27.1 Billion
- Projected market size by 2033: USD 52.5 Billion
- CAGR (2026-2033): 9.9%
Three ways to get this report
Buy it, customize it, or ask a question.Ask an Analyst
Analyst response in 1 business day
- AccessReport author, directly
- Reply timeWithin 1 working day
- No sales callDirect answer only
- FormatEmail reply
- CostFree, no cost
Get the Full Report
What the study covers
- FormatsPDF · Excel · Dashboard
- Timeline2026–2033 annual, 2025 base
- Coverage20+ countries, 5 regions
- Companies10+ key players profiled
Customize the Report
20% free customization
- IncludeCountries, segments, points
- TailorTo your product definition
- ExtendDeeper competitor detail
- OrA fully bespoke study
- Turnaround5–10 working days
The growing integration of spectroscopy techniques such as Near-Infrared (NIR), Raman, FTIR, and UV-Visible spectroscopy with industrial automation and smart manufacturing systems is enhancing process control and product consistency. The expansion of continuous manufacturing practices and rising investments in Industry 4.0 initiatives are accelerating the adoption of process spectroscopy solutions.
 To learn more about this report, Download Free Sample Report
 In addition, the growing advancements in AI-powered spectral analysis and miniaturized spectroscopy devices are further expanding applications in pharmaceuticals, food safety, and environmental monitoring, thereby driving market expansion. The adoption of process spectroscopy is steadily increasing across various industries owing to the growing advancements in technology, regulatory requirements, and the growing need for real-time process monitoring. Industries such as pharmaceuticals, food and beverage, chemicals, oil, and gas are integrating spectroscopy techniques such as Near-Infrared (NIR), Raman, and Fourier Transform Infrared (FTIR) spectroscopy to enhance quality control and operational efficiency. This increasing importance of reducing operational expenditure is anticipated to drive the demand for process spectroscopy in the coming years.
In addition, regulatory bodies such as the FDA and EMA are encouraging the use of process analytical technology (PAT), which includes spectroscopy, to ensure product consistency and compliance with safety standards. This has led to a rise in the adoption of spectroscopy for inline and at-line monitoring, reducing the reliance on traditional offline laboratory testing, which is expected to further drive the process spectroscopy industry expansion.
Furthermore, another key trend in the market is the integration of spectroscopy with automation, AI, and IoT. With the increasing availability of smart sensors and cloud-based analytics, industries can now collect, analyze, and interpret spectroscopic data in real time. The miniaturization of spectrometers has also made it easier to incorporate them into production lines, enabling continuous monitoring without disrupting the manufacturing process. These technological advancements are making process spectroscopy more accessible and cost-effective, further driving its adoption.
Moreover, the increasing application of mass spectrometry (MS) in drug discovery and development (DDD) is a significant factor driving the growth of the process spectroscopy industry. Mass spectrometry is widely used in the pharmaceutical industry for analyzing the composition, structure, and purity of chemical compounds, helping researchers identify bioactive molecules and biomarkers in drug discovery. This synergy between MS and process spectroscopy optimizes the drug development process, making it faster, more efficient, and more reliable, thereby fueling the process spectroscopy industry's growth.
Market Dynamics
The process spectroscopy Market is witnessing significant growth driven by the increasing adoption of process analytical technologies (PAT), industrial automation, and real-time process monitoring solutions across manufacturing industries. The growing integration of advanced spectroscopic techniques, including Near-Infrared (NIR), Raman, Fourier Transform Infrared (FTIR), UV-Visible, and mass spectroscopy, with smart manufacturing systems is enhancing process control, product quality, and operational efficiency. The rising emphasis on continuous manufacturing, quality-by-design frameworks, and data-driven production strategies is accelerating market expansion across pharmaceutical, chemical, food & beverage, oil & gas, semiconductor, and biotechnology industries.
The increasing emphasis on real-time process monitoring is becoming a major factor supporting the adoption of process spectroscopy solutions. Organizations are seeking advanced analytical tools that can provide continuous measurement of critical process parameters, enabling greater visibility into production operations. Spectroscopic technologies offer rapid, non-destructive analysis capabilities that help improve process consistency, reduce variability, and support informed decision-making throughout manufacturing workflows.
The growing adoption of digital manufacturing frameworks is accelerating demand for integrated analytical systems that deliver immediate process insights. Process spectroscopy enables continuous verification of material characteristics, product attributes, and operational conditions without interrupting production activities. As organizations prioritize efficiency, quality assurance, and data-driven operations, the deployment of spectroscopy-based monitoring solutions continues to expand across increasingly sophisticated production environments.
The development and maintenance of accurate calibration models remain a significant challenge for the implementation of process spectroscopy. Spectroscopic systems rely heavily on robust chemometric models to generate reliable analytical results, requiring extensive data collection, validation procedures, and periodic updates. Variations in raw materials, environmental conditions, and production parameters can affect model performance, complicating measurement accuracy for end users seeking consistency.
Establishing effective calibration frameworks often requires specialized expertise in spectroscopy, statistics, and process analytics. Many organizations struggle to manage model optimization, instrument standardization, and long-term performance verification. These technical requirements can increase deployment timelines and operational costs while creating barriers for facilities with limited analytical resources, ultimately restricting broader adoption of process spectroscopy technologies.
The increasing transition toward continuous manufacturing architectures is creating favorable opportunities for process spectroscopy solution providers. Continuous production environments require uninterrupted monitoring of process conditions and product attributes to maintain operational stability. Spectroscopic technologies are well-positioned to meet these requirements through real-time analytical measurements that enable immediate detection of deviations, improved process control, and enhanced manufacturing transparency.
Advancements in automation platforms, digital twins, predictive analytics, and connected production systems are strengthening the role of spectroscopy within modern manufacturing ecosystems. The ability to deliver rapid analytical feedback supports closed-loop control strategies and facilitates higher levels of operational intelligence. As organizations modernize production infrastructure to achieve greater efficiency and consistency, demand for advanced process spectroscopy solutions is expected to increase substantially.
Market Concentration & Characteristics
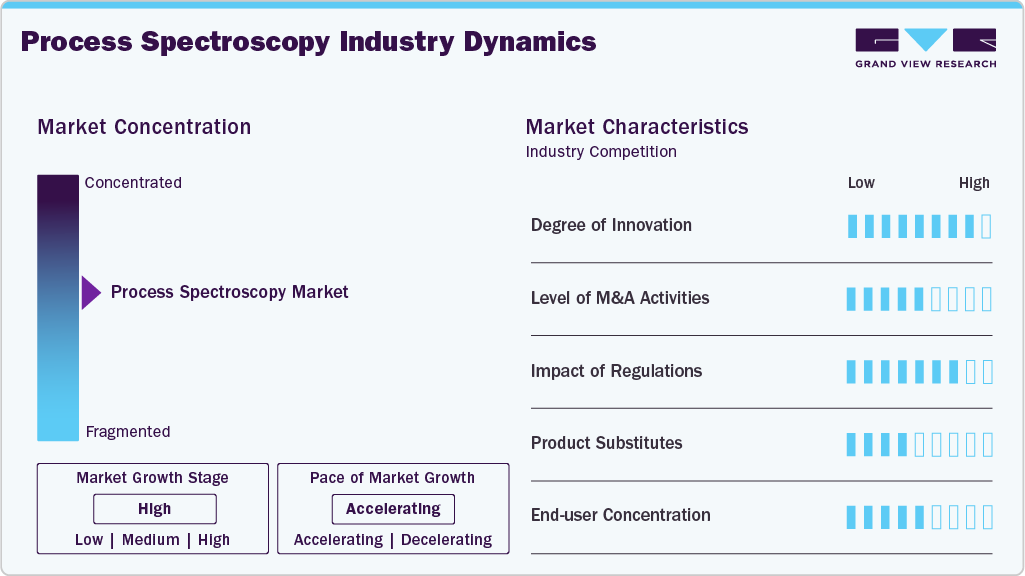
The Process Spectroscopy Market is moderately concentrated, comprising analytical instrumentation manufacturers, process automation solution providers, spectroscopy technology developers, industrial measurement system suppliers, and specialized process analytics companies. The market is expanding due to increasing adoption of real-time process monitoring technologies, rising emphasis on product quality assurance, and growing implementation of data-driven manufacturing strategies. Strategic collaborations between instrumentation providers, automation vendors, software developers, and process control specialists are becoming increasingly common as organizations focus on improving operational efficiency, process visibility, and manufacturing consistency. Continuous advancements in spectroscopy platforms, chemometric modeling, artificial intelligence-enabled analytics, real-time process control systems, miniaturized sensors, and cloud-connected monitoring solutions are emerging as key competitive strategies in the market.
 To learn more about this report, Download Free Sample Report
 The market is characterized by a very high level of innovation, driven by ongoing developments in advanced spectroscopic techniques, AI-enabled data interpretation, predictive process analytics, digital twin integration, automated calibration technologies, and intelligent process monitoring platforms. The industry is witnessing moderate merger and acquisition activity as companies seek to strengthen analytical capabilities, expand technology portfolios, and enhance their presence across industrial automation ecosystems. Competition from alternative analytical technologies, including chromatography systems, laboratory-based testing methods, conventional process analyzers, and sensor-based measurement solutions, remains moderate, particularly in applications where continuous real-time monitoring is not critical. Increasing investments in smart manufacturing infrastructure, industrial digitalization initiatives, connected production environments, and advanced process optimization technologies are expected to further support market expansion.
Analyst Perspective
The process spectroscopy market is witnessing steady expansion driven by the increasing adoption of real-time process analytical technologies, industrial automation systems, and data-driven manufacturing practices. The industry is benefiting from growing demand for continuous process monitoring, enhanced product quality assurance, and improved operational efficiency, enabling organizations to optimize production performance while reducing process variability and material waste. The rising emphasis on regulatory compliance, manufacturing consistency, and advanced process control is supporting broader deployment of spectroscopy-based analytical solutions across diverse production environments. As organizations increasingly prioritize real-time decision-making, resource efficiency, and automated quality management, process spectroscopy technologies are expected to play an increasingly critical role in modern manufacturing ecosystems.
Component Insights
Based on component, the hardware segment led the market with the largest revenue share of 77.0% in 2025 and is expected to grow at a significant CAGR over the forecast period. The segment is primarily driven by the increasing demand for real-time analysis and monitoring across various industries. As sectors such as pharmaceuticals, food and beverages, and chemicals face stringent quality control and regulatory requirements, the need for reliable spectroscopic devices has surged. These hardware solutions, including spectrometers and analyzers, enable non-destructive testing and continuous monitoring of chemical compositions during production processes, thereby enhancing product quality and compliance with industry standards.
The software segment is expected to witness the fastest CAGR of 12.0% from 2025 to 2030, driven by the increasing need for efficient data management and analysis capabilities. As industries generate vast amounts of data from spectroscopic measurements, there is a growing demand for software solutions that can streamline workflows, ensure data integrity, and facilitate compliance with regulatory requirements. The integration of advanced analytics tools within spectroscopy software allows for real-time data processing and visualization, enabling organizations to make informed decisions quickly.
Application Insights
Based on application, the pharmaceutical segment dominated the market with the largest revenue share of 32.1% in 2025, owing to stringent regulatory requirements for drug quality and safety. Spectroscopy techniques are essential for real-time monitoring during drug formulation processes, ensuring that products meet the required specifications. The increasing focus on biopharmaceuticals and personalized medicine further emphasizes the need for advanced analytical methods to characterize complex formulations accurately. In addition, the rising adoption of Process Analytical Technology (PAT), which integrates spectroscopic methods into manufacturing processes to enhance product quality control, is a key factor driving the market growth.
The food & agriculture segment is expected to witness the fastest CAGR from 2025 to 2030. The increasing consumer demand for high-quality food products and safety regulations is a key driver behind segmental growth. Spectroscopy enables rapid testing of contaminants, nutritional content, and quality parameters in food production, helping manufacturers maintain compliance with health standards while ensuring consumer safety. In addition, the growing focus on sustainability and traceability within food supply chains is another key trend in the market. Spectroscopic techniques are being utilized to monitor agricultural practices, assess soil health, and optimize crop yields through precise nutrient management.
Technology Insights
Based on technology, the molecular spectroscopy segment led the market with the largest revenue share of 45.3% in 2025, primarily driven by the increasing demand for advanced analytical techniques across various sectors, particularly pharmaceuticals and biotechnology. These industries rely heavily on molecular spectroscopy for drug development, quality control, and regulatory compliance. For instance, techniques such as Raman spectroscopy are essential for analyzing the molecular composition of drug formulations, ensuring that active pharmaceutical ingredients (APIs) meet stringent quality standards.
 To learn more about this report, Download Free Sample Report
 The mass spectroscopy segment is anticipated to witness the fastest CAGR from 2025 to 2030. The segmental growth is driven by several key factors, including continuous technological advancements that enhance detection limits, accuracy, and analysis speed. The increasing demand from the biotechnology sector, particularly in proteomics and genomics, underscores mass spectrometry's critical role in studying complex biological systems. In addition, regulatory pressures in industries such as pharmaceuticals, food production, and environmental monitoring necessitate reliable analytical methods to comply with stringent quality and safety standards.
Regional Insights
North America dominated the process spectroscopy market with the largest revenue share of 38.2% in 2025. The integration of AI and machine learning algorithms with process spectroscopy tools is another key trend in North America. AI can improve data analysis accuracy, automate decision-making, and optimize production processes. This is particularly beneficial in industries like pharmaceuticals, where maintaining consistent product quality is essential. The increasing availability of advanced data analytics platforms is pushing manufacturers to adopt AI-powered spectroscopy solutions. Furthermore, North American companies are investing heavily in AI to maintain a competitive edge in global markets.
 To learn more about this report, Download Free Sample Report
 U.S. Process Spectroscopy Market Trends
The process spectroscopy market in the U.S. held the largest share in the North America region in 2025. The chemical and petrochemical industries in the U.S. are increasingly adopting process spectroscopy solutions for optimizing production workflows and enhancing safety protocols. With rising demand for high-purity chemicals and stricter environmental regulations, spectroscopy technologies are becoming essential for real-time quality control, which is further driving the market expansion.
Europe Process Spectroscopy Market Trends
Europe process spectroscopy industry is expected to grow at a CAGR of over 10% from 2025 to 2030. Europe’s pharmaceutical sector is embracing process spectroscopy for its ability to ensure compliance with strict quality standards, reduce production time, and enhance product safety. Spectroscopic techniques like Raman spectroscopy and near-infrared (NIR) spectroscopy are being used to monitor critical manufacturing parameters in real time. The European Medicines Agency (EMA) supports the use of PAT systems, which is fueling growth in this area.
The process spectroscopy industry in the UK is expected to grow at a significant rate in the coming years. The UK is undergoing a significant push toward digital transformation, and process spectroscopy is playing a key role in this shift. In industries such as pharmaceuticals, food and beverage, and chemicals, the digitalization of quality control processes through real-time spectroscopic analysis is gaining momentum. The government’s support for Industry 4.0 initiatives is encouraging manufacturers to adopt advanced analytical technologies to improve productivity and reduce costs.
The Germany process spectroscopy industry is characterized by the rise of smart factories and Industry 4.0 technologies, which is pushing the demand for real-time, high-precision data that can optimize production lines. Spectroscopy is used in conjunction with automated systems for inline measurements of raw materials and finished products. This integration improves overall process efficiency, reduces human error, and ensures high-quality standards are met. German industries are leading the charge in automation, and process spectroscopy plays a central role in this transformation.
Asia Pacific Process Spectroscopy Market Trends
Asia Pacific process spectroscopy industry is expected to grow at the fastest CAGR of over 12% in 2024. Environmental concerns are pushing countries across the Asia Pacific to adopt process spectroscopy for pollution monitoring and regulation compliance. Spectroscopic techniques are used to detect and quantify pollutants in air, water, and soil in real time. As industrialization accelerates in countries such as China and India, there is a heightened need for stringent environmental monitoring to mitigate pollution risks. Governments are tightening regulations, which is driving the adoption of process spectroscopy as an effective tool for maintaining compliance. This trend is expected to grow as environmental awareness increases and regulatory requirements become more stringent.
The Japan process spectroscopy industry is gaining traction as process spectroscopy is becoming increasingly essential for quality control and material analysis in semiconductor manufacturing. Japan is home to several major electronics and semiconductor manufacturers, and the demand for precision in production processes is high. Spectroscopic techniques like Raman spectroscopy and FTIR are being employed for inspecting raw materials, detecting defects in microelectronics, and ensuring consistent quality in final products.
The China process spectroscopy industry is rapidly expanding, driven by the growing demand for safe, high-quality food products is driving the adoption of process spectroscopy. Spectroscopic techniques are being used in agriculture to monitor crop quality and ensure food safety during production. In the food and beverage industry, spectroscopy is used for quality control during production processes to maintain high standards. As food safety regulations become more stringent, the need for precise and reliable analytical tools is rising. This trend is expected to continue, particularly as China seeks to modernize its agricultural and food production sectors.
Key Process Spectroscopy Company Insights
Some of the key players operating in the market include ABB Ltd. and Agilent Technologies, Inc., among others.
-
ABB Ltd. is a multinational electrical engineering corporation that specializes in electrification, automation, and robotics, providing innovative solutions to enhance efficiency and sustainability across various industries. The company leverages its extensive engineering expertise to offer advanced automation solutions and digital services, positioning itself to meet the growing demand for cost-effective and efficient engineering solutions amid increasing competition in the sector.
-
Agilent Technologies, Inc. is a global player in the fields of life sciences, diagnostics, and applied markets. The company aims to enhance the quality of life by focusing on six key markets: food safety, environmental monitoring, pharmaceuticals, diagnostics, chemicals and advanced materials, and research. The company offers a comprehensive portfolio of spectroscopy instruments and software designed to meet the specific needs of industries such as pharmaceuticals, chemicals, food and beverage, and environmental monitoring.
HORIBA Group and Yokogawa Electric Corporation are some of the emerging market participants in the process spectroscopy industry.
-
HORIBA Group is a prominent manufacturer of precision instruments for measurement and analysis, widely recognized for its significant contributions across various sectors, including automotive testing, environmental monitoring, medical diagnostics, semiconductor manufacturing, and scientific research.
-
Yokogawa Electric Corporation specializes in providing advanced solutions for various industries, including oil and gas, chemicals, pharmaceuticals, and food processing. The company offers innovative products such as Tunable Diode Laser Spectrometers (TDLS) and process gas chromatographs that enable real-time analysis of gases and liquids, enhancing operational efficiency and safety.
Key Process Spectroscopy Companies:
The following key companies have been profiled for this study on the process spectroscopy market.
-
ABB Ltd.
-
Agilent Technologies, Inc.
-
Bruker Corporation
-
BÜCHI Labortechnik AG
-
Danaher Corporation
-
Endress+Hauser Group Services AG
-
FOSS
-
HORIBA Group
-
Sartorius AG
-
Shimadzu Corporation
-
Thermo Fisher Scientific Inc.
-
Yokogawa Electric Corporation
Competitive Benchmarking
Category
Operating Strategies
Competitive Edge
Weakness
Established Players (ABB Ltd., Agilent Technologies, Inc., Danaher Corporation)
- Established Players focus on expanding integrated spectroscopy portfolios through automation, software, and analytics partnerships.
- Invest heavily in R&D to deliver advanced, real-time process-monitoring solutions.
- Strong global presence, extensive installed base, and proven analytical expertise.
- Ability to provide comprehensive spectroscopy solutions with high accuracy and reliability.
- Dependence on established product platforms can slow the adoption of emerging technologies.
- Large organizational structures may reduce flexibility against specialized spectroscopy competitors.
Emerging Players (HORIBA Group and Yokogawa Electric Corporation)
- Focus on developing specialized spectroscopy platforms for niche analytical monitoring applications.
- Invest in AI-enabled analytics capabilities to enhance process measurement accuracy.
- A strong focus on innovation enables rapid development of advanced spectroscopy solutions.
- Ability to offer flexible, application-specific systems tailored to evolving requirements.
- A limited global presence can limit access to large-scale customer opportunities.
- Smaller financial resources may constrain product development and commercialization activities.
Recent Developments
-
In January 2025, Yokogawa Electric Corporation introduced the AQ6377E Optical Spectrum Analyzer, which provides fast and accurate mid-wave infrared measurements. This release further emphasizes Yokogawa's focus on innovative measurement solutions that support diverse industries and applications. These developments underscore the company's ongoing efforts to lead in the field of analytical instrumentation and contribute to advancements in technology for industrial processes.
-
In January 2025, ABB Ltd. partnered with Sage Geosystems to explore and develop geothermal energy opportunities, aiming to advance sustainable energy solutions. This collaboration focuses on integrating ABB's expertise in electrification and automation with Sage Geosystems' innovative geothermal technologies.
-
In February 2024, Unity’s digital twin professional services arm was acquired by Capgemini Services SAS to accelerate enterprises' digital transformation through real-time 3D technology. This acquisition will enhance Capgemini's capabilities in helping businesses leverage digital twins, which are virtual representations of physical assets, to improve operations, optimize processes, and create new business models using immersive and interactive experiences.
Process Spectroscopy Market Report Scope
Report Attribute
Details
Market size in 2025
USD 24.7 billion
Estimated market size in 2026
USD 27.1 billion
Projected market size by 2033
USD 52.5 billion
Growth rate
CAGR of 9.9% from 2026 to 2033
Base year for estimation
2025
Historical data
2021 - 2024
Forecast period
2026 - 2033
Quantitative units
Revenue in USD billion, and CAGR from 2026 to 2033
Report coverage
Revenue forecast, company ranking, competitive landscape, growth factors, and trends
Segments covered
Component, technology, application, and region
Regional scope
North America; Europe; Asia Pacific; Latin America; MEA
Country scope
U.S.; Canada; Mexico; U.K.; Germany; France; China; Japan; India; South Korea; Australia; Brazil; Saudi Arabia; UAE; South Africa
Key companies profiled
ABB Ltd.; Agilent Technologies; Inc.; Bruker Corporation; BÜCHI Labortechnik AG; Danaher Corporation; Endress+Hauser Group Services AG; FOSS; HORIBA Group; Sartorius AG; Shimadzu Corporation; Thermo Fisher Scientific Inc.; Yokogawa Electric Corporation.
Customization scope
Free report customization (equivalent up to 8 analysts' working days) with purchase. Addition or alteration to country, regional & segment scope.
Pricing and purchase options
Avail customized purchase options to meet your exact research needs. Explore purchase options
Global Process Spectroscopy Market Report Segmentation
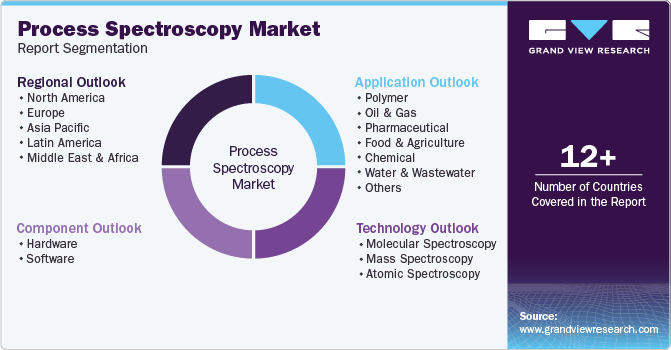
This report forecasts revenue growth at global, regional, and country levels and provides an analysis of the latest technological trends in each of the sub-segments from 2021 to 2033. For this study, Grand View Research has segmented the global process spectroscopy market report based on component, technology, application, and region:
 To learn more about this report, Download Free Sample Report
 -
Component Outlook (Revenue, USD Million, 2021 - 2033)
-
Hardware
-
Software
-
-
Technology Outlook (Revenue, USD Million, 2021 - 2033)
-
Molecular Spectroscopy
-
NIR
-
FT-IR
-
Raman
-
NMR
-
Others
-
-
Mass Spectroscopy
-
Atomic Spectroscopy
-
-
Application Outlook (Revenue, USD Million, 2021 - 2033)
-
Polymer
-
Oil & Gas
-
Pharmaceutical
-
Food & Agriculture
-
Chemical
-
Water & Wastewater
-
Pulp & Paper
-
Metal & Mining
-
Others
-
-
Regional Outlook (Revenue, USD Million, 2021 - 2033)
-
North America
-
U.S.
-
Canada
-
Mexico
-
-
Europe
-
UK
-
Germany
-
France
-
-
Asia Pacific
-
China
-
Japan
-
India
-
South Korea
-
Australia
-
-
Latin America
-
Brazil
-
-
Middle East & Africa
-
Saudi Arabia
-
South Africa
-
UAE
-
-
Research Methodology
The process spectroscopy market figures in this report are based on a proven research process that combines executive interviews with secondary research from proprietary databases, company filings, and recognized regulatory and institutional sources. Market size is built through value-chain sizing - reconciling supply-side and demand-side estimates - and triangulated with bottom-up and top-down approaches. Every estimate passes multiple levels of expert validation before publication, with each process spectroscopy segment quantified using the revenue-capture definitions in the table below.
Segment Definition
Segment - Component
Revenue capture definition
Hardware
Revenue is generated through spectrometers, analyzers, sensors, probes, detectors, sampling systems, and other physical instrumentation used for real-time process monitoring and analytical measurement. This segment is driven by increasing adoption of automated process control systems, demand for continuous quality verification, and growing investments in advanced manufacturing infrastructure.
Software
Revenue is captured through spectroscopy software platforms that support data acquisition, chemometric modeling, process visualization, predictive analytics, calibration management, and regulatory compliance. This segment is driven by rising demand for data-driven decision-making, integration with industrial automation systems, and advancements in artificial intelligence-enabled analytical tools.
Segment - Technology
Revenue capture definition
Molecular Spectroscopy
Revenue is generated through technologies such as Near-Infrared (NIR), Raman, Fourier Transform Infrared (FTIR), and UV-Visible spectroscopy, which are used to analyze molecular composition and chemical properties. This segment is driven by increasing demand for non-destructive testing, real-time process monitoring, and continuous quality assurance across production environments.
Mass Spectroscopy
Revenue is captured through mass spectrometry solutions that identify and quantify chemical compounds based on molecular mass characteristics. This segment is driven by growing requirements for highly sensitive analytical measurements, trace-level detection capabilities, and advanced process characterization applications.
Atomic Spectroscopy
Revenue is generated through analytical systems that determine elemental composition by measuring interactions between electromagnetic radiation and atoms. This segment is driven by increasing demand for elemental analysis, contamination detection, material verification, and quality control applications requiring high analytical precision.
Segment - Application
Revenue capture definition
Polymer
Revenue is generated through process spectroscopy solutions used to monitor polymerization reactions, material composition, product consistency, and manufacturing parameters. This segment is driven by increasing demand for quality control, process optimization, and real-time monitoring of complex polymer production processes.
Oil & Gas
Revenue is captured through spectroscopy technologies used for hydrocarbon analysis, composition measurement, refining optimization, and process monitoring. This segment is driven by the need for operational efficiency, product quality assurance, regulatory compliance, and enhanced process visibility throughout production operations.
Pharmaceutical
Revenue is generated through spectroscopy systems used for raw material verification, process analytical technology (PAT), continuous manufacturing, and quality assurance activities. This segment is driven by stringent regulatory requirements, increasing adoption of real-time release testing, and growing focus on manufacturing consistency.
Food & Agriculture
Revenue is captured through analytical solutions used to evaluate moisture content, ingredient composition, product authenticity, nutrient levels, and quality parameters. This segment is driven by increasing food safety requirements, quality assurance initiatives, and demand for rapid non-destructive testing methods.
Chemical
Revenue is generated through spectroscopy technologies used for reaction monitoring, material characterization, process optimization, and product quality verification. This segment is driven by the need to improve production efficiency, reduce waste generation, and maintain consistent product specifications.
Water & Wastewater
Revenue is generated through process spectroscopy systems used to monitor contaminants, chemical concentrations, organic compounds, and water quality parameters. This segment is driven by growing environmental monitoring requirements, regulatory compliance obligations, and increasing investments in water treatment infrastructure.
Pulp & Paper
Revenue is generated through spectroscopy solutions used to monitor raw material quality, chemical usage, moisture levels, coating properties, and production efficiency. This segment is driven by the need to optimize processes, reduce costs, and improve product consistency across manufacturing operations.
Metal & Mining
Revenue is generated through spectroscopy technologies used for elemental analysis, ore characterization, mineral identification, and process control. This segment is driven by increasing demand for resource optimization, quality assessment, operational efficiency, and accurate material composition analysis.
Others
Revenue is generated through process spectroscopy applications across sectors such as biotechnology, semiconductor manufacturing, environmental testing, energy production, advanced materials, and research facilities. This segment is driven by the expanding adoption of real-time analytical technologies, increasing automation initiatives, and growing demand for precise process-monitoring capabilities.
Estimation Model
Layer Name
Key Question
Description
Process Monitoring Demand Base Layer
Who are the potential adopters?
Identifies the total addressable user base, including pharmaceutical manufacturers, chemical producers, food processing companies, oil & gas operators, polymer manufacturers, and advanced material manufacturers seeking real-time analytical monitoring, process optimization, quality assurance, and regulatory compliance solutions.
Analytical Infrastructure Readiness Layer
Who can implement process spectroscopy solutions?
Adoption is determined by factors such as manufacturing automation maturity, availability of process control infrastructure, investment capacity, digitalization initiatives, availability of analytical expertise, regulatory requirements, and organizational willingness to implement advanced spectroscopy-based monitoring technologies.
Deployment Layer
Who actively deploys process spectroscopy solutions?
Applies adoption levels across operational environments where process spectroscopy technologies are actively utilized, including continuous manufacturing facilities, production lines, process control systems, raw material inspection stations, chemical processing plants, mining facilities, and automated manufacturing environments.
Revenue Generation Layer
How is revenue generated?
Revenue is generated through sales of spectroscopy instruments, analyzers, probes, sensors, detectors, process monitoring systems, spectroscopy software platforms, chemometric analytics solutions, calibration tools, installation services, maintenance contracts, validation services, and long-term service agreements.
Delivered Customizations
This report has been delivered with the following In-depth customizations
Client Request
Customization Delivered
Value Adds
Process Spectroscopy Deployment Assessment & Analytical Monitoring Feasibility Evaluation
Conducted detailed evaluation of process spectroscopy solutions across pharmaceutical, chemical, food & beverage, oil & gas, polymer, water treatment, and mining applications, integrating NIR spectroscopy, mass spectroscopy technologies, chemometric modeling platforms, and automated process monitoring capabilities to optimize production performance.
Enables enhanced process visibility, improves product consistency, reduces operational variability, and strengthens real-time quality assurance capabilities.
Industrial Process Control Integration Strategy
Assessed deployment of process spectroscopy technologies across manufacturing facilities, continuous production environments, process control systems, and digital manufacturing infrastructures, integrating automation platforms, cloud-based monitoring tools, predictive maintenance frameworks, and centralized process management solutions.
Enhances operational efficiency, improves process control accuracy, supports regulatory compliance, and enables data-driven manufacturing decisions.
AI-Enabled Process Analytics Optimization & Spectroscopy Infrastructure Planning
Evaluated implementation of advanced spectroscopy platforms, AI-driven chemometric analytics, predictive process monitoring systems, digital twin integration capabilities, automated calibration solutions, and centralized analytical data management platforms for real-time production intelligence and process optimization.
Enables scalable analytical capabilities, improves measurement accuracy, increases production reliability, and supports intelligent manufacturing transformation initiatives.
Frequently Asked Questions About This Report
The global process spectroscopy market size was valued at USD 24.7 billion in 2025 and is estimated at USD 27.1 billion for 2026.
The global process spectroscopy market is expected to grow at a CAGR of 9.9% from 2026 to 2033, reaching USD 52.5 billion by 2033.
North America dominated with a 38.2% revenue share in 2025.
Some key players operating in the process spectroscopy market include Bruker, ABB Group, Buchi Labortechnik AG, Danaher Corporation, Sartorius AG, and Shimadzu Corporation.
Key drivers of market expansion include increasing awareness of the importance of quality food and drugs and implementing government regulations and standards by relevant organizations. Spectroscopy-enabled solutions offer the capability to analyze, monitor accurately, and control processes while also enabling the identification of defects in product materials
The Asia Pacific is the fastest-growing region with a CAGR of over 12.9% from 2026 to 2033.
The molecular spectroscopy segment led with a 45.3% revenue share in 2025, while the mass spectroscopy is the fastest-growing segment.
The pharmaceutical segment led with a 32.1% revenue share in 2025.
The hardware segment led with a 77.0% revenue share in 2025, while software is the fastest-growing segment.
About the Author(s)
Next Generation Technologies Research Team
Technology · Next Generation TechnologiesThis report was authored by the next generation technologies research team at Grand View Research - comprising two research analysts, one senior research analyst, and one industry expert - with specialized expertise in the next generation technologies segment of the technology industry. All findings are based on proprietary technology databases, executive interviews, and regulatory analysis, subject to internal peer review prior to publication.
Last Updated:
Speak to Analyst

Customize this report to your needs - add regions, segments, or data points, with 20% free customization.
Or view our licence options:


ISO 9001:2015 & 27001:2022 Certified
We are GDPR and CCPA compliant! Your transaction & personal information is safe and secure. For more details, please read our privacy policy.


