
- Home
- »
- Research
- »
-
Freight Monthly Pricing Data & Analysis – September 2026
![Freight Monthly Price Assessment – September 2026Report]()
Freight Monthly Price Assessment – September 2026
Ocean Freight & Container Index (World Container Index, 20 Feet Container, 40 Feet Container), Dry Bulk & Commodity Freight (Breakbulk Port-to-Port, Coal Freight, Ferrous Scrap Freight Supramax, Iron Ore Freight)
Freight Pricing Intelligence - Executive Summary
September’s freight market reflected differing conditions across shipping routes and vessel categories. Container rates on major Asia–Europe routes softened towards month-end, while transpacific pricing remained more resilient. The World Container Index stood at USD 4,468 per 40-foot container on September 24, down 1% from the previous week. Changes in sailing capacity continued to influence pricing as carriers prepared their networks for China’s early-October holiday period.
Operational disruption remained an important influence on shipment reliability. East Asian ports continued recovering from weather-related delays, with improvements in vessel movements emerging during the second half of September. However, interrupted rotations and uneven recovery across terminals complicated connections between services. For containerized and breakbulk shipments, fuel surcharges also remained a separate component of freight costs, with revised charges taking effect on selected Pacific trades during the month.
Access real-time price trends for 200 commodities across key geographies,
Get Free Access
Explore Grand View Signal with a Free Account.Dry-bulk freight showed a stronger Atlantic market alongside more variable Pacific conditions. Tighter vessel availability supported larger bulk carriers in the Atlantic, while smaller-vessel performance depended more closely on regional cargo demand. European scrap shipments provided pockets of strength, although the broader Supramax market remained subdued late in the month. The resulting freight environment rewarded flexibility over loading dates and vessel selection, particularly where charterers could avoid competition for ships available at short notice.
Key Price Developments & Insights
-
The September 24 container assessment showed Shanghai–Los Angeles rates rising 2% week on week, while Shanghai–New York remained unchanged. Shanghai–Rotterdam and Shanghai–Genoa declined by 4% and 5%, respectively, highlighting the different pricing conditions across major trades.
-
Selected Asia–Europe services returned to the Suez Canal, shortening their rotations compared with Cape of Good Hope routings. The changes were limited to individual services, with security conditions continuing to influence wider network decisions.
-
September fuel-surcharge revisions covered both containers and breakbulk cargo on selected Pacific services. Charges varied by direction and cargo unit, retaining a distinct fuel-cost component alongside negotiated base freight.
-
Atlantic Capesize and Panamax conditions strengthened as cargo enquiries increased against tighter vessel availability. Pacific performance was less consistent, producing different cost pressures for coal and iron-ore shipments according to loading region and voyage timing.
-
European scrap demand supported Mediterranean-bound employment for smaller bulk carriers late in September. This provided localized strength within a broadly flat Supramax market, where conditions differed considerably between loading areas.
Top Performing Freight Commodity
-
Top Mover: Coal Freight
-
Average MoM Growth (top 3 geographies): 12.3%
-
Volatility Level: Elevated
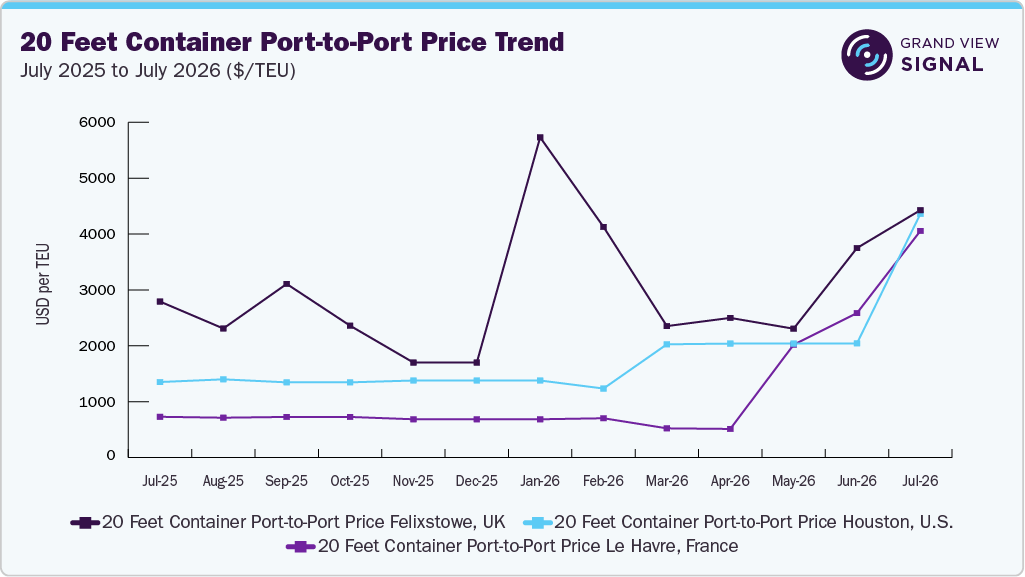
Ocean Freight & Container Index – Pricing Trends, September 2026
Container pricing became increasingly dependent on the trade lane as September progressed. Softer Asia–Europe quotations offered some relief for importers, while transpacific rates held firmer. For 20-foot and 40-foot bookings, the commercial outcome continued to depend on available sailings, equipment, and the balance of cargo moving in each direction. Revised September surcharges on selected Pacific services illustrated how these additional charges could remain material even where the underlying freight negotiation was competitive.
![Grand View Signal]() Pricing Intelligence Platform
Pricing Intelligence Platform- Real-time price trends and movements for 200 commodities
- Latest and impact-making market drivers
- Geographic coverage across key countries
- Impact and Forecasting based on Geopolitical Scenarios
- Historic pricing data from the past 10 years
Dry Bulk & Commodity Freight – Pricing Trends, September 2026
Breakbulk freight had a different cost structure as shipment dimensions, lifting requirements and vessel suitability influenced the base quotation, while fuel adjustments added to the payable amount. Coal, iron-ore, and ferrous-scrap freight faced different regional conditions. Atlantic cargo activity supported larger-vessel employment, while Pacific iron-ore freight lost momentum towards the end of the September 21–25 trading week. Coal-related vessel demand varied across Indonesian and Australian loading areas. European scrap movements provided support for Mediterranean-bound ships, although this strength was not shared evenly across the smaller-bulk fleet. For charterers, the availability of a suitable vessel within the required loading window remained central to the negotiated voyage cost.
Freight Pricing - Key Drivers
-
Sailing availability shaped container negotiations ahead of Golden Week - Carrier capacity management remained important as the market approached China’s early-October holidays. Announced sailing cancellations increased on both transpacific and Asia–Europe routes towards the end of September. Removing a departure concentrates bookings onto the remaining vessels and reduces flexibility for shipments with fixed delivery dates. Its pricing effect depends on how much cargo is available to fill those departures. The commercial implication is that a lower headline quotation can coexist with limited choice over the sailing date. For time-sensitive cargo, the cost of missing a connection or waiting for the next vessel may outweigh a modest saving on base freight. Booking conditions therefore remained closely linked to the specific service and shipment window.
Selective Suez returns changed voyage economics - The return of selected services to the Suez Canal introduced another variable into Asia–Europe shipping economics during September. A shorter voyage reduces the number of vessel days needed to complete a rotation and can release capacity over subsequent sailings. It also changes fuel consumption and the timing of vessel arrivals. However, the September service update confirmed only selective Suez returns, leaving different route arrangements across the network. For cargo owners, this creates a wider range of transit-time and cost combinations between competing services. The benefit depends on the actual itinerary, connecting schedules and reliability of the offered departure. Further normalization could improve vessel productivity, while renewed disruption would quickly absorb that capacity again.
Asian weather disruption affected connections and equipment circulation - Weather-related disruption continued to affect Asian shipping schedules, although September’s second-half operational updates reported gradual improvements in port performance and vessel flows. Recovery across a shipping network takes longer than the reopening of an individual terminal. Delayed vessels can arrive close together, while containers miss their intended onward services and equipment returns later than planned. These effects increase the importance of available connections for both 20-foot and 40-foot shipments. The likely cost exposure is greatest where cargo has limited routing alternatives or a narrow delivery window. Improving vessel flow offered some relief, but the pace of recovery remained important to booking flexibility and the ability to restore regular departures across interconnected Asian services.
Get in-depth driver impact analysis on freight prices.
Request Access
Access Grand View Signal.-
European inland constraints complicated total transport costs - Low Rhine water levels restricted barge transport during September, adding pressure to supply chains connecting maritime gateways with inland industrial customers. Reduced carrying capacity increases the number of vessel movements needed to transport a given cargo volume and can encourage a shift towards rail or road. The commercial consequence extends beyond the ocean quotation: importers may face higher inland costs or less predictable collection schedules even when seaborne freight becomes cheaper. For bulk commodities, the impact depends on parcel size, alternative transport availability, and the receiving plant’s location. These conditions increased the value of flexible delivery arrangements and adequate storage, particularly for businesses dependent on regular movements between coastal terminals and Rhine-linked destinations.
Cargo concentration and vessel positioning drove dry-bulk differences - Dry-bulk pricing remained sensitive to where vessels were available relative to the next cargo programme. Late September market reports showed stronger Atlantic conditions for larger bulk carriers, supported by tighter tonnage and increased cargo activity. This matters because a ship positioned near the loading area can offer different voyage economics from one requiring a lengthy ballast passage. Coal and iron-ore freight also respond to parcel size and voyage distance, while scrap movements compete for suitable smaller vessels and loading windows. The implication for chartering costs is that changes in commodity demand do not translate uniformly into freight movements. A concentrated run of cargoes can strengthen a local market even when conditions elsewhere remain balanced.
Freight - Commodity Coverage
Ocean Freight & Container Index
Coverage comprises 20-foot container port-to-port prices, 40-foot container port-to-port prices, and the World Container Index. Container quotations reflect the interaction of sailing capacity, equipment availability, and directional cargo demand. Breakbulk pricing additionally depends on the shipment’s weight, dimensions, handling requirements, and suitability for the available vessel. September’s commercial environment placed particular importance on the relationship between the base freight quotation, applicable surcharges, and the reliability of the offered transport arrangement.
Ocean Freight & Container Indices - Key influencers
-
Available departures and connections within the required shipment window.
-
Container availability and the balance of inbound and outbound cargo.
-
Fuel adjustments and other applicable voyage charges.
Get historical, current, and forecast ocean freight & container index price assessments.
Request Access
Access Grand View Signal.Dry Bulk & Commodity Freight
Coverage includes breakbulk port-to-port prices, coal freight, iron-ore freight, and Supramax freight for ferrous-scrap shipments. These markets depend on cargo availability, vessel positioning and the time required to complete each voyage. Freight per ton is also influenced by the quantity loaded and the efficiency of loading and discharge operations. Different vessel sizes and trading areas create distinct pricing conditions, making local cargo competition and the availability of suitable ships important determinants of chartering costs.
Dry Bulk & Commodity Freight - Key influencers
-
Cargo volumes and the timing of loading programmes.
-
Vessel availability near the loading port.
-
Voyage distance, ballast requirements, and bunker consumption.
-
Port restrictions, handling rates, and time spent waiting.
Get historical, current, and forecast dry bulk & commodity freight price assessments.
Request Access
Access Grand View Signal.Gateway & Route Performance Commentary
Houston, US - Houston’s September port update emphasized channel planning, export development, and discussions with carriers on capacity and operational efficiency. Truck access remained central to cargo movement, with the port reporting that 99% of its containers move by road. This makes terminal collection and delivery arrangements commercially important alongside ocean service availability. Channel maintenance and improved management of potential draft restrictions also remained relevant to the port’s ability to accommodate cargo growth over time.
Felixstowe, UK - Fuel-related terminal charges remained part of Felixstowe’s import cost structure. A September notice announced an increase in the emergency fuel surcharge from GBP 3.82 to GBP 4.13 per laden import container, effective October 1. The announced change adds a modest cost to forthcoming arrivals. Its commercial significance lies in the accumulation of local charges alongside base freight, particularly for importers managing regular container volumes through the gateway.
Hamburg, Germany - Industrial action affected connections through Hamburg during September, adding uncertainty to cargo handovers and vessel schedules. For shipments moving through the gateway, disrupted terminal access can complicate the coordination of ocean arrivals with onward rail and road transport. The principal commercial exposure is therefore the timing of cargo availability and subsequent delivery. Importers with fixed production schedules remain more sensitive to these interruptions than those able to adjust collection dates.
Rotterdam, Netherlands - Rotterdam’s inland connections remained exposed to restrictions on Rhine navigation. For Rhine-bound cargo, limited barge capacity can weaken the benefit of a competitive ocean quotation by increasing the cost or complexity of onward transport. The effect varies with the destination and the availability of alternatives. Bulk cargoes requiring regular inland deliveries are particularly sensitive to reduced carrying capacity, while container movements depend on the flexibility of rail, road, and barge arrangements.
Antwerp, Belgium - Belgian terminal operations recovered from earlier pilot-related waiting times as normal pilot availability resumed. This removed one source of disruption affecting vessel access and improved the immediate operating backdrop. For Antwerp-linked shipments, dependable vessel handling remains important to the coordination of onward cargo movements. The commercial benefit of improved access is greatest where a timely berth allows cargo to retain its planned connection and avoids an additional period in storage.
Get freight price assessment by gateway & route
Request Access
Access Grand View Signal.Genoa, Italy - The late-September decline in Shanghai–Genoa container pricing offered a more favorable ocean-freight backdrop for cargo on that route. The implications for individual shipments depend on the contracted service, departure date, and applicable local charges. For industrial and breakbulk cargo, vessel suitability and handling requirements remain additional cost determinants. Buyers with flexibility over shipment timing generally have more scope to compare available departures and negotiate the overall transport package.
Le Havre, France - Vessel-tracking data for September 20–26 indicated low anchorage congestion at Le Havre, providing a relatively favorable local backdrop for vessel arrivals. Limited waiting supports more predictable berth access, although onward delivery still depends on terminal processing and the availability of inland transport. For cargo owners, the potential benefit is reduced exposure to delays before discharge and greater confidence when coordinating collection with the vessel’s arrival.
Shanghai, China - Shanghai-linked shipments remained sensitive to the recovery of East Asian vessel schedules after weather disruption. The broader improvement in regional vessel flows during the second half of September was encouraging for service continuity. Nevertheless, connecting departures and equipment circulation remained important to individual bookings. For exporters with firm delivery commitments, the availability of a workable sailing and onward connection continued to influence the commercial value of a freight offer.
Busan, South Korea - A September network announcement retained Busan within a consolidated shuttle service linking North China and Southeast Asia, with transition sailings scheduled for late in the month. Changes of this kind alter the sequence and timing of cargo connections. Their commercial impact depends on how closely the revised rotation matches the shipment’s onward service. Busan’s role within the announced network therefore made connection timing an important consideration for affected bookings.
Yokohama, Japan - A September service notice identified a Yokohama call omission and offered transshipment through Busan for affected cargo. Such changes introduce an additional connection into the transport plan and can alter the delivery window. The impact is specific to the affected sailing, with the alternative service determining the eventual transit time. For cargo moving under firm delivery commitments, the reliability of that connection becomes an important part of the overall freight decision.
Analyst Commentary
"September’s freight market showed a clear divide between routes and vessel categories. Softer Asia–Europe container pricing offered some relief, while transpacific rates remained more resilient. In dry bulk, tighter Atlantic vessel availability supported larger carriers, and European scrap movements provided localized strength within a subdued Supramax market. These differences left limited scope for a uniform freight outlook. Fuel surcharges disrupted connections and inland transport constraints also affected the savings available from lower ocean quotations. Heading into October, holiday-related sailing adjustments and the recovery of Asian schedules will influence container availability. For bulk shipments, regional cargo demand and vessel positioning will remain central to freight negotiations, particularly where loading windows leave charterers few alternatives."
Senior Freight Analyst
Frequently Asked Questions
Coal freight emerged as the top-performing freight segment, outperforming its counterparts on the back of stronger price momentum.
Queensland to Dhamra route registered strongest performance in coal freight prices in September 2026.
Coal freight prices on the given route increased by over 13% on a MoM basis, indicating the demand premium post monsoon cycle.
Price movement remained elevated with recorded average of over 11% growth in the last three months.
![Key questions answered by the report]()
-



Coverage
Data Depth
200
Commodities
Multiple
Geographies
6 Months
Forecast
10 Years
Historic Data
Get Free Newsletter
This free newsletter offers a hint of our pricing commodity coverage encompassing executive summary, drivers, and scope of research.
Get FREE NewsletterTrusted pricing insights & Intelligence
See how Grand View Signal can support strategy and procurement teams, and why industry leaders rely on Grand View Research. Request a free demo or get your free access and explore our pricing intelligence platform.


