- Home
- »
- Nutraceuticals & Functional Foods
- »
-
Bioactive Ingredients Market Size & Share Report, 2030GVR Report cover
![Bioactive Ingredients Market Size, Share & Trends Report]()
Bioactive Ingredients Market (2023 - 2030) Size, Share & Trends Analysis Report By Product (Vitamin, Fiber), By Application (Functional Food & Beverages, Dietary Supplements), By Region (APAC, North America), And Segment Forecasts
- Report ID: GVR-1-68038-175-7
- Number of Report Pages: 115
- Format: PDF
- Historical Range: 2018 - 2021
- Forecast Period: 2023 - 2030
- Industry: Consumer Goods
- Report Summary
- Table of Contents
- Interactive Charts
- Methodology
- Download FREE Sample
-
Download Sample Report
Bioactive Ingredients Market Summary
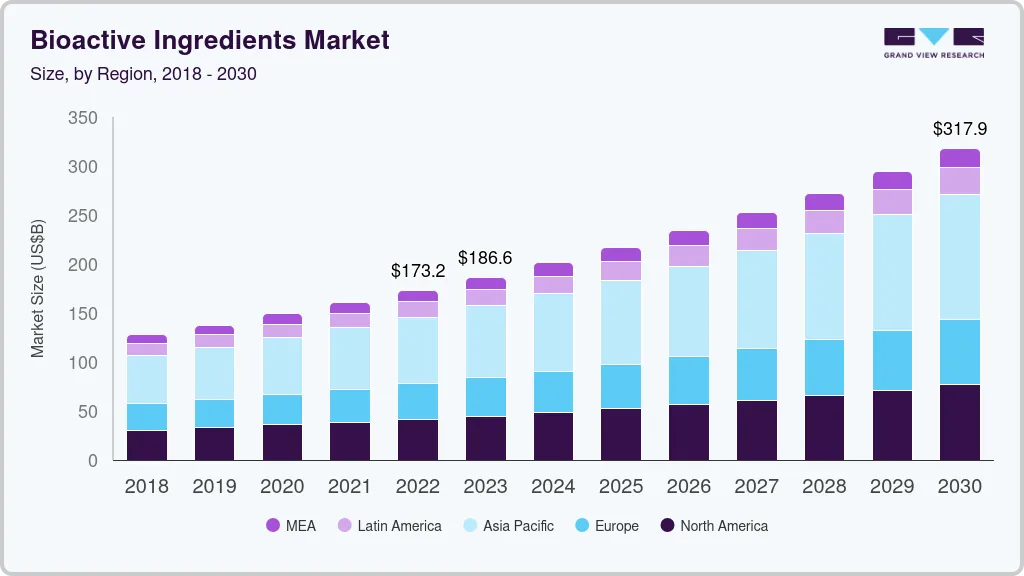
The global bioactive ingredients market size was estimated at USD 173,225.6 million in 2022 and is projected to reach USD 317,906.1 million by 2030, growing at a CAGR of 7.9% from 2023 to 2030. This is attributed to the growing demand for functional food and beverages owing to increasing consciousness among people about maintaining a balanced diet with a proper content of essential nutrients.
Key Market Trends & Insights
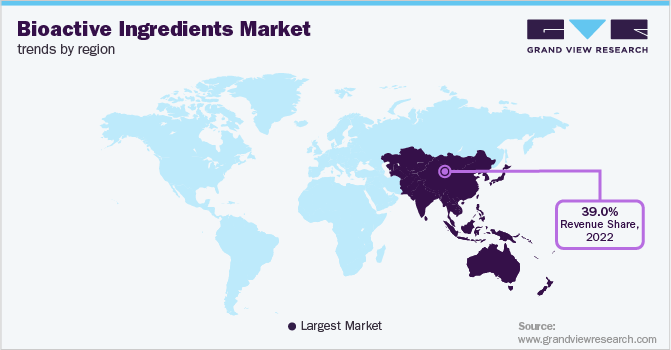
- In terms of region, Asia Pacific was the largest revenue generating market in 2022.
- Country-wise, India is expected to register the highest CAGR from 2023 to 2030.
- In terms of segment, fiber accounted for a revenue of USD 41,539.8 million in 2022.
- Omega 3 PUFA is the most lucrative product segment, registering the fastest growth during the forecast period.
Market Size & Forecast
- 2022 Market Size: USD 173,225.6 Million
- 2030 Projected Market Size: USD 317,906.1 Million
- CAGR (2023-2030): 7.9%
- Asia Pacific: Largest market in 2022
The industry offers lucrative growth opportunities to manufacturers of these compounds owing to their increasing usage in functional food and beverages, as well as in dietary supplements. Moreover, they are extensively used in the development of personal care products, such as shampoos, soaps, and moisturizers.

Products, such as carotenoids and flavonoids, protect the skin from adverse environmental effects. Bioactive ingredients are byproducts of a range of naturally extracted essential substances from fruits and vegetables. Carotenoids, flavonoids, polyphenols, etc. are some of the commonly used bioactive ingredients. BASF SE, Kemin Industries, Inc., Allied Biotech Corp., etc. are a few companies, which supply raw materials to product manufacturers. These raw material suppliers are highly dependent on the suppliers of plants, fruits, vegetables, and animal tissues for extracting essential ingredients. Bioactive ingredients are the key raw materials used in the production of functional food & beverages, dietary supplements, etc.
Bioactive ingredients, such as carotenoids, terpenoids, saponins, polyphenols, and phenolic compounds, are increasingly used for developing functional food & beverages and dietary supplements. The rising dependability of individuals on functional foods& beverages and dietary supplements to meet their nutritional requirements is anticipated to drive the industry growth.The COVID-19 pandemic led to many positive changes in the industry. The rapid increase in cases of infection propelled pharmaceutical manufacturers to carry out extensive R&D activities to develop medicines that could be effective against the virus. This augmented the product demand from the pharmaceutical industry. Moreover, researchers kept on identifying new plant-based ingredients that can fight against the virus.
Product Insights
The fiber product segment dominated the industry in 2022 and accounted for the highest share of more than 24.95% of the total revenue. This is attributed to the growing demand for fibers on account of the rising health consciousness and changing dietary habits of consumers. Its associated advantages like the prevention of diabetes, obesity, and other chronic degenerative ailments are increasing the demand for dietary fiber. In different foods and beverages, soluble dietary fiber is commonly used as a flavor-enhancing agent. They are also considered an alternative to fats and sugar in numerous food applications including confectionery goods, bakery products, and dairy desserts.
Furthermore, the development in R&D activities related to insulin and soluble fibers like polydextrose and pectin is expected to boost the market’s product portfolio or product offering in the coming years. Due to the rising functional food consumption, insoluble dietary fibers are being used more frequently. Insoluble dietary fibers from corn, rice, oats, wheat, potato, peas, and legumes also help prevent several health issues, including hyperglycemia, constipation, high cholesterol, and obesity. Proper intake of vitamins enhances collagen production, discourages melanin formation & pigmentation, and is helpful for toned skin. They can also be used to lighten and reduce wrinkling of the skin. Such advantages are expected to boost segment growth over the next eight years.
Application Insights
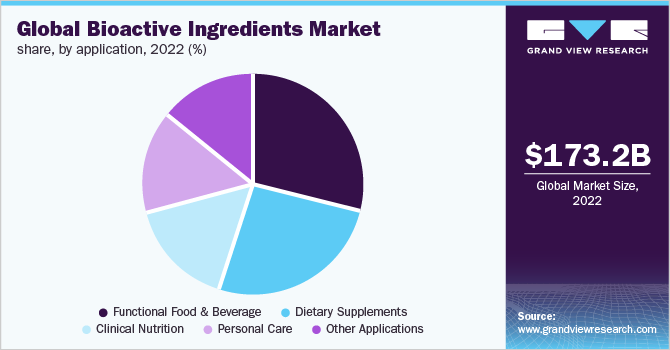
The functional food and beverage application segment dominated the industry in 2022 and accounted for the highest share of more than 29.25% of the overall revenue. Its high share is attributed to the growing interest in functional foods, the popularity of preventive healthcare, and a diverse product offering. Due to its inherent advantages, there has been growing awareness regarding preventive healthcare across the globe, and functional foods help consumers in implementing preventive healthcare. This factor, coupled with the available product portfolio of functional food items, is expected to aid the segment's growth. Functional food ingredients are typically found in forms that have been esterified, glycosylated, thiolylated, or hydroxylated.

Particularly, plant foods like whole grains, fruits, and vegetables are the main sources of bioactive food ingredients. Similar bioactive elements, such as conjugated linolenic, probiotics, acid, omega-3 polyunsaturated fatty acid, and bioactive peptides, are also present in animal products like milk, fermented milk products, and cold-water fish. The rising geriatric population in Australia and Asia-Pacific regions and growing lifestyle-related diseases like diabetes & bone problems will boost the market growth. In line with this, many consumers are becoming more aware of the significance of healthy eating and better lifestyle choices. Awareness about functional foods is growing in Malaysia, Singapore, India, and South Korea. In all eight of the major markets-India, China, Hong Kong, Indonesia, Japan, Malaysia, Singapore, and South Korea-functional foods and functional ingredients are expected to experience long-term growth.
Regional Insights
Asia Pacific dominated the industry in 2022 and accounted for the highest share of more than 39.00% of the overall revenue. This is attributed to the presence of several manufacturing companies in countries like China and India. In addition, the rising demand for functional ingredients in the region is anticipated to propel the market growth over the forecast period. Many manufacturers are extending their product lines in response to the rising demand for functional ingredients.

For instance, Chinese local producers have started producing highly refined EPA ingredients, like omega-3 algae, to increase their selection of bioactive ingredients. Strong growth in functional food & drink and dietary supplements is expected to be one of the major factors driving the demand for bioactive ingredients, such as omega-3, proteins, vitamins, probiotics, and others, in countries like Japan, where the population is aging at a rapid pace.
Key Companies & Market Share Insights
Global competition for bioactive ingredients is highly dependent on product quality, manufacturer and distributor numbers, and geographic locations. The manufacturers continuously conduct R&D to develop high-quality products. Manufacturers are constantly trying to enhance their portfolios by developing new products. For instance, to sell krill oil (from Neptune) and glucosamine (from Koyo), both companies came together to produce health supplements in Japan as well as other markets. Due to a shift in consumer preference toward products made from naturally sourced ingredients, top cosmetic companies from nations like Singapore, China, South Korea, and Japan are creating products with biological infusions. Some prominent players in the global bioactive ingredients market include:
-
Sabinsa
-
Archer Daniels Midland Company (ADM)
-
BASF SE
-
Cargill
-
Ingredion
-
Ajinomoto Co, Inc.
-
Owen Biosciences, Inc.
-
Mazza Innovation Ltd.
-
Nuritas
-
DuPont
Bioactive Ingredients Market Report Scope
Report Attribute
Details
Market size value in 2023
USD 186.58 billion
Revenue forecast in 2030
USD 317.90 billion
Growth rate
CAGR of 7.9% from 2023 to 2030
Base year for estimation
2022
Historical data
2018 - 2021
Forecast period
2023 - 2030
Quantitative units
Revenue in USD million/billion and CAGR from 2023 to 2030
Report coverage
Revenue forecast, company ranking, competitive landscape, growth factors, and trends
Segments covered
Product, application, region
Regional scope
North America; Europe; Asia Pacific; Central & South America; Middle East & Africa
Country scope
U.S.; Canada; Mexico; Germany; U.K.; France; Italy; Spain; China; India; Japan; South Korea; Brazil; Argentina; South Africa; Saudi Arabia
Key companies profiled
Sabinsa; Archer Daniels Midland Company (ADM); BASF SE; Cargill; Ingredion; Ajinomoto Co., Inc.; Owen Biosciences Inc.; Mazza Innovation Ltd.; Nuritas; DuPont
Customization scope
Free report customization (equivalent up to 8 analysts working days) with purchase. Addition or alteration to country, regional & segment scope
Pricing and purchase options
Avail customized purchase options to meet your exact research needs. Explore purchase options
Global Bioactive Ingredients Market Segmentation
This report forecasts revenue growth at global, regional, and country levels and provides an analysis of the latest industry trends in each of the sub-segments from 2018 to 2030. For the purpose of this study, Grand View Research has segmented the global bioactive ingredients market report on the basis of product, application, and region:

-
Product Outlook (Revenue, USD Million, 2018 - 2030)
-
Fiber
-
Vitamins
-
Omega 3 PUFA
-
Plant Extracts
-
Minerals
-
Carotenoids & Antioxidants
-
Probiotics
-
Other Ingredients
-
-
Application Outlook (Revenue, USD Million, 2018 - 2030)
-
Functional Food & Beverage
-
Dietary Supplements
-
Clinical Nutrition
-
Personal Care
-
Other Applications
-
-
Regional Outlook (Revenue, USD Million, 2018 - 2030)
-
North America
-
U.S.
-
Canada
-
Mexico
-
-
Europe
-
Germany
-
U.K.
-
France
-
Italy
-
Spain
-
-
Asia Pacific
-
China
-
India
-
Japan
-
South Korea
-
-
Central & South America
-
Brazil
-
Argentina
-
-
Middle East & Africa
-
Saudi Arabia
-
South Africa
-
-
Frequently Asked Questions About This Report
b. he global bioactive ingredients market size was estimated at USD 173.22 billion in 2022 and is expected to reach USD 186.58 billion in 2023.
b. The global bioactive ingredients market is expected to grow at a compound annual growth rate of 7.9% from 2023 to 2030 to reach USD 317.90 billion by 2030.
b. Asia Pacific dominated the bioactive ingredients market with a share of 39.1% in 2022. This is attributable to the strong growth in fortified/functional food & drink and dietary supplements in the region.
b. Some key players operating in the bioactive ingredients market include BASF, Cargill Inc., DuPont, Archer Daniels Misland Company, Ajinomoto Co. Inc., Ingredion Incorporated and Owen Biosciences Inc.
b. Key factors that are driving the market growth include growing health awareness coupled with increasing health concern among consumers. Furthermore, technological innovations such as microencapsulation are adopted for protecting bioactive ingredients from unwanted reactions and oxidation.
Share this report with your colleague or friend.
Need a Tailored Report?
Customize this report to your needs — add regions, segments, or data points, with 20% free customization.

ISO 9001:2015 & 27001:2022 Certified
We are GDPR and CCPA compliant! Your transaction & personal information is safe and secure. For more details, please read our privacy policy.
Trusted market insights - try a free sample
See how our reports are structured and why industry leaders rely on Grand View Research. Get a free sample or ask us to tailor this report to your needs.


