- Home
- »
- Renewable Energy
- »
-
Carbon Footprint Management Market Size Report, 2030GVR Report cover
![Carbon Footprint Management Market Size, Share & Trends Report]()
Carbon Footprint Management Market Size, Share & Trends Analysis Report By Deployment (On premise, Cloud), Type, End Use Regional Outlook, Competitive Strategies, And Segment Forecasts, 2024 - 2030
- Report ID: GVR-4-68040-159-0
- Number of Report Pages: 120
- Format: PDF, Horizon Databook
- Historical Range: 2018 - 2022
- Forecast Period: 2024 - 2030
- Industry: Energy & Power
Carbon Footprint Management Market Trends
The global carbon footprint management market size was valued at USD 11.06 billion in 2023 and is projected to grow at a compound annual growth rate CAGR of 9.2% from 2024 to 2030. Increasing concerns regarding detrimental effect of carbon emissions on environment have prompted adoption of carbon footprint management solutions. Various major companies have implemented carbon footprint tracking and management technology through pilot projects across various industries. This is attributed to ability of technology to serve as a large-scale solution for tracking and helping in CO2 emission reduction targets and climate control goals.

U.S. has the largest number of carbon capture and storage projects with 34 planned projects as of 2022. Moreover, according to U.S. Department of Energy, in recent past, the U.S. government started providing loans up to 80% of cost for nascent stage CCS projects. Growth in number of CCS project in the country is expected to propel demand for carbon footprint management solution.
The government also employed favorable policies and projects to boost CCS trends in economy such as the provision of tax incentives to stimulate CCS projects. Also, USDA Rural Utilities Service (RUS) facilitated direct loans and loan guarantees to power plants with a minimum of one CCS infrastructure. Support mechanisms employed by government in past including the Clean Coal Power Initiative Program, and the U.S. Recovery Act 2009 are also proving effective in boosting current carbon capture and storage trends.
Energy-intensive industries in U.S., such as iron and steel manufacturing, oil & gas, and cement, combust huge quantities of fossil fuels and account for significant carbon emissions. In addition to these combustion sources, natural gas operations produce concentrated CO2 by-products for which incremental cost of capture and compression is relatively low. Similarly, most of hydrogen utilized in ammonia manufacture, oil refining, and other industries is derived from the decarburization of fossil fuels, which also generates a by-product stream of CO2 and presents low-cost opportunities for CCS. Carbon footprint management solutions plays vital role in carbon capture and storage facilities with application to keep track of emissions from facility.
Market Dynamics
Increasing R&D and testing of several pilot projects are expected to lower cost of CCS technology and enhance its commercial viability. Low-carbon investment programs such as NER300 and NER400, which have provisions for financing large-scale commercial CCS pilot projects, have accelerated the market growth. Moreover, development of EU and Emissions Performance Standard (EPS) has majorly propelled carbon footprint management technology penetration. Provision of a cap-and-trade system, which puts a price on carbon emissions is stimulating CCS installations across several industries such as power generation, chemical processing, oil & gas, iron & steel, and others.
Cost of carbon footprint management varies widely. It depends on deployment technology whether it is to be added to an existing plant as a on premise or cloud, on type of power plant (such as a "supercritical" or "ultra-supercritical" coal plant or an "integrated gas combined cycle" plant), and on type of fuel (coal or natural gas). Cost of carbon footprint management technology along with new plant setup is very high, which may not prove to be a viable solution for many industry players as well as countries globally. Therefore, high cost of CCS is expected to restrain growth of the carbon footprint management market in near future.Deployment Insights
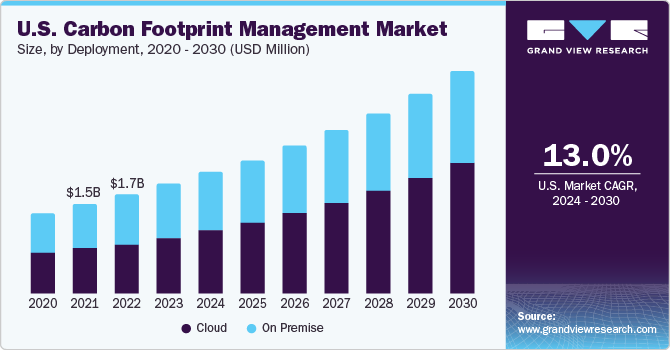
In 2023, cloud segment accounted for the largest market share with 55.94% of global carbon footprint market. Demand for cloud based carbon footprint management solutions is rising rapidly as adoption of cloud based software is trending across industries. Growth in demand is attributed to various benefits offered by cloud-based carbon management solutions which includes accessibility, scalability, and cost-effectiveness. Moreover, cloud based solutions offers remote access to real time critical environmental data, accessibility and convenience are the major factors responsible for wide adoption of remote carbon footprint management solutions around the world across various industries.
An on-premise Carbon Footprint Management system refers to a software solution for tracking, reporting, and managing carbon emissions and sustainability data that is installed and operated within an organization's own physical infrastructure. With increasing adoption of cloud based carbon footprint management software solutions across various industries on premise segment is expected have lower market share over forecast period.
Type Insights
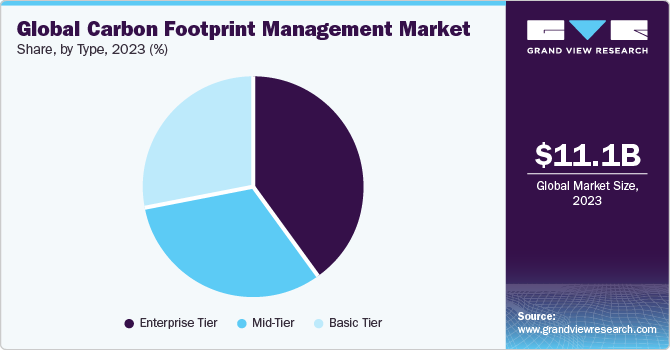
On the basis of type, the global carbon footprint market is further divided into basic-tier, mid-tier, and enterprise-tier. Enterprise-tier segment led the market in 2023 and accounted for 39.96% of global market. An Enterprise-tier carbon management system is a highly sophisticated and comprehensive software solution designed to cater to needs of large organizations with complex operations, extensive emissions profiles, and stringent reporting requirements. These systems provide advanced features and capabilities for tracking, measuring, and managing carbon emissions and sustainability data. Rising awareness for CO2 reduction in various industries at large scale pose lucrative demand for Enterprise-tier carbon footprint management.

Mid-tier segment accounted significant share of 32.1% in 2023. A mid-tier carbon footprint management system refers to a software solution that offers more comprehensive features and capabilities for tracking, measuring, and managing carbon emissions and sustainability data. Mid-tier carbon footprint management software is generally adopted by medium scale organizations with less geographical presence and less emission capacity as compared to large scale organizations.
End-User Insights
On basis of end-user, global carbon footprint market is further divided into energy and utilities, manufacturing, transportation, it and telecommunication, residential and commercial buildings. Energy and Utilities segment led the market in 2023 and accounted for 31.91% of global market.According to the International Energy Agency (IEA), global energy-related carbon dioxide emissions reached 36.8 Gt in 2022 owing to the oscillations in energy usage and CO2 emissions in 2021. Power sector accounted for two-thirds of emissions growth from previous year.
Due to high emission rates, carbon capture & storage potential is extremely high in coal-fired power plants.Coal-fired power plants are the most dominant emitters of carbon dioxide. Due to imposed restrictions on power plants, utilization of CCS facilities has become mandatory to reduce carbon emissions up to required standards which pose as a lucrative opportunity for growth of carbon footprint management solutions. Adoption of these technologies is necessary to potentially permit continued use of coal resources for power generation, whilst reducing CO2 emissions. Moreover, CCS facilities can be retrofitted to existing power plants without hampering their efficiency. Due to these factors, adoption of CCS and carbon footprint management technologies in Energy and Utilities industry is anticipated to grow over forecast period
Manufacturing industry accounted for a significant market share in 2023 owing to involvement of huge amount CO2 emissions in metal & cement manufacturing. Moreover, iron and steel industry accounted for 7% of all industrial CO2 emissions in 2021, according to the International Energy Agency (IEA) and the United Nations Industrial Development Organization (UNIDO). Following the recent trend, immense research & development is being conducted to reduce emissions, especially CO2, captured in the blast furnace.Post-combustion technologies are easily implemented to capture CO2 from flue gases escaping from sinter plants, and flue gas exiting the lime kiln, stove, coke oven plant, basic oxygen furnace, and blast furnace. On account of a wide range of CCS applications at various stages in the metal production industry, the market is expected to grow at a significant pace over forecast period.
In December 2022, ArcelorMittal invested approximately USD 209 million in its flagship CCS project to reduce carbon emissions at its steel plant in Ghent, Belgium. This initiative by the company is expected to reduce carbon emissions by 125,000 tons. Such new CCS facility launches in manufacturing industry are expected to drive demand for carbon footprint management solutions over forecast period.
Regional Insights
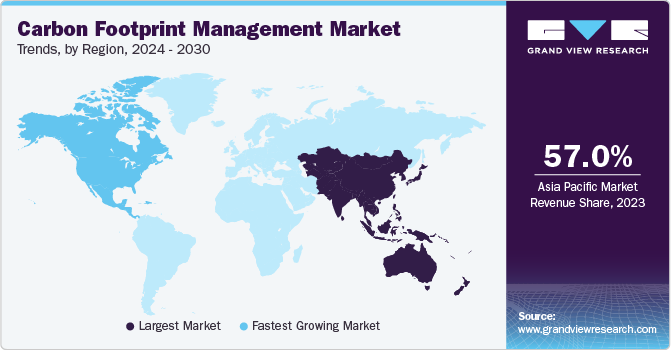
Asia Pacific accounted for a significant revenue share in 2023 of 57.01% of global market. Asia Pacific has suitable geological conditions for carbon sequestration. The National University of Japan and ExxonMobil conducted a geological condition feasibility test in Asia Pacific for carrying out carbon sequestration. ExxonMobil has set up a low-carbon solutions division in Asia. It is further planning to start a carbon capture and storage business in the region. The company estimates that approximately 300 billion tons of carbon storage capacity is available in Southeast Asia. In addition, according to the Japan Energy Center, Southeast Asia can reserve 300 billion tons of carbon dioxide. China, one of the largest carbon dioxide emitters in the world, is planning to double its capacity to capture and store carbon dioxide to reduce its contribution to global warming in coming years. The country has 14 carbon capture, utilization, and storage (CCUS) facilities with an annual capacity of 2.1 million tons. It aims to initiate eight large-scale CCUS projects by 2025. Huge adoption of carbon capture and storage systems is expected to drive the market over forecast period.

North American market is expected to grow at a significant pace in forecast period. North America is the largest market for CCS around globe. North American region is mainly dominated by U.S. which accounted for more than 79.78% share in the region in 2023. U.S. is front runner in technology implementation for CCS globally as the first CCS project in the world was started in 1978 by Searles Valley Minerals in a coal-based power plant located in the state of California.In August 2023, the U.S. Department of Energy (DOE) announced an investment of USD 1.2 billion to launch two new CCS facilities in Texas and Louisiana to reduce carbon emissions from the atmosphere using the direct air capture (DAC) process. DOE further aims to launch four DAC hubs in the country to reduce approx. 1 million tons of carbon emissions from the atmosphere. Rapid growth of CCS technology and favorable government initiative is expected propel market in the region.
Key Companies & Market Share Insights
Key participants in industry are focusing on technological advancements and innovation to keep track of CO2 emissions from various industries. In addition, industry players are practicing several strategic initiatives to expand their foothold in the market over coming years.
For instance, in September 2023, EcoVadis announced launch of carbon emission tracking solution to enable companies to track greenhouse gas emissions. The company aims to address carbon reduction strategies and emissions reporting for products and services across various industries.
Key Carbon Footprint Management Companies:
- Wolters Kluwer
- IBM Corporation
- Schneider Electric
- Dakota Software
- ENGIE
- IsoMetrix
- ProcessMAP
- Schneider Electric
- SAP
- Ecova
Carbon Footprint Management Market Report Scope
Report Attribute
Details
Market size value in 2024
USD 12.04 billion
Revenue forecast in 2030
USD 20.44 billion
Growth rate
CAGR of 9.2%from 2024 to 2030
Base year for estimation
2023
Historical data
2018 - 2022
Forecast period
2024 - 2030
Quantitative units
Revenue in USD Billion, and CAGR from 2024 to 2030
Report coverage
Revenue forecast, company ranking, competitive landscape, growth factors, and trends
Segments covered
Deployment, type, end-user, region
Region scope
North America; Europe; Asia Pacific; CSA; MEA
Country scope
U.S., Canada, Mexico, Germany, France, U.K., Spain, Italy, Netherlands, Norway, Denmark,China, India, Japan, Australia, South Korea, Singapore, Malaysia, Saudi Arabia, UAE, South Africa, Brazil, Argentina
Key companies profiled
Wolters Kluwer, IBM Corporation, Schneider Electric, Dakota Software, ENGIE, IsoMetrix, ProcessMAP, Schneider Electric, SAP, Ecova
Customization scope
Free report customization (equivalent up to 8 analyst’s working days) with purchase. Addition or alteration to country, regional, and segment scope.
Pricing and purchase options
Avail customized purchase options to meet your exact research needs. Explore purchase options
Global Carbon Footprint Management Market Report Segmentation
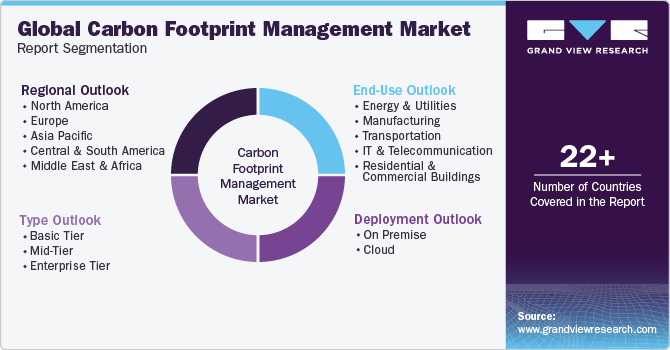
This report forecasts revenue growth at global, regional, and country levels and provides an analysis of the latest industry trends in each of the sub-segments from 2018 to 2030. For the purpose of this study, Grand View Research has segmented the global carbon footprint management market based on deployment, type, end-user and region:

-
Deployment Outlook (Revenue, USD Billion, 2018 - 2030)
-
On Premise
-
Cloud
-
-
Type Outlook (Revenue, USD Billion, 2018 - 2030)
-
Basic Tier
-
Mid-Tier
-
Enterprise Tier
-
-
End-Use Outlook (Revenue, USD Billion, 2018 - 2030)
-
Energy and Utilities
-
Manufacturing
-
Transportation
-
IT and Telecommunication
-
Residential and Commercial Buildings
-
-
Regional Outlook (Revenue, USD Billion, 2018 - 2030)
-
North America
-
U.S.
-
Canada
-
Mexico
-
-
Europe
-
Germany
-
France
-
U.K.
-
Spain
-
Italy
-
Netherlands
-
Norway
-
Denmark
-
-
Asia Pacific
-
China
-
India
-
Japan
-
Australia
-
South Korea
-
Singapore
-
Malaysia
-
-
Central & South America
-
Brazil
-
Argentina
-
-
Middle East and Africa
-
Saudi Arabia
-
UAE
-
South Africa
-
-
Share this report with your colleague or friend.
![gvr icn]()
NEED A CUSTOM REPORT?
We can customize every report - free of charge - including purchasing stand-alone sections or country-level reports, as well as offer affordable discounts for start-ups & universities. Contact us now
![Certified Icon]()
We are GDPR and CCPA compliant! Your transaction & personal information is safe and secure. For more details, please read our privacy policy.
We are committed towards customer satisfaction, and quality service.
"The quality of research they have done for us has been excellent."


