- Home
- »
- Next Generation Technologies
- »
-
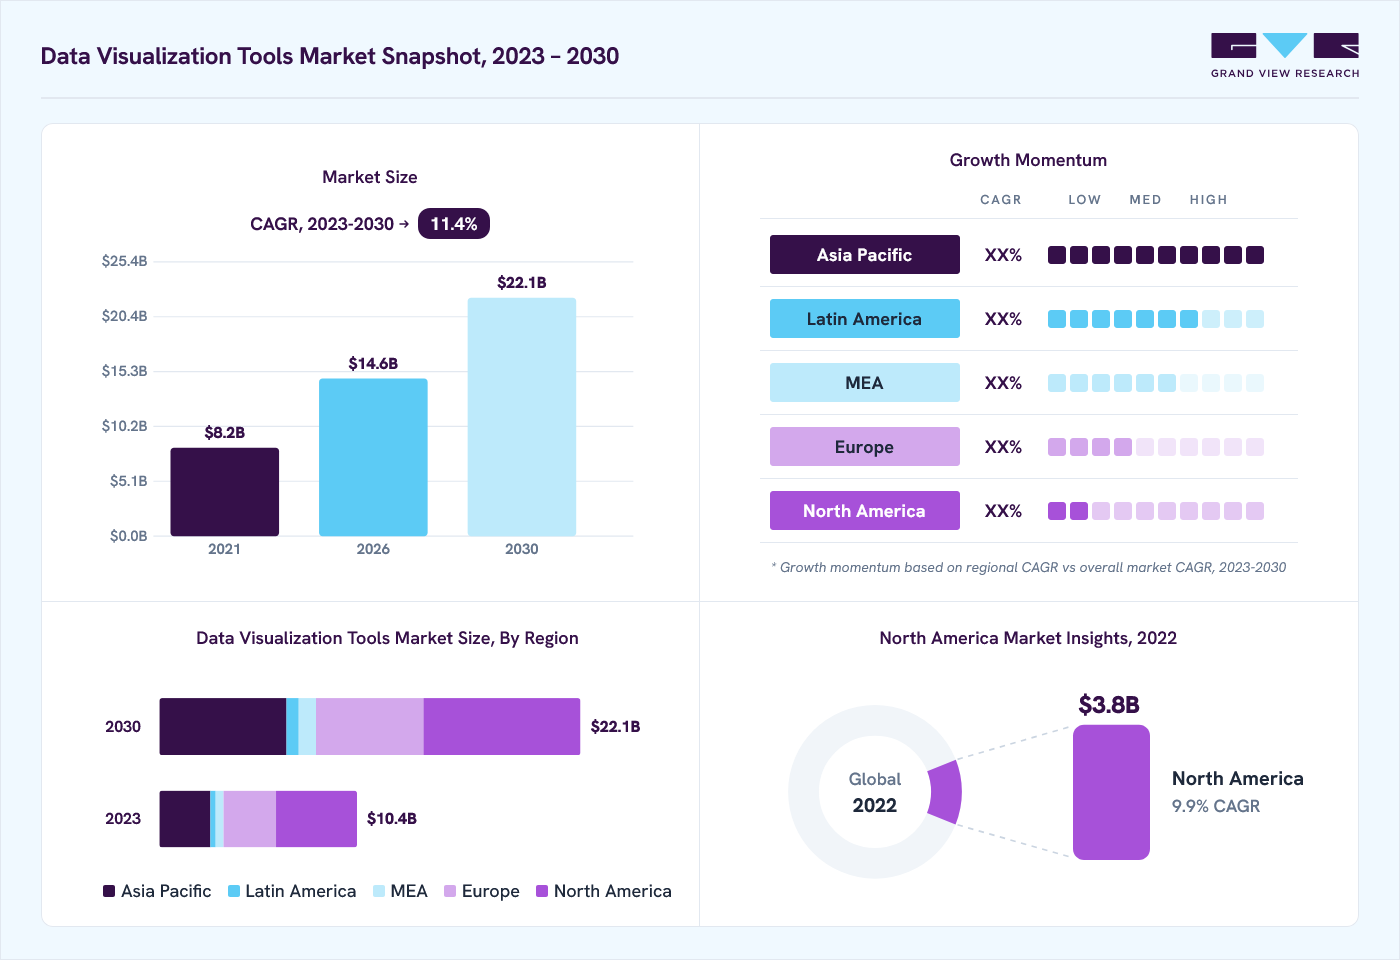
Data Visualization Tools Market Size & Share Report, 2023-2030GVR Report cover
![Data Visualization Tools Market (2023 - 2030)Report]()
Data Visualization Tools Market (2023 - 2030)
Size, Share & Trends Analysis Report By Component (Software, Service), By Application, By Organization Size, By Deployment, By End-users, By Region, And Segment Forecasts
Market Size, 2022
$9.2BMarket Estimate, 2026
$14.6BMarket Forecast, 2030
$22.1BCAGR, 2023–2030
11.4%Data Visualization Tools Market Summary
The global data visualization tools market size was valued at USD 9.2 billion in 2022 and is projected to grow from USD 14.6 billion in 2026 to USD 22.1 billion by 2030, at a CAGR of 11.4% from 2023 to 2030. North America dominated the market, accounting for a revenue share of 41% in 2022. Data visualization tools are essential for businesses and organizations to interpret, analyze, and communicate data insights, allowing users to create graphs, charts, and other visual representations of data, making it easier to identify trends, patterns, and relationships in data.
Key Market Trends & Insights
- By component, the software segment contributed the highest revenue share of over 64% in 2022.
- By organization size, the large enterprises' segment led the market in 2022 and accounted for over 69% share of the global revenue.
Market Size & Forecast
- 2024 Market Size: USD 9.2 Billion
- 2030 Projected Market Size: USD 22.1 Billion
- CAGR (2023-2030): 11.4%
- North America: Largest market in 2022
Several key factors drive the data visualization tools market, such as the increasing volume and complexity of data being generated and collected by organizations. With vast data available, organizations can analyze and transcribe it with data visualization tools, enabling them to easily create charts, graphs, and other visual representations of their data, making it easier to identify patterns and insights.

Another factor driving the growth of the data visualization tools market is the need for real-time data analysis. Visualization tools enable users to quickly analyze and understand data, allowing them to make informed decisions in real time. Visual Analytics tools enable users to effectively analyze and understand complex data sets, allowing them to identify patterns, trends, relationships, and opportunities within their data and explore detailed data with simple drill-down and drill-through capabilities. With visual analytics tools, users can analyze structured and unstructured data. These tools often provide users with interactive dashboards and visualizations, such as charts, graphs, and maps that help to bring the data to life and make it easier to understand.
Cloud-based solutions have been a catalyst for the growth of the data visualization tools market due to their ability to offer flexibility and scalability to organizations. With cloud-based data visualization tools, users can access and analyze data from anywhere with an internet connection. It is essential for organizations with remote or distributed workforces, as it enables users to collaborate and work together on data analysis, regardless of their location. With cloud-based data visualization tools, organizations can pay for only the resources they need rather than invest in expensive hardware and software licenses, which makes cloud-based solutions more accessible to smaller organizations or those with limited budgets.
The COVID-19 pandemic has significantly impacted many industries, including the data visualization tools market. One of the most significant impacts has been the increased demand for data visualization tools, as organizations have had to adapt to remote work and quickly change business conditions. The pandemic has also highlighted the importance of real-time data analysis, particularly in industries such as healthcare and supply chain management. With many businesses facing disruptions to their supply chains, shifts in consumer behavior, and other challenges, data visualization tools have been essential in helping organizations understand and adapt to these changes.
Component Insights
The software segment contributed the highest revenue share of over 64% in 2022 and the segment is anticipated to hold the maximum share throughout the forecast period. Startup companies in the data visualization tools market are constantly introducing new products and innovative solutions to meet the evolving needs of organizations. These new products often leverage the latest technological advancements to give users more powerful and intuitive data analysis capabilities. For instance, Flourish is a data visualization tool that enables users to import and analyze data in various formats. While the tool is suitable for personal use cases, such as visualizing health data from any Android smartwatch, it also offers enterprise-level capabilities to handle larger datasets for organizations. With Flourish, users have the flexibility to manage and present complex data in a clear and understandable format, regardless of the size of the dataset or the intended audience.
The services segment is estimated to expand at the highest CAGR over the forecast period. Many data visualization tool providers offer integration services to help businesses merge data from different sources into a single platform. It allows a comprehensive data view and enables better analysis. Additionally, companies can build customized dashboards that cater to specific business requirements, allowing for better visualization and analysis of the data. Market players often provide training and support services to ensure that businesses can use their software effectively and get the most out of the platform.
Organization Size Insights
The large enterprises' segment led the market in 2022 and accounted for over 69% share of the global revenue. Data visualization tools allow large enterprises to manage and analyze vast amounts of data, to make better-informed decisions. In addition to helping enterprises identify insights, data visualization tools allow them to communicate findings and trends more effectively. Visual representations of data are easier to understand and interpret, making it easier for teams to collaborate, share information, and make informed decisions.
The SMEs segment is estimated to grow significantly over the forecast period. SMEs face unique challenges when managing and analyzing their business data. These tools can help SMEs analyze customer behavior across various touchpoints, such as social media, email campaigns, and website visits. By visualizing this data, SMEs can identify customer preferences and tailor their marketing messages, leading to more effective campaigns and increased sales. These tools can help SMEs optimize their operations and drive growth by providing a clear and intuitive way to analyze and understand data.
Deployment Insights
The on-premises segment witnessed the highest market share in 2022 and accounted for over 59% of global revenue. One of the primary needs for on-premises data visualization tools is data security and privacy. Some organizations, particularly those in heavily regulated industries like finance and healthcare, must keep their data on-premises due to compliance and security concerns. Preserving data on their infrastructure gives these organizations more control over their data and can better ensure its protection. Additionally, the need for mobile access drives the development of on-premises solutions that support remote and mobile access.
The cloud segment is estimated to grow steadily over the forecast period. One of the biggest trends in cloud-based data visualization tools is using artificial intelligence (AI) and machine learning (ML) algorithms. Another trend is integrating data visualization tools with other cloud-based services, such as data warehousing and business intelligence platforms. With AI-powered analytics, seamless integrations, scalability, and robust security features, cloud-based data visualization tools are becoming increasingly important for organizations looking to gain insights and make data-driven decisions.
End-users Insights
The IT and telecommunication segment alone held the largest revenue share of over 21% in 2022. Data visualization tools enable IT and telecom companies to analyze and decipher vast amounts of data, including network performance data, customer behavior data, and financial data. Predictive analytics is a trend in the IT and telecommunications industry. Predictive analytics can help companies forecast future trends and identify potential problems before they occur. Data visualization tools that support predictive analytics can provide companies with insights that can help them stay ahead of the competition.
The healthcare and life sciences segment is anticipated to witness the highest CAGR over the forecast period. There is a need for data visualization tools in the healthcare & life sciences industry to support decision-making. Healthcare companies need to make informed decisions based on their data, and data visualization tools can help by providing a clear and easy-to-understand view of the data. Solutions can help companies make better decisions and improve their performance and patient treatment. Further, the need for data security and privacy is becoming increasingly important in the healthcare industry. Healthcare companies handle sensitive customer data, and data visualization tools must support the highest levels of security and privacy, including billing information, patient details, and other security features that help protect customer data.
Application Insights
The marketing and sales segment led the market in 2022 and accounted for over 35% of global revenue. Marketing departments use data visualization tools to identify patterns and trends in consumer behavior, allowing marketers to make more informed decisions about their campaigns. Marketers can create targeted campaigns that resonate with their audience and drive higher engagement and conversions by analyzing customer demographics, behavior, and preferences. Similarly, data visualization tools in sales can be used to analyze customer data and identify critical trends and patterns. By visualizing sales data, teams can quickly identify areas of opportunity and focus their efforts on the most profitable segments of the market.

The Human Resources (HR) segment is estimated to grow significantly over the forecast period. Data visualization tools can help HR professionals to communicate complex data in a way that is easy to understand. It can be beneficial when presenting data to executives or other stakeholders who may need a background in HR or data analysis. Additionally, as companies become more data-driven, there is an increasing demand for HR professionals with strong analytical skills. Data visualization tools can bridge the gap between HR and data analytics, allowing HR professionals to analyze and interpret data without requiring specialized technical skills.
Regional Insights
North America dominated the market in 2022 and accounted for over 41% share of the global revenue. Businesses and organizations in North America rely heavily on data to make informed decisions, and data visualization tools play a critical role in this process. Some of North America's popular data visualization tools include Tableau, Power BI, D3.js, and Google Data Studio. As data security and privacy concerns continue to grow, there is also an increasing demand for data visualization tools to ensure secure data storage and transfer. Such tools are required to protect sensitive data from cyber threats and ensure compliance with data privacy regulations such as GDPR.

Asia Pacific is predicted to register the highest CAGR from 2023 to 2030. With the rise of big data, machine learning, and other advanced technologies, organizations in Asia Pacific need data visualization tools to help them identify patterns, trends, and anomalies in their data. This need is particularly acute in finance, healthcare, and logistics industries, where timely and accurate decision-making is critical to success. With the rise of online shopping and social media, businesses in the Asia Pacific are using data visualization to gain insights into consumer behavior and preferences and to develop targeted marketing campaigns that drive sales and engagement. This trend is particularly evident in countries like China and India, where e-commerce is a significant driver of economic growth.
Key Companies & Market Share Insights
Many prominent data visualization tools companies have adopted product launches and developments as their primary business strategy to gain a larger market share. For instance, in May 2022, Tableau Software launched a new edition of its cloud-based data analytics and visualization software. Furthermore, it detailed ongoing efforts to integrate its analytical platform with Salesforce, Inc.'s cloud applications. Tableau also stated 70% of new customers choose the fully hosted Tableau Cloud over on-premises or hybrid deployments. Further strategies have been followed, such as contracts, agreements, partnerships, and collaborations, to drive innovation. For instance, in April 2023, Akridata, a software company, announced the availability of its flagship product, Akridata Data Explorer, on the Azure Marketplace. With Akridata Data Explorer, data scientists can explore, search, analyze, and compare visual data. Additionally, the platform offers several lenses to search image similarity and view model performance. Some of the prominent players in the data visualization tools market include:
-
Salesforce, Inc.
-
Alibaba Cloud
-
Oracle
-
Amazon Web Services, Inc.
-
SAS Institute Inc.
-
Sisense Inc.
-
Microsoft Corporation
-
TIBCO software
-
IBM
-
SAP
Data Visualization Tools Market Report Scope
Report Attribute
Details
Market size in 2022
USD 9.2 billion
Estimated Market size in 2026
USD 14.6 billion
Projected Market size by 2030
USD 22.1 billion
Growth rate
CAGR of 11.4% from 2023 to 2030
Base year for estimation
2022
Historical data
2017 - 2021
Forecast period
2023 - 2030
Quantitative units
Revenue in USD billion and CAGR from 2023 to 2030
Report coverage
Revenue forecast, company ranking, competitive landscape, growth factors, and trends
Segments covered
Component, application, organization size, deployment, end-users, region
Regional scope
North America; Europe; Asia Pacific; Latin America; MEA
Country scope
U.S.; Canada; UK; Germany; France; China; Japan; India; South Korea; Australia; Brazil; Mexico; KSA; UAE; and South Africa
Key companies profiled
Salesforce, Inc.; Alibaba Cloud; Oracle; Amazon Web Services, Inc.; SAS Institute Inc.; Sisense Inc.; Microsoft Corporation; TIBCO software; International Business Machines Corp.; SAP
Customization scope
Free report customization (equivalent up to 8 analysts working days) with purchase. Addition or alteration to country, regional & segment scope.
Pricing and purchase options
Avail customized purchase options to meet your exact research needs. Explore purchase options
Global Data Visualization Tools Market Report Segmentation
This report forecasts revenue growth at global, regional, and country levels and provides an analysis of the latest industry trends in each of the sub-segments from 2017 to 2030. For this study, Grand View Research has segmented the global data visualization tools market report based on component, application, organization size, deployment, end-users, and region.
-
Component Outlook (Revenue, USD Billion, 2017 - 2030)
-
Software
-
Standalone
-
Integrated
-
-
Service
-
Consulting Services
-
Support Services
-
-
-
Application Outlook (Revenue, USD Billion, 2017 - 2030)
-
Human Resources
-
Operations
-
Finance
-
Marketing & Sales
-
-
Organization Size Outlook (Revenue, USD Billion, 2017 - 2030)
-
Large Enterprises
-
SMEs
-
-
Deployment Outlook (Revenue, USD Billion, 2017 - 2030)
-
Cloud
-
On-premises
-
-
End-users Outlook (Revenue, USD Billion, 2017 - 2030)
-
BFSI
-
IT and Telecommunication
-
Manufacturing
-
Healthcare & Life Sciences
-
Retail and E-commerce
-
Government
-
Transportation & logistics
-
Others
-
-
Regional Outlook (Revenue, USD Billion, 2017 - 2030)
-
North America
-
U.S.
-
Canada
-
-
Europe
-
UK
-
Germany
-
France
-
-
Asia Pacific
-
China
-
Japan
-
India
-
South Korea
-
Australia
-
-
Latin America
-
Brazil
-
Mexico
-
-
Middle East and Africa (MEA)
-
Kingdom of Saudi Arabia (KSA)
-
UAE
-
South Africa
-
-
Frequently Asked Questions About This Report
The global data visualization tools market size was valued at USD 9.2 billion in 2022 and is estimated at USD 14.6 billion for 2026.
The global data visualization tools market is expected to grow at a CAGR of 11.4% from 2023 to 2030, reaching USD 22.1 billion by 2030.
North America dominated with a revenue share of 41.0% in 2022.
Some key players operating in the data visualization tools market include o Salesforce, Inc., Alibaba Cloud, Oracle, and Amazon Web Services, Inc. .
Key factors driving the data visualization tools market growth include the need to quickly and easily understand complex data sets and increasing reliance on data-driven decision-making.
About the Author(s)
Next Generation Technologies Research Team
Technology · Next Generation TechnologiesThis report was authored by the next generation technologies research team at Grand View Research - comprising two research analysts, one senior research analyst, and one industry expert - with specialized expertise in the next generation technologies segment of the technology industry. All findings are based on proprietary technology databases, executive interviews, and regulatory analysis, subject to internal peer review prior to publication.
Last Updated:
Speak to Analyst


Need a Tailored Report?
Customize this report to your needs — add regions, segments, or data points, with 20% free customization.
Or view our licence options:

ISO 9001:2015 & 27001:2022 Certified
We are GDPR and CCPA compliant! Your transaction & personal information is safe and secure. For more details, please read our privacy policy.


