GVR Report cover Glamping Market Size, Share & Trends Report

Glamping Market Size, Share & Trends Analysis Report By Accommodation (Cabins & Pods, Tents, Yurts, Treehouses), By Age Group (18 - 32, 33 - 50, 51 - 65, Above 65 Years), By Booking Mode, By Region, And Segment Forecasts, 2025 - 2030

  • Report ID: GVR-3-68038-565-6
  • Number of Report Pages: 110
  • Format: PDF, Horizon Databook
  • Historical Range: 2018 - 2024
  • Forecast Period: 2025 - 2030 
  • Industry: Consumer Goods

Glamping Market Size & Trends

The global glamping market size was estimated at USD 3.45 billion in 2024 and is expected to grow at a CAGR of 10.3% from 2025 to 2030. This growth is primarily driven by the increasing demand for luxury outdoor experiences that combine the appeal of nature with modern comforts, particularly among millennials and eco-conscious travelers. The rise in disposable income, coupled with the desire for unique travel experiences, has further spurred the market. Additionally, the growing trend of sustainable tourism and the preference for eco-friendly accommodation are pushing both consumers and operators to embrace glamping.

Glamping Market size, by accommodation, 2020 - 2030 (USD Billion)

The glamping market is experiencing rapid growth, fueled by the increasing demand for luxury outdoor experiences, particularly from eco-conscious travelers and millennials seeking unique travel options. The rise of new operators-28% of which are in their first year-demonstrates the growing interest in this space, as highlighted by the Glamping Americas 2023 State of the Industry Report. With businesses such as Quaint Glamping and Mitten Getaways Glamping Co. set to launch, the industry is poised for further expansion.
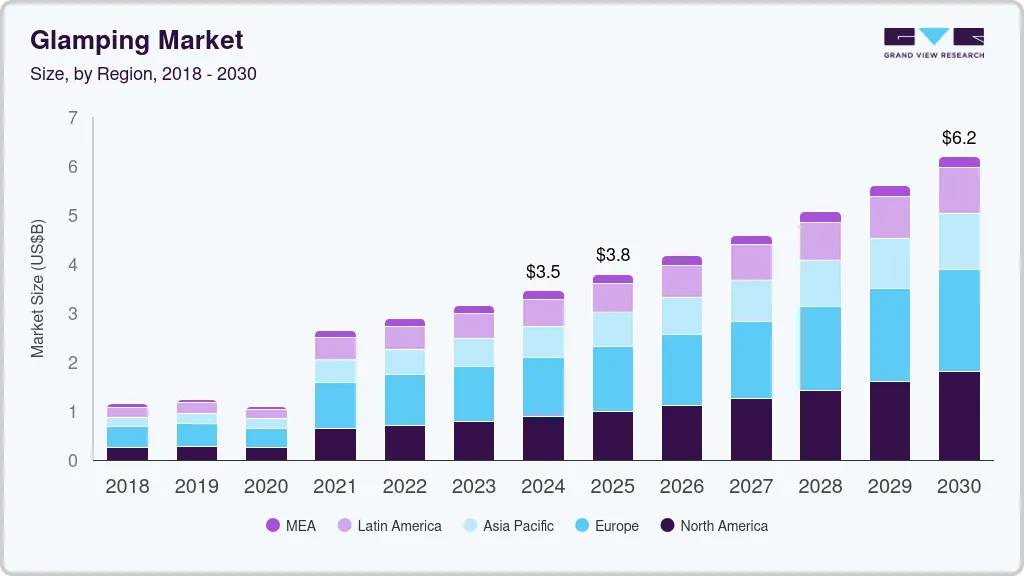
Strategic positioning near natural attractions, such as state and national parks, enhances guest experiences by combining luxury with outdoor exploration. Around 51% of glamping sites are located near state parks in the U.S., and 33% are adjacent to national parks, offering visitors a blend of nature and comfort. Additionally, sustainability and technology integration are expected to play a critical role in the future of the glamping industry. Eco-friendly practices, along with the use of digital solutions for seamless booking, are becoming key factors for both operators and travelers.

The financial dynamics of the glamping industry show that most operators are self-funded, with an average initial investment of USD 650,000. This indicates a strong belief in the industry's potential, driven by both small and large players alike. The market is also benefiting from a growing interest in global expansion and diversification, with new operators entering various regions to cater to evolving traveler preferences, such as remote working options and eco-friendly accommodations.

As the industry looks to 2024 and beyond, trends such as technological integration, sustainability, and a focus on safety and wellness will shape its future. Operators are likely to explore untapped markets, embrace digital innovations like Wi-Fi and EV charging stations, and cater to post-pandemic travel needs, ensuring the glamping sector remains dynamic and appealing.

Accommodation Insights

Cabins & pods accounted for a revenue share of over 43% in 2024. This is mainly due to the growing preference for more permanent, sturdy, and comfortable glamping accommodations. This shift is largely driven by glampers seeking a "home-away-from-home" experience with modern conveniences such as insulated walls, heating, air conditioning, and full bathrooms. Cabins and pods offer a level of privacy, security, and comfort comparable to hotels, making them highly attractive to families and couples.

The demand for tent accommodation is projected to grow at a CAGR of 11.4% from 2025 to 2030, driven by the rising demand for a more immersive and traditional camping experience. Modern glamping tents often feature high-end interiors, including plush beds and en suite bathrooms, while still offering a closer connection to nature than cabins or pods. The rise in eco-conscious travel and the desire for unique, customizable outdoor experiences-ranging from safari tents to yurts-continues to fuel demand for luxury tent accommodations, particularly in remote, picturesque locations.

Age Group Insights

Glamping among 18 to 32 age group accounted for a revenue share of over 43% in 2024, is largely driven by millennials and Gen Z’s inclination toward unique, experience-based travel. These younger generations prioritize adventure, nature, and social media-friendly experiences, which glamping fulfills with its blend of outdoor settings and luxury accommodations. The growth in online searches, influencer-driven content, and a shift toward eco-conscious travel also contribute to glamping's popularity within this demographic. Additionally, flexible work arrangements and the rise of "workcations" enable younger travelers to combine remote work with leisure, further boosting glamping demand among this age group.

The demand for glamping among 33 to 50 age group is projected to grow at a CAGR of 11.0% from 2025 to 2030,attributed to a different set of motivations. This demographic, typically more financially stable and often traveling with family, is drawn to glamping for its comfort, privacy, and upscale amenities that traditional camping lacks. As wellness and relaxation become key aspects of midlife travel, glamping offers the perfect balance between connecting with nature and enjoying luxurious conveniences like spa treatments, farm-to-table dining, and wellness retreats. Moreover, this age group is increasingly seeking family-friendly vacation options that provide a mix of outdoor activities and comfort, driving further growth in demand.

Booking Mode Insights

Direct bookings accounted for a revenue share of over 55% in 2024. One major driver is the increasing reliance on glamping operators' direct websites, which often offer personalized services, exclusive deals, and greater transparency in terms of pricing and amenities. These platforms provide a more tailored customer experience, allowing travelers to communicate specific requests and customize their stay directly with the host. Additionally, many glamping providers promote direct bookings by offering perks such as loyalty discounts, early check-ins, or complimentary upgrades, incentivizing travelers to bypass third-party platforms.
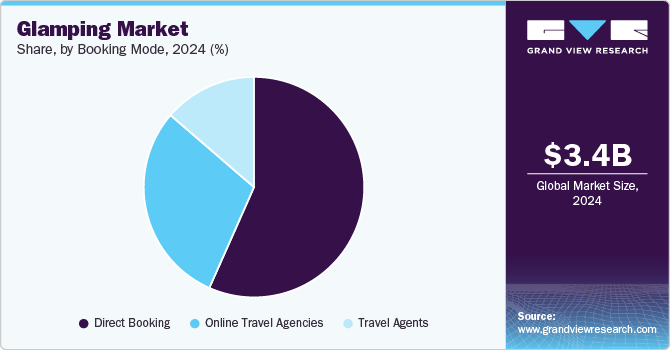
Glamping Market share, by booking mode, 2024 (%)

Bookings on online travel agencies are projected to grow at a CAGR of 11.1% from 2025 to 2030 in the glamping market. The rising demand for unique travel experiences has made glamping an appealing alternative to traditional hotels, particularly among millennials and Gen Z, who favor immersive, eco-friendly, and luxury stays. OTAs, with their wide reach and convenience, capitalize on this trend by offering diverse glamping options, ranging from high-end treehouses to safari tents. Additionally, the increasing digitalization of travel booking platforms enhances user accessibility and ease, contributing to the surge in OTA-based glamping reservations. The use of AI-driven personalization on these platforms also plays a crucial role in matching travelers with suitable accommodations, further driving growth.

Regional Insights

The North America glamping market accounted for a share of over 25% of the global market revenue in 2024. The market has seen significant growth in recent years, largely driven by an increasing demand for upscale outdoor experiences. A new report from Kampgrounds of America highlights that 34% of new campers in 2023 opted for glamping, up from 18% in 2021. This growing interest has brought 15.6 million new participants into the sector over the past five years.

U.S. Glamping Market Trends

The U.S. glamping market is expected to grow at a CAGR of 12.8% from 2025 to 2030. A variety of glamping accommodations have emerged across the U.S., offering travelers unique experiences. These range from restored Airstream trailers to yurts and cabins, often situated in scenic locations like private homesteads and ranches. These luxury camping options provide amenities that are not traditionally associated with camping, such as mattresses, upscale bath products, and air conditioning, catering to those seeking nature without sacrificing comfort. Properties like Eastwind Hotels in New York's Catskills offer year-round glamping experiences, combining outdoor activities like skiing and hiking with high-end accommodations. The trend also includes features like wellness programs and "digital detox" experiences, appealing to urban dwellers looking to unplug and reconnect with nature.
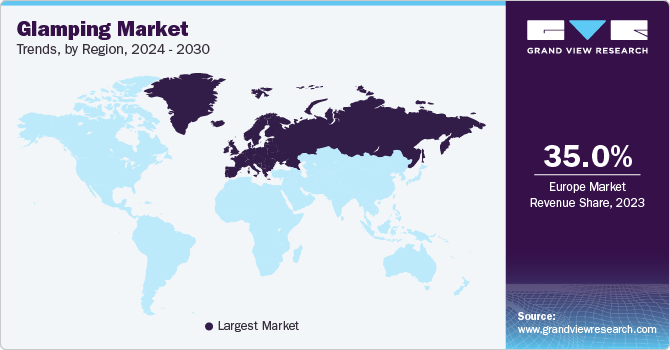
Glamping Market Trends, by Region, 2025 - 2030

Europe Glamping Market Trends

The Europe glamping market accounted for a share of over 35% of the global market in 2024. One major factor driving the market growth is the increasing focus on sustainability, with many glamping sites adopting eco-friendly practices like using renewable energy and sustainable materials. This allows travelers to enjoy nature without a negative environmental impact. Technology is also playing a larger role in glamping, with innovations like smart tents and cabins, high-speed internet in remote locations, and virtual reality experiences that enhance the outdoor adventure while keeping guests connected and entertained.

Asia Pacific Glamping Market Trends

The Asia Pacific glamping industry is expected to grow at a CAGR of 10.8% from 2025 to 2030. One of the growing trends in Asia is the emphasis on wellness, with many glamping sites offering activities like yoga, meditation, and spa treatments. These experiences cater to the increasing demand for personal well-being and mindfulness, providing guests with a holistic retreat in nature. Family-friendly glamping options are on the rise in countries like Japan and India, offering larger accommodations, kid-friendly programs, and pet-friendly amenities, making glamping an appealing option for families and those traveling with pets.

Key Glamping Company Insights

The glamping industry is characterized by its fragmented nature. The fragmented nature of the glamping market is largely due to the presence of a mix of small, independent operators and larger, established companies. The market caters to a wide variety of travelers, from luxury-seeking tourists to eco-conscious adventurers. Many smaller, niche businesses have emerged, each offering unique, personalized experiences. These independent operators focus on boutique, local glamping experiences, such as yurts, safari tents, and treehouses, catering to specific customer preferences. Larger, more established players, on the other hand, offer standardized luxury glamping experiences across multiple locations, leading to a fragmented market structure.

Key Glamping Companies:

The following are the leading companies in the glamping market. These companies collectively hold the largest market share and dictate industry trends.

View a comprehensive list of companies in the Glamping Market

Recent Developments

  • In September 2024, Quaint Glamping is launching in Twin Mountain, New Hampshire, offering year-round outdoor luxury experiences. The site will feature 15 dome-like structures with modern amenities such as full bathrooms, kitchenettes, and event spaces. This launch aims to cater to the increasing demand for winter glamping.

  • In September 2023, Starlight Haven in Hot Springs, Arkansas, expanded its glamping resort, adding luxurious options like safari tents, geodesic domes, and treehouses. The resort emphasizes sustainability and offers eco-friendly practices while integrating digital services for guest convenience.

Glamping Market Report Scope

Report Attribute

Details

Market size value in 2025

USD 3.79 billion

Revenue forecast in 2030

USD 6.18 billion

Growth rate

CAGR of 10.3% from 2025 to 2030

Actuals

2018 - 2024

Forecast period

2025 - 2030

Quantitative units

Revenue in USD million/billion and CAGR from 2025 to 2030

Report coverage

Revenue forecast, company ranking, competitive landscape, growth factors, and trends

Segments covered

Accommodation, age group, booking mode, region

Regional scope

North America; Europe; Asia Pacific; Latin America; Middle East & Africa

Country scope

U.S.; Canada; Germany; UK; France; Italy; Netherlands; China; Japan; India; Australia; Brazil; Argentina; South Africa; UAE

Key companies profiled

Under Canvas; Collective Retreats; Tentrr; Eco Retreats; Baillie Lodges; Nightfall Camp Pty Ltd.; Tanja Lagoon Camp; Wildman Wilderness Lodge; Paperbark Camp; Hoshino Resorts

Customization

Free report customization (equivalent up to 8 analysts working days) with purchase. Addition or alteration to country, regional & segment scope.

Pricing and purchase options

Avail customized purchase options to meet your exact research needs. Explore purchase options

Global Glamping Market Report Segmentation

This report forecasts revenue growth at the global, regional, and country levels and provides an analysis of the latest industry trends and opportunities in each of the sub-segments from 2018 to 2030. For the purpose of this study, Grand View Research has segmented the global glamping market report based on accommodation, age group, booking mode, and region:
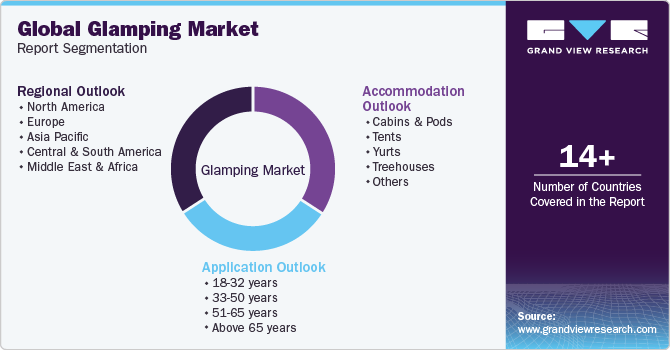
Global Glamping Market Report Segmentation

  • Accommodation Outlook (Revenue, USD Million, 2018 - 2030)

    • Cabins & Pods

    • Tents

    • Yurts

    • Treehouses

    • Others

  • Age Group Outlook (Revenue, USD Million, 2018 - 2030)

    • 18 - 32 years

    • 33 - 50 years

    • 51 - 65 years

    • Above 65 years

  • Booking Mode Outlook (Revenue, USD Million, 2018 - 2030)

    • Direct Booking

    • Travel Agents

    • Online Travel Agencies

  • Regional Outlook (Revenue, USD Million, 2018 - 2030)

    • North America

      • U.S.

      • Canada

    • Europe

      • Germany

      • UK

      • France

      • Italy

      • Netherlands

    • Asia Pacific

      • China

      • India

      • Japan

      • Australia

    • Latin America

      • Brazil

      • Argentina

    • Middle East & Africa

      • South Africa

      • UAE

Frequently Asked Questions About This Report

Table of Contents

Chapter 1. Methodology and Scope
                    1.1. Market Segmentation & Scope
                    1.2. Market Definition
                    1.3. Information Procurement
                        1.3.1. Purchased Database
                        1.3.2. GVR’s Internal Database
                        1.3.3. Secondary Materials & Third-Party Perspectives
                        1.3.4. Primary Research
                    1.4. Information Analysis
                        1.4.1. Data Analysis Models
                    1.5. Market Information & Data Visualization
                    1.6. Data Validation & Publishing
Chapter 2. Executive Summary
                    2.1. Market Snapshot
                    2.2. Segmental Outlook
                    2.3. Regional Outlook
                    2.4. Competitive Landscape Snapshot
Chapter 3. Glamping Market - Industry Outlook
                    3.1. Market Lineage Outlook
                    3.2. Industry Value Chain Analysis
                    3.3. Market Dynamics
                        3.3.1. Market Driver Analysis
                        3.3.2. Market Restraint Analysis
                        3.3.3. Market Opportunities
                        3.3.4. Market Challenges
                    3.4. Industry Analysis Tools
                        3.4.1. Porter’s Five Forces Analysis
                    3.5. Market Entry Strategies
Chapter 4. Consumer Behavior Analysis
                    4.1. Demographic Analysis
                    4.2. Consumer Trends & Preferences
                    4.3. Factors Affecting Buying Behavior
                    4.4. Consumer Service Adoption Trends
                    4.5. Key Observations & Recommendations
Chapter 5. Glamping Market: Accommodation Estimates & Trend Analysis
                    5.1. Glamping Market, By Accommodation: Key Takeaways
                    5.2. Accommodation Movement Analysis & Market Share, 2024 & 2030
                    5.3. Market Estimates & Forecasts, by accommodation, 2018 - 2030 (USD Million)
                        5.3.1. Cabins & Pods
                            5.3.1.1. Market estimates and forecast, 2018 - 2030 (USD Million)
                        5.3.2. Tents
                            5.3.2.1. Market estimates and forecast, 2018 - 2030 (USD Million)
                        5.3.3. Yurts
                            5.3.3.1. Market estimates and forecast, 2018 - 2030 (USD Million)
                        5.3.4. Treehouses
                            5.3.4.1. Market estimates and forecast, 2018 - 2030 (USD Million)
                        5.3.5. Others
                            5.3.5.1. Market estimates and forecast, 2018 - 2030 (USD Million)
Chapter 6. Glamping Market: Age Group Estimates & Trend Analysis
                    6.1. Glamping Market, By Age Group: Key Takeaways
                    6.2. Age Group Movement Analysis & Market Share, 2024 & 2030
                    6.3. Market Estimates & Forecasts, by age group, 2018 - 2030 (USD Million)
                        6.3.1. 18 - 32 years
                            6.3.1.1. Market estimates and forecast, 2018 - 2030 (USD Million)
                        6.3.2. 33 - 50 years
                            6.3.2.1. Market estimates and forecast, 2018 - 2030 (USD Million)
                        6.3.3. 51 - 65 years
                            6.3.3.1. Market estimates and forecast, 2018 - 2030 (USD Million)
                        6.3.4. Above 65 years
                            6.3.4.1. Market estimates and forecast, 2018 - 2030 (USD Million)
Chapter 7. Glamping Market: Booking Mode Estimates & Trend Analysis
                    7.1. Glamping Market, By Booking Mode: Key Takeaways
                    7.2. Booking Mode Movement Analysis & Market Share, 2024 & 2030
                    7.3. Market Estimates & Forecasts, by booking mode, 2018 - 2030 (USD Million)
                        7.3.1. Direct Booking
                            7.3.1.1. Market estimates and forecast, 2018 - 2030 (USD Million)
                        7.3.2. Travel Agents
                            7.3.2.1. Market estimates and forecast, 2018 - 2030 (USD Million)
                        7.3.3. Online Travel Agencies
                            7.3.3.1. Market estimates and forecast, 2018 - 2030 (USD Million)
Chapter 8. Glamping Market: Regional Estimates & Trend Analysis
                    8.1. Glamping Market: Regional Outlook
                    8.2. Regional Marketplaces: Key Takeaways
                    8.3. Market Estimates & Forecasts, by region, 2018 - 2030 (USD Million)
                        8.3.1. North America
                            8.3.1.1. Market estimates and forecast, 2018 - 2030 (USD Million)
                            8.3.1.2. U.S.
                                8.3.1.2.1. Key country dynamics
                                8.3.1.2.2. Market estimates and forecast, 2018 - 2030 (USD Million)
                            8.3.1.3. Canada
                                8.3.1.3.1. Key country dynamics
                                8.3.1.3.2. Market estimates and forecast, 2018 - 2030 (USD Million)
                        8.3.2. Europe
                            8.3.2.1. Market estimates and forecast, 2018 - 2030 (USD Million)
                            8.3.2.2. Germany
                                8.3.2.2.1. Key country dynamics
                                8.3.2.2.2. Market estimates and forecast, 2018 - 2030 (USD Million)
                            8.3.2.3. UK
                                8.3.2.3.1. Key country dynamics
                                8.3.2.3.2. Market estimates and forecast, 2018 - 2030 (USD Million)
                            8.3.2.4. France
                                8.3.2.4.1. Key country dynamics
                                8.3.2.4.2. Market estimates and forecast, 2018 - 2030 (USD Million)
                            8.3.2.5. Italy
                                8.3.2.5.1. Key country dynamics
                                8.3.2.5.2. Market estimates and forecast, 2018 - 2030 (USD Million)
                            8.3.2.6. Netherlands
                                8.3.2.6.1. Key country dynamics
                                8.3.2.6.2. Market estimates and forecast, 2018 - 2030 (USD Million)
                        8.3.3. Asia Pacific
                            8.3.3.1. Market estimates and forecast, 2018 - 2030 (USD Million)
                            8.3.3.2. China
                                8.3.3.2.1. Key country dynamics
                                8.3.3.2.2. Market estimates and forecast, 2018 - 2030 (USD Million)
                            8.3.3.3. India
                                8.3.3.3.1. Key country dynamics
                                8.3.3.3.2. Market estimates and forecast, 2018 - 2030 (USD Million)
                            8.3.3.4. Japan
                                8.3.3.4.1. Key country dynamics
                                8.3.3.4.2. Market estimates and forecast, 2018 - 2030 (USD Million)
                            8.3.3.5. Australia
                                8.3.3.5.1. Key country dynamics
                                8.3.3.5.2. Market estimates and forecast, 2018 - 2030 (USD Million)
                        8.3.4. Latin America
                            8.3.4.1. Market estimates and forecast, 2018 - 2030 (USD Million)
                            8.3.4.2. Brazil
                                8.3.4.2.1. Key country dynamics
                                8.3.4.2.2. Market estimates and forecast, 2018 - 2030 (USD Million)
                            8.3.4.3. Argentina
                                8.3.4.3.1. Key country dynamics
                                8.3.4.3.2. Market estimates and forecast, 2018 - 2030 (USD Million)
                        8.3.5. Middle East & Africa
                            8.3.5.1. Market estimates and forecast, 2018 - 2030 (USD Million)
                            8.3.5.2. South Africa
                                8.3.5.2.1. Key country dynamics
                                8.3.5.2.2. Market estimates and forecast, 2018 - 2030 (USD Million)
                            8.3.5.3. UAE
                                8.3.5.3.1. Key country dynamics
                                8.3.5.3.2. Market estimates and forecast, 2018 - 2030 (USD Million)
Chapter 9. Glamping Market: Competitive Analysis
                    9.1. Recent developments & impact analysis, by key market participants
                    9.2. Company Categorization
                    9.3. Participant’s Overview
                    9.4. Financial Performance
                    9.5. Product/Service Benchmarking
                    9.6. Company Market Share Analysis, 2024 (%)
                    9.7. Company Heat Map Analysis
                    9.8. Strategy Mapping
                    9.9. Company Profiles
                        9.9.1. Under Canvas
                            9.9.1.1. Company Overview
                            9.9.1.2. Financial Performance
                            9.9.1.3. Product/Service Portfolios
                            9.9.1.4. Strategic Initiatives
                        9.9.2. Collective Retreats
                            9.9.2.1. Company Overview
                            9.9.2.2. Financial Performance
                            9.9.2.3. Product/Service Portfolios
                            9.9.2.4. Strategic Initiatives
                        9.9.3. Tentrr
                            9.9.3.1. Company Overview
                            9.9.3.2. Financial Performance
                            9.9.3.3. Product/Service Portfolios
                            9.9.3.4. Strategic Initiatives
                        9.9.4. Eco Retreats
                            9.9.4.1. Company Overview
                            9.9.4.2. Financial Performance
                            9.9.4.3. Product/Service Portfolios
                            9.9.4.4. Strategic Initiatives
                        9.9.5. Baillie Lodges
                            9.9.5.1. Company Overview
                            9.9.5.2. Financial Performance
                            9.9.5.3. Product/Service Portfolios
                            9.9.5.4. Strategic Initiatives
                        9.9.6. Nightfall Camp Pty Ltd.
                            9.9.6.1. Company Overview
                            9.9.6.2. Financial Performance
                            9.9.6.3. Product/Service Portfolios
                            9.9.6.4. Strategic Initiatives
                        9.9.7. Tanja Lagoon Camp
                            9.9.7.1. Company Overview
                            9.9.7.2. Financial Performance
                            9.9.7.3. Product/Service Portfolios
                            9.9.7.4. Strategic Initiatives
                        9.9.8. Wildman Wilderness Lodge
                            9.9.8.1. Company Overview
                            9.9.8.2. Financial Performance
                            9.9.8.3. Product/Service Portfolios
                            9.9.8.4. Strategic Initiatives
                        9.9.9. Paperbark Camp
                            9.9.9.1. Company Overview
                            9.9.9.2. Financial Performance
                            9.9.9.3. Product/Service Portfolios
                            9.9.9.4. Strategic Initiatives
                        9.9.10. Hoshino Resorts
                            9.9.10.1. Company Overview
                            9.9.10.2. Financial Performance
                            9.9.10.3. Product/Service Portfolios
                            9.9.10.4. Strategic Initiatives


List of Tables

Table 1 Glamping market: Key market driver analysis
Table 2 Glamping market: Key market restraint analysis
Table 3 Glamping market estimates & forecast, by accommodation, 2018 - 2030 (USD Million)
Table 4 Cabins & Pods market estimates & forecast, 2018 - 2030 (USD Million)
Table 5 Tents market estimates & forecast, 2018 - 2030 (USD Million)
Table 6 Yurts market estimates & forecast, 2018 - 2030 (USD Million)
Table 7 Treehouses market estimates & forecast, 2018 - 2030 (USD Million)
Table 8 Other accommodations in glamping market estimates & forecast, 2018 - 2030 (USD Million)
Table 9 Glamping market estimates & forecast, by age group, 2018 - 2030 (USD Million)
Table 10 Glamping market estimates & forecast, for 18 - 32 age group, 2018 - 2030 (USD Million)
Table 11 Glamping market estimates & forecast, for 33 - 50 age group, 2018 - 2030 (USD Million)
Table 12 Glamping market estimates & forecast, for 51 - 65 age group, 2018 - 2030 (USD Million)
Table 13 Glamping market estimates & forecast, for above 65 age group, 2018 - 2030 (USD Million)
Table 14 Glamping market estimates & forecast, by booking mode, 2018 - 2030 (USD Million)
Table 15 Glamping market estimates & forecast, through direct booking, 2018 - 2030 (USD Million)
Table 16 Glamping market estimates & forecast, through travel agents, 2018 - 2030 (USD Million)
Table 17 Glamping market estimates & forecast, through online travel agencies, 2018 - 2030 (USD Million)
Table 18 Glamping market estimates & forecast, by region, 2018 - 2030 (USD Million)
Table 19 North America glamping market estimates and forecast, 2018 - 2030 (USD Million)
Table 20 North America glamping market estimates and forecast, by accommodation, 2018 - 2030 (USD Million)
Table 21 North America glamping market estimates and forecast, by age group, 2018 - 2030 (USD Million)
Table 22 North America glamping market estimates and forecast, by booking mode, 2018 - 2030 (USD Million)
Table 23 U.S. macro-economic outlay
Table 24 U.S. glamping market estimates and forecast, 2018 - 2030 (USD Million)
Table 25 U.S. glamping market estimates and forecast, by accommodation, 2018 - 2030 (USD Million)
Table 26 U.S. glamping market estimates and forecast, by age group, 2018 - 2030 (USD Million)
Table 27 U.S. glamping market estimates and forecast, by booking mode, 2018 - 2030 (USD Million)
Table 28 Canada macro-economic outlay
Table 29 Canada glamping market estimates and forecast, 2018 - 2030 (USD Million)
Table 30 Canada glamping market estimates and forecast, by accommodation, 2018 - 2030 (USD Million)
Table 31 Canada glamping market estimates and forecast, by age group, 2018 - 2030 (USD Million)
Table 32 Canada glamping market estimates and forecast, by booking mode, 2018 - 2030 (USD Million)
Table 33 Europe glamping market estimates and forecast, 2018 - 2030 (USD Million)
Table 34 Europe glamping market estimates and forecast, by accommodation, 2018 - 2030 (USD Million)
Table 35 Europe glamping market estimates and forecast, by age group, 2018 - 2030 (USD Million)
Table 36 Europe glamping market estimates and forecast, by booking mode, 2018 - 2030 (USD Million)
Table 37 Germany macro-economic outlay
Table 38 Germany glamping market estimates and forecast, 2018 - 2030 (USD Million)
Table 39 Germany glamping market estimates and forecast, by accommodation, 2018 - 2030 (USD Million)
Table 40 Germany glamping market estimates and forecast, by age group, 2018 - 2030 (USD Million)
Table 41 Germany glamping market estimates and forecast, by booking mode, 2018 - 2030 (USD Million)
Table 42 UK macro-economic outlay
Table 43 UK glamping market estimates and forecast, 2018 - 2030 (USD Million)
Table 44 UK glamping market estimates and forecast, by accommodation, 2018 - 2030 (USD Million)
Table 45 UK glamping market estimates and forecast, by age group, 2018 - 2030 (USD Million)
Table 46 UK glamping market estimates and forecast, by booking mode, 2018 - 2030 (USD Million)
Table 47 France macro-economic outlay
Table 48 France glamping market estimates and forecast, 2018 - 2030 (USD Million)
Table 49 France glamping market estimates and forecast, by accommodation, 2018 - 2030 (USD Million)
Table 50 France glamping market estimates and forecast, by age group, 2018 - 2030 (USD Million)
Table 51 France glamping market estimates and forecast, by booking mode, 2018 - 2030 (USD Million)
Table 52 Italy macro-economic outlay
Table 53 Italy glamping market estimates and forecast, 2018 - 2030 (USD Million)
Table 54 Italy glamping market estimates and forecast, by accommodation, 2018 - 2030 (USD Million)
Table 55 Italy glamping market estimates and forecast, by age group, 2018 - 2030 (USD Million)
Table 56 Italy glamping market estimates and forecast, by booking mode, 2018 - 2030 (USD Million)
Table 57 Netherlands macro-economic outlay
Table 58 Netherlands glamping market estimates and forecast, 2018 - 2030 (USD Million)
Table 59 Netherlands glamping market estimates and forecast, by accommodation, 2018 - 2030 (USD Million)
Table 60 Netherlands glamping market estimates and forecast, by age group, 2018 - 2030 (USD Million)
Table 61 Netherlands glamping market estimates and forecast, by booking mode, 2018 - 2030 (USD Million)
Table 62 Asia Pacific glamping market estimates and forecast, 2018 - 2030 (USD Million)
Table 63 Asia Pacific glamping market estimates and forecast, by accommodation, 2018 - 2030 (USD Million)
Table 64 Asia Pacific glamping market estimates and forecast, by age group, 2018 - 2030 (USD Million)
Table 65 Asia Pacific glamping market estimates and forecast, by booking mode, 2018 - 2030 (USD Million)
Table 66 China macro-economic outlay
Table 67 China glamping market estimates and forecast, 2018 - 2030 (USD Million)
Table 68 China glamping market estimates and forecast, by accommodation, 2018 - 2030 (USD Million)
Table 69 China glamping market estimates and forecast, by age group, 2018 - 2030 (USD Million)
Table 70 China glamping market estimates and forecast, by booking mode, 2018 - 2030 (USD Million)
Table 71 India macro-economic outlay
Table 72 India glamping market estimates and forecast, 2018 - 2030 (USD Million)
Table 73 India glamping market estimates and forecast, by accommodation, 2018 - 2030 (USD Million)
Table 74 India glamping market estimates and forecast, by age group, 2018 - 2030 (USD Million)
Table 75 India glamping market estimates and forecast, by booking mode, 2018 - 2030 (USD Million)
Table 76 Japan macro-economic outlay
Table 77 Japan glamping market estimates and forecast, 2018 - 2030 (USD Million)
Table 78 Japan glamping market estimates and forecast, by accommodation, 2018 - 2030 (USD Million)
Table 79 Japan glamping market estimates and forecast, by age group, 2018 - 2030 (USD Million)
Table 80 Japan glamping market estimates and forecast, by booking mode, 2018 - 2030 (USD Million)
Table 81 Australia macro-economic outlay
Table 82 Australia glamping market estimates and forecast, 2018 - 2030 (USD Million)
Table 83 Australia glamping market estimates and forecast, by accommodation, 2018 - 2030 (USD Million)
Table 84 Australia glamping market estimates and forecast, by age group, 2018 - 2030 (USD Million)
Table 85 Australia glamping market estimates and forecast, by booking mode, 2018 - 2030 (USD Million)
Table 86 Latin America glamping market estimates and forecast, 2018 - 2030 (USD Million)
Table 87 Latin America glamping market estimates and forecast, by accommodation, 2018 - 2030 (USD Million)
Table 88 Latin America glamping market estimates and forecast, by age group, 2018 - 2030 (USD Million)
Table 89 Latin America glamping market estimates and forecast, by booking mode, 2018 - 2030 (USD Million)
Table 90 Brazil macro-economic outlay
Table 91 Brazil glamping market estimates and forecast, 2018 - 2030 (USD Million)
Table 92 Brazil glamping market estimates and forecast, by accommodation, 2018 - 2030 (USD Million)
Table 93 Brazil glamping market estimates and forecast, by age group, 2018 - 2030 (USD Million)
Table 94 Brazil glamping market estimates and forecast, by booking mode, 2018 - 2030 (USD Million)
Table 95 Argentina macro-economic outlay
Table 96 Argentina glamping market estimates and forecast, 2018 - 2030 (USD Million)
Table 97 Argentina glamping market estimates and forecast, by accommodation, 2018 - 2030 (USD Million)
Table 98 Argentina glamping market estimates and forecast, by age group, 2018 - 2030 (USD Million)
Table 99 Argentina glamping market estimates and forecast, by booking mode, 2018 - 2030 (USD Million)
Table 100 Middle East & Africa glamping market estimates and forecast, 2018 - 2030 (USD Million)
Table 101 Middle East & Africa glamping market estimates and forecast, by accommodation, 2018 - 2030 (USD Million)
Table 102 Middle East & Africa glamping market estimates and forecast, by age group, 2018 - 2030 (USD Million)
Table 103 Middle East & Africa glamping market estimates and forecast, by booking mode, 2018 - 2030 (USD Million)
Table 104 South Africa macro-economic outlay
Table 105 South Africa glamping market estimates and forecast, 2018 - 2030 (USD Million)
Table 106 South Africa glamping market estimates and forecast, by accommodation, 2018 - 2030 (USD Million)
Table 107 South Africa glamping market estimates and forecast, by age group, 2018 - 2030 (USD Million)
Table 108 South Africa glamping market estimates and forecast, by booking mode, 2018 - 2030 (USD Million)
Table 109 UAE macro-economic outlay
Table 110 UAE glamping market estimates and forecast, 2018 - 2030 (USD Million)
Table 111 UAE glamping market estimates and forecast, by accommodation, 2018 - 2030 (USD Million)
Table 112 UAE glamping market estimates and forecast, by age group, 2018 - 2030 (USD Million)
Table 113 UAE glamping market estimates and forecast, by booking mode, 2018 - 2030 (USD Million)
Table 114 Recent developments & impact analysis, by key market participants
Table 115 Company market share, 2024
Table 116 Company heat map analysis
Table 117 Companies implementing key strategies


List of Figures

Fig. 1 Glamping market segmentation
Fig. 2 Information procurement
Fig. 3 Primary research pattern
Fig. 4 Primary research approaches
Fig. 5 Primary research process
Fig. 6 Market snapshot
Fig. 7 Segment snapshot
Fig. 8 Regional snapshot
Fig. 9 Competitive landscape snapshot
Fig. 10 Parent industry and glamping market size, 2024 (USD Million)
Fig. 11 Glamping market: Value chain analysis
Fig. 12 Glamping market: Dynamics
Fig. 13 Glamping market: Porter’s five forces analysis
Fig. 14 Factors affecting booking decisions in glamping market
Fig. 15 Glamping market, by accommodation: Key takeaways
Fig. 16 Glamping market: Accommodation movement analysis, 2024 & 2030 (%)
Fig. 17 Cabins & Pods market estimates & forecast, 2018 - 2030 (USD Million)
Fig. 18 Tents market estimates & forecast, 2018 - 2030 (USD Million)
Fig. 19 Yurts market estimates & forecast, 2018 - 2030 (USD Million)
Fig. 20 Treehouses market estimates & forecast, 2018 - 2030 (USD Million)
Fig. 21 Other accommodations in North America glamping market estimates & forecast, 2018 - 2030 (USD Million)
Fig. 22 Glamping market, by age group: Key takeaways
Fig. 23 Glamping market: Age group movement analysis, 2024 & 2030 (%)
Fig. 24 Glamping market estimates & forecast, for 18 - 32 age group, 2018 - 2030 (USD Million)
Fig. 25 Glamping market estimates & forecast, for 33 - 50 age group, 2018 - 2030 (USD Million)
Fig. 26 Glamping market estimates & forecast, for 51 - 65 age group, 2018 - 2030 (USD Million)
Fig. 27 Glamping market estimates & forecast, for above 65 age group, 2018 - 2030 (USD Million)
Fig. 28 Glamping market, by booking mode: Key takeaways
Fig. 29 Glamping market: Booking Mode movement analysis, 2024 & 2030 (%)
Fig. 30 Glamping market estimates & forecast, through direct booking, 2018 - 2030 (USD Million)
Fig. 31 Glamping market estimates & forecast, through travel agents, 2018 - 2030 (USD Million)
Fig. 32 Glamping market estimates & forecast, through online travel agencies, 2018 - 2030 (USD Million)
Fig. 33 Glamping market: Regional outlook, 2024 & 2030, (USD Million)
Fig. 34 Regional marketplace: Key takeaways
Fig. 35 North America glamping market estimates & forecast, 2018 - 2030 (USD Million)
Fig. 36 US glamping market estimates & forecast, 2018 - 2030 (USD Million)
Fig. 37 Canada glamping market estimates & forecast, 2018 - 2030 (USD Million)
Fig. 38 Europe glamping market estimates & forecast, 2018 - 2030 (USD Million)
Fig. 39 Germany glamping market estimates & forecast, 2018 - 2030 (USD Million)
Fig. 40 UK glamping market estimates & forecast, 2018 - 2030 (USD Million)
Fig. 41 France glamping market estimates & forecast, 2018 - 2030 (USD Million)
Fig. 42 Italy glamping market estimates & forecast, 2018 - 2030 (USD Million)
Fig. 43 Netherlands glamping market estimates & forecast, 2018 - 2030 (USD Million)
Fig. 44 Asia Pacific glamping market estimates & forecast, 2018 - 2030 (USD Million)
Fig. 45 China glamping market estimates & forecast, 2018 - 2030 (USD Million)
Fig. 46 Japan glamping market estimates & forecast, 2018 - 2030 (USD Million)
Fig. 47 India glamping market estimates & forecast, 2018 - 2030 (USD Million)
Fig. 48 Australia glamping market estimates & forecast, 2018 - 2030 (USD Million)
Fig. 49 Latin America glamping market estimates & forecast, 2018 - 2030 (USD Million)
Fig. 50 Brazil glamping market estimates & forecast, 2018 - 2030 (USD Million)
Fig. 51 Argentina glamping market estimates & forecast, 2018 - 2030 (USD Million)
Fig. 52 Middle East & Africa glamping market estimates & forecast, 2018 - 2030 (USD Million)
Fig. 53 South Africa glamping market estimates & forecast, 2018 - 2030 (USD Million)
Fig. 54 UAE glamping market estimates & forecast, 2018 - 2030 (USD Million)
Fig. 55 Key company categorization
Fig. 56 Company market share analysis, 2024
Fig. 57 Strategic framework of glamping market

What questions do you have? Get quick response from our industry experts. Request a Free Consultation

Market Segmentation

  • Glamping Accommodation Outlook (Revenue, USD Million, 2018 - 2030)
    • Cabins & Pods
    • Tents
    • Yurts
    • Treehouses
    • Others
  • Glamping Age Group Outlook (Revenue, USD Million, 2018 - 2030)
    • 18 - 32 years
    • 33 - 50 years
    • 51 - 65 years
    • Above 65 years
  • Glamping Booking Mode Outlook (Revenue, USD Million, 2018 - 2030)
    • Direct Booking
    • Travel Agents
    • Online Travel Agencies
  • Glamping Regional Outlook (Revenue, USD Million, 2018 - 2030)
    • North America
      • North America glamping market, by accommodation
        • Cabins & Pods
        • Tents
        • Yurts
        • Treehouses
        • Others
      • North America glamping market, by age group
        • 18 - 32 years
        • 33 - 50 years
        • 51 - 65 years
        • Above 65 years
      • North America glamping market, by booking mode
        • Direct Booking
        • Travel Agents
        • Online Travel Agencies
      • U.S.
        • U.S. glamping market, by accommodation
          • Cabins & Pods
          • Tents
          • Yurts
          • Treehouses
          • Others
        • U.S. glamping market, by age group
          • 18 - 32 years
          • 33 - 50 years
          • 51 - 65 years
          • Above 65 years
        • U.S. glamping market, by booking mode
          • Direct Booking
          • Travel Agents
          • Online Travel Agencies
      • Canada
        • Canada glamping market, by accommodation
          • Cabins & Pods
          • Tents
          • Yurts
          • Treehouses
          • Others
        • Canada glamping market, by age group
          • 18 - 32 years
          • 33 - 50 years
          • 51 - 65 years
          • Above 65 years
        • Canada glamping market, by booking mode
          • Direct Booking
          • Travel Agents
          • Online Travel Agencies
    • Europe
      • Europe glamping market, by accommodation
        • Cabins & Pods
        • Tents
        • Yurts
        • Treehouses
        • Others
      • Europe glamping market, by age group
        • 18 - 32 years
        • 33 - 50 years
        • 51 - 65 years
        • Above 65 years
      • Europe glamping market, by booking mode
        • Direct Booking
        • Travel Agents
        • Online Travel Agencies
      • Germany
        • Germany glamping market, by accommodation
          • Cabins & Pods
          • Tents
          • Yurts
          • Treehouses
          • Others
        • Germany glamping market, by age group
          • 18 - 32 years
          • 33 - 50 years
          • 51 - 65 years
          • Above 65 years
        • Germany glamping market, by booking mode
          • Direct Booking
          • Travel Agents
          • Online Travel Agencies
      • UK
        • UK glamping market, by accommodation
          • Cabins & Pods
          • Tents
          • Yurts
          • Treehouses
          • Others
        • UK glamping market, by age group
          • 18 - 32 years
          • 33 - 50 years
          • 51 - 65 years
          • Above 65 years
        • UK glamping market, by booking mode
          • Direct Booking
          • Travel Agents
          • Online Travel Agencies
      • France
        • France glamping market, by accommodation
          • Cabins & Pods
          • Tents
          • Yurts
          • Treehouses
          • Others
        • France glamping market, by age group
          • 18 - 32 years
          • 33 - 50 years
          • 51 - 65 years
          • Above 65 years
        • France glamping market, by booking mode
          • Direct Booking
          • Travel Agents
          • Online Travel Agencies
      • Italy
        • Italy glamping market, by accommodation
          • Cabins & Pods
          • Tents
          • Yurts
          • Treehouses
          • Others
        • Italy glamping market, by age group
          • 18 - 32 years
          • 33 - 50 years
          • 51 - 65 years
          • Above 65 years
        • Italy glamping market, by booking mode
          • Direct Booking
          • Travel Agents
          • Online Travel Agencies
      • Netherlands
        • Netherlands glamping market, by accommodation
          • Cabins & Pods
          • Tents
          • Yurts
          • Treehouses
          • Others
        • Netherlands glamping market, by age group
          • 18 - 32 years
          • 33 - 50 years
          • 51 - 65 years
          • Above 65 years
        • Netherlands glamping market, by booking mode
          • Direct Booking
          • Travel Agents
          • Online Travel Agencies
    • Asia Pacific
      • Asia Pacific glamping market, by accommodation
        • Cabins & Pods
        • Tents
        • Yurts
        • Treehouses
        • Others
      • Asia Pacific glamping market, by age group
        • 18 - 32 years
        • 33 - 50 years
        • 51 - 65 years
        • Above 65 years
      • Asia Pacific glamping market, by booking mode
        • Direct Booking
        • Travel Agents
        • Online Travel Agencies
      • China
        • China glamping market, by accommodation
          • Cabins & Pods
          • Tents
          • Yurts
          • Treehouses
          • Others
        • China glamping market, by age group
          • 18 - 32 years
          • 33 - 50 years
          • 51 - 65 years
          • Above 65 years
        • China glamping market, by booking mode
          • Direct Booking
          • Travel Agents
          • Online Travel Agencies
      • India
        • India glamping market, by accommodation
          • Cabins & Pods
          • Tents
          • Yurts
          • Treehouses
          • Others
        • India glamping market, by age group
          • 18 - 32 years
          • 33 - 50 years
          • 51 - 65 years
          • Above 65 years
        • India glamping market, by booking mode
          • Direct Booking
          • Travel Agents
          • Online Travel Agencies
      • Japan
        • Japan glamping market, by accommodation
          • Cabins & Pods
          • Tents
          • Yurts
          • Treehouses
          • Others
        • Japan glamping market, by age group
          • 18 - 32 years
          • 33 - 50 years
          • 51 - 65 years
          • Above 65 years
        • Japan glamping market, by booking mode
          • Direct Booking
          • Travel Agents
          • Online Travel Agencies
      • Australia
        • Australia glamping market, by accommodation
          • Cabins & Pods
          • Tents
          • Yurts
          • Treehouses
          • Others
        • Australia glamping market, by age group
          • 18 - 32 years
          • 33 - 50 years
          • 51 - 65 years
          • Above 65 years
        • Australia glamping market, by booking mode
          • Direct Booking
          • Travel Agents
          • Online Travel Agencies
    • Latin America
      • Latin America glamping market, by accommodation
        • Cabins & Pods
        • Tents
        • Yurts
        • Treehouses
        • Others
      • Latin America glamping market, by age group
        • 18 - 32 years
        • 33 - 50 years
        • 51 - 65 years
        • Above 65 years
      • Latin America glamping market, by booking mode
        • Direct Booking
        • Travel Agents
        • Online Travel Agencies
      • Brazil
        • Brazil glamping market, by accommodation
          • Cabins & Pods
          • Tents
          • Yurts
          • Treehouses
          • Others
        • Brazil glamping market, by age group
          • 18 - 32 years
          • 33 - 50 years
          • 51 - 65 years
          • Above 65 years
        • Brazil glamping market, by booking mode
          • Direct Booking
          • Travel Agents
          • Online Travel Agencies
      • Argentina
        • Argentina glamping market, by accommodation
          • Cabins & Pods
          • Tents
          • Yurts
          • Treehouses
          • Others
        • Argentina glamping market, by age group
          • 18 - 32 years
          • 33 - 50 years
          • 51 - 65 years
          • Above 65 years
        • Argentina glamping market, by booking mode
          • Direct Booking
          • Travel Agents
          • Online Travel Agencies
    • Middle East & Africa
      • Middle East & Africa glamping market, by accommodation
        • Cabins & Pods
        • Tents
        • Yurts
        • Treehouses
        • Others
      • Middle East & Africa glamping market, by age group
        • 18 - 32 years
        • 33 - 50 years
        • 51 - 65 years
        • Above 65 years
      • Middle East & Africa glamping market, by booking mode
        • Direct Booking
        • Travel Agents
        • Online Travel Agencies
      • South Africa
        • South Africa glamping market, by accommodation
          • Cabins & Pods
          • Tents
          • Yurts
          • Treehouses
          • Others
        • South Africa glamping market, by age group
          • 18 - 32 years
          • 33 - 50 years
          • 51 - 65 years
          • Above 65 years
        • South Africa glamping market, by booking mode
          • Direct Booking
          • Travel Agents
          • Online Travel Agencies
      • UAE
        • UAE glamping market, by accommodation
          • Cabins & Pods
          • Tents
          • Yurts
          • Treehouses
          • Others
        • UAE glamping market, by age group
          • 18 - 32 years
          • 33 - 50 years
          • 51 - 65 years
          • Above 65 years
        • UAE glamping market, by booking mode
          • Direct Booking
          • Travel Agents
          • Online Travel Agencies

Report content

Qualitative Analysis

  • Industry overview
  • Industry trends
  • Market drivers and restraints
  • Market size
  • Growth prospects
  • Porter’s analysis
  • PESTEL analysis
  • Key market opportunities prioritized
  • Competitive landscape
    • Company overview
    • Financial performance
    • Product benchmarking
    • Latest strategic developments

Quantitative Analysis

  • Market size, estimates, and forecast from 2018 to 2030
  • Market estimates and forecast for product segments up to 2030
  • Regional market size and forecast for product segments up to 2030
  • Market estimates and forecast for application segments up to 2030
  • Regional market size and forecast for application segments up to 2030
  • Company financial performance
What questions do you have? Get quick response from our industry experts. Request a Free Consultation

Research Methodology

Grand View Research employs comprehensive and iterative research methodology focused on minimizing deviance in order to provide the most accurate estimates and forecast possible. The company utilizes a combination of bottom-up and top-down approaches for segmenting and estimating quantitative aspects of the market. In Addition, a recurring theme prevalent across all our research reports is data triangulation that looks market from three different perspectives. Critical elements of methodology employed for all our studies include:

Preliminary data mining

Raw market data is obtained and collated on a broad front. Data is continuously filtered to ensure that only validated and authenticated sources are considered. In addition, data is also mined from a host of reports in our repository, as well as a number of reputed paid databases. For comprehensive understanding of the market, it is essential to understand the complete value chain and in order to facilitate this; we collect data from raw material suppliers, distributors as well as buyers.

Technical issues and trends are obtained from surveys, technical symposia and trade journals. Technical data is also gathered from intellectual property perspective, focusing on white space and freedom of movement. Industry dynamics with respect to drivers, restraints, pricing trends are also gathered. As a result, the material developed contains a wide range of original data that is then further cross-validated and authenticated with published sources.

Statistical model

Our market estimates and forecasts are derived through simulation models. A unique model is created customized for each study. Gathered information for market dynamics, technology landscape, application development and pricing trends is fed into the model and analyzed simultaneously. These factors are studied on a comparative basis, and their impact over the forecast period is quantified with the help of correlation, regression and time series analysis. Market forecasting is performed via a combination of economic tools, technological analysis, and industry experience and domain expertise.

Econometric models are generally used for short-term forecasting, while technological market models are used for long-term forecasting. These are based on an amalgamation of technology landscape, regulatory frameworks, economic outlook and business principles. A bottom-up approach to market estimation is preferred, with key regional markets analyzed as separate entities and integration of data to obtain global estimates. This is critical for a deep understanding of the industry as well as ensuring minimal errors. Some of the parameters considered for forecasting include:

    • Market drivers and restrains, along with their current and expected impact
    • Raw material scenario and supply v/s price trends
    • Regulatory scenario and expected developments
    • Current capacity and expected capacity additions up to 2030

We assign weights to these parameters and quantify their market impact using weighted average analysis, to derive an expected market growth rate.

Primary validation

This is the final step in estimating and forecasting for our reports. Exhaustive primary interviews are conducted, on face to face as well as over the phone to validate our findings and assumptions used to obtain them. Interviewees are approached from leading companies across the value chain including suppliers, technology providers, domain experts and buyers so as to ensure a holistic and unbiased picture of the market. These interviews are conducted across the globe, with language barriers overcome with the aid of local staff and interpreters. Primary interviews not only help in data validation, but also provide critical insights into the market, current business scenario and future expectations and enhance the quality of our reports. All our estimates and forecast are verified through exhaustive primary research with Key Industry Participants (KIPs) which typically include:

    • Market leading companies
    • Raw material suppliers
    • Product distributors
    • Buyers

The key objectives of primary research are as follows:

    • To validate our data in terms of accuracy and acceptability
    • To gain an insight in to the current market and future expectations

Data Collection Matrix

Perspective

Primary research

Secondary research

Supply side

  • Manufacturers
  • Technology distributors and wholesalers
  • Company reports and publications
  • Government publications
  • Independent investigations
  • Economic and demographic data

Demand side

  • End-user surveys
  • Consumer surveys
  • Mystery shopping
  • Case studies
  • Reference customers


Industry Analysis Matrix

Qualitative analysis

Quantitative analysis

  • Industry landscape and trends
  • Market dynamics and key issues
  • Technology landscape
  • Market opportunities
  • Porter’s analysis and PESTEL analysis
  • Competitive landscape and component benchmarking
  • Policy and regulatory scenario
  • Market revenue estimates and forecast up to 2030
  • Market revenue estimates and forecasts up to 2030, by technology
  • Market revenue estimates and forecasts up to 2030, by application
  • Market revenue estimates and forecasts up to 2030, by type
  • Market revenue estimates and forecasts up to 2030, by component
  • Regional market revenue forecasts, by technology
  • Regional market revenue forecasts, by application
  • Regional market revenue forecasts, by type
  • Regional market revenue forecasts, by component


What questions do you have? Get quick response from our industry experts. Request a Free Consultation
pdf icn

GET A FREE SAMPLE

arrow icn

This FREE sample includes data points, ranging from trend analyses to estimates and forecasts. See for yourself.

gvr icn

NEED A CUSTOM REPORT?

We can customize every report - free of charge - including purchasing stand-alone sections or country-level reports, as well as offer affordable discounts for start-ups & universities. Contact us now

Certified Icon

We are GDPR and CCPA compliant! Your transaction & personal information is safe and secure. For more details, please read our privacy policy.