
- Home
- »
- Medical Devices
- »
-
Micro Computed Tomography Market Size Report 2026-2033GVR Report cover

Micro Computed Tomography Market (2026 - 2033)
Size, Share & Trends Analysis Report By Product (Laboratory / Benchtop Micro-CT), By Technology, By Application, By End Use, By Region, And Segment Forecasts
Market Size, 2025
$312.8MMarket Estimate, 2026
$339.3MMarket Forecast, 2033
$611.7MCAGR, 2026–2033
8.8%Micro Computed Tomography Market Summary
The global micro computed tomography market size was valued at USD 312.8 million in 2025 and is projected to grow from USD 339.3 million in 2026 to USD 611.7 million by 2033, at a CAGR of 8.8% from 2026 to 2033. North America dominated the market, accounting for a revenue share of 46.4% in 2025. The market is growing steadily, driven by rising demand for high-resolution, non-destructive 3D imaging across biomedical, materials, energy, and pharmaceutical research.
 Source: Grand View Research, IR Documents, Primary Interviews, Paid DatabasesTo learn more about this report,
 Download Free Sample Report
Key Market Trends & Insights
- By product: Laboratory / Benchtop Micro-CT segment dominated the market, with a revenue share of 52.2% in 2025.
- By technology: Spatial resolution segment held the largest market share of 34.6% in 2025.
- By application: Biomedical & preclinical research segment held the largest revenue share of 36.0% in 2025.
- By end use: Research institutes segment accounted for the largest revenue share of 38.4% in 2025.
Regional Highlights
- Largest regional market: North America (46.4% revenue share, 2025)
- Fastest-growing regional market: Asia Pacific (highest CAGR, 2026-2033)
- By country: The U.S. held the largest market share in 2025.
Market Size & Forecast
- Market size in 2025: USD 312.8 Million
- Estimated market size in 2026: USD 339.3 Million
- Projected market size by 2033: USD 611.7 Million
- CAGR (2026-2033): 8.8%
Prism AI by Grand View Research Free to tryAsk a question about the micro computed tomography marketTry asking✓Every figure cited from GVR research Prefer the report? Download free sample →
Other drivers include expanding preclinical and translational research, growing use of micro-CT for battery and advanced-materials characterization, and advances in detector technology, X-ray sources, and software. Integration of AI-assisted reconstruction and analysis is further improving image quality, scan speed, and throughput, making micro-CT more accessible to a wider range of laboratories.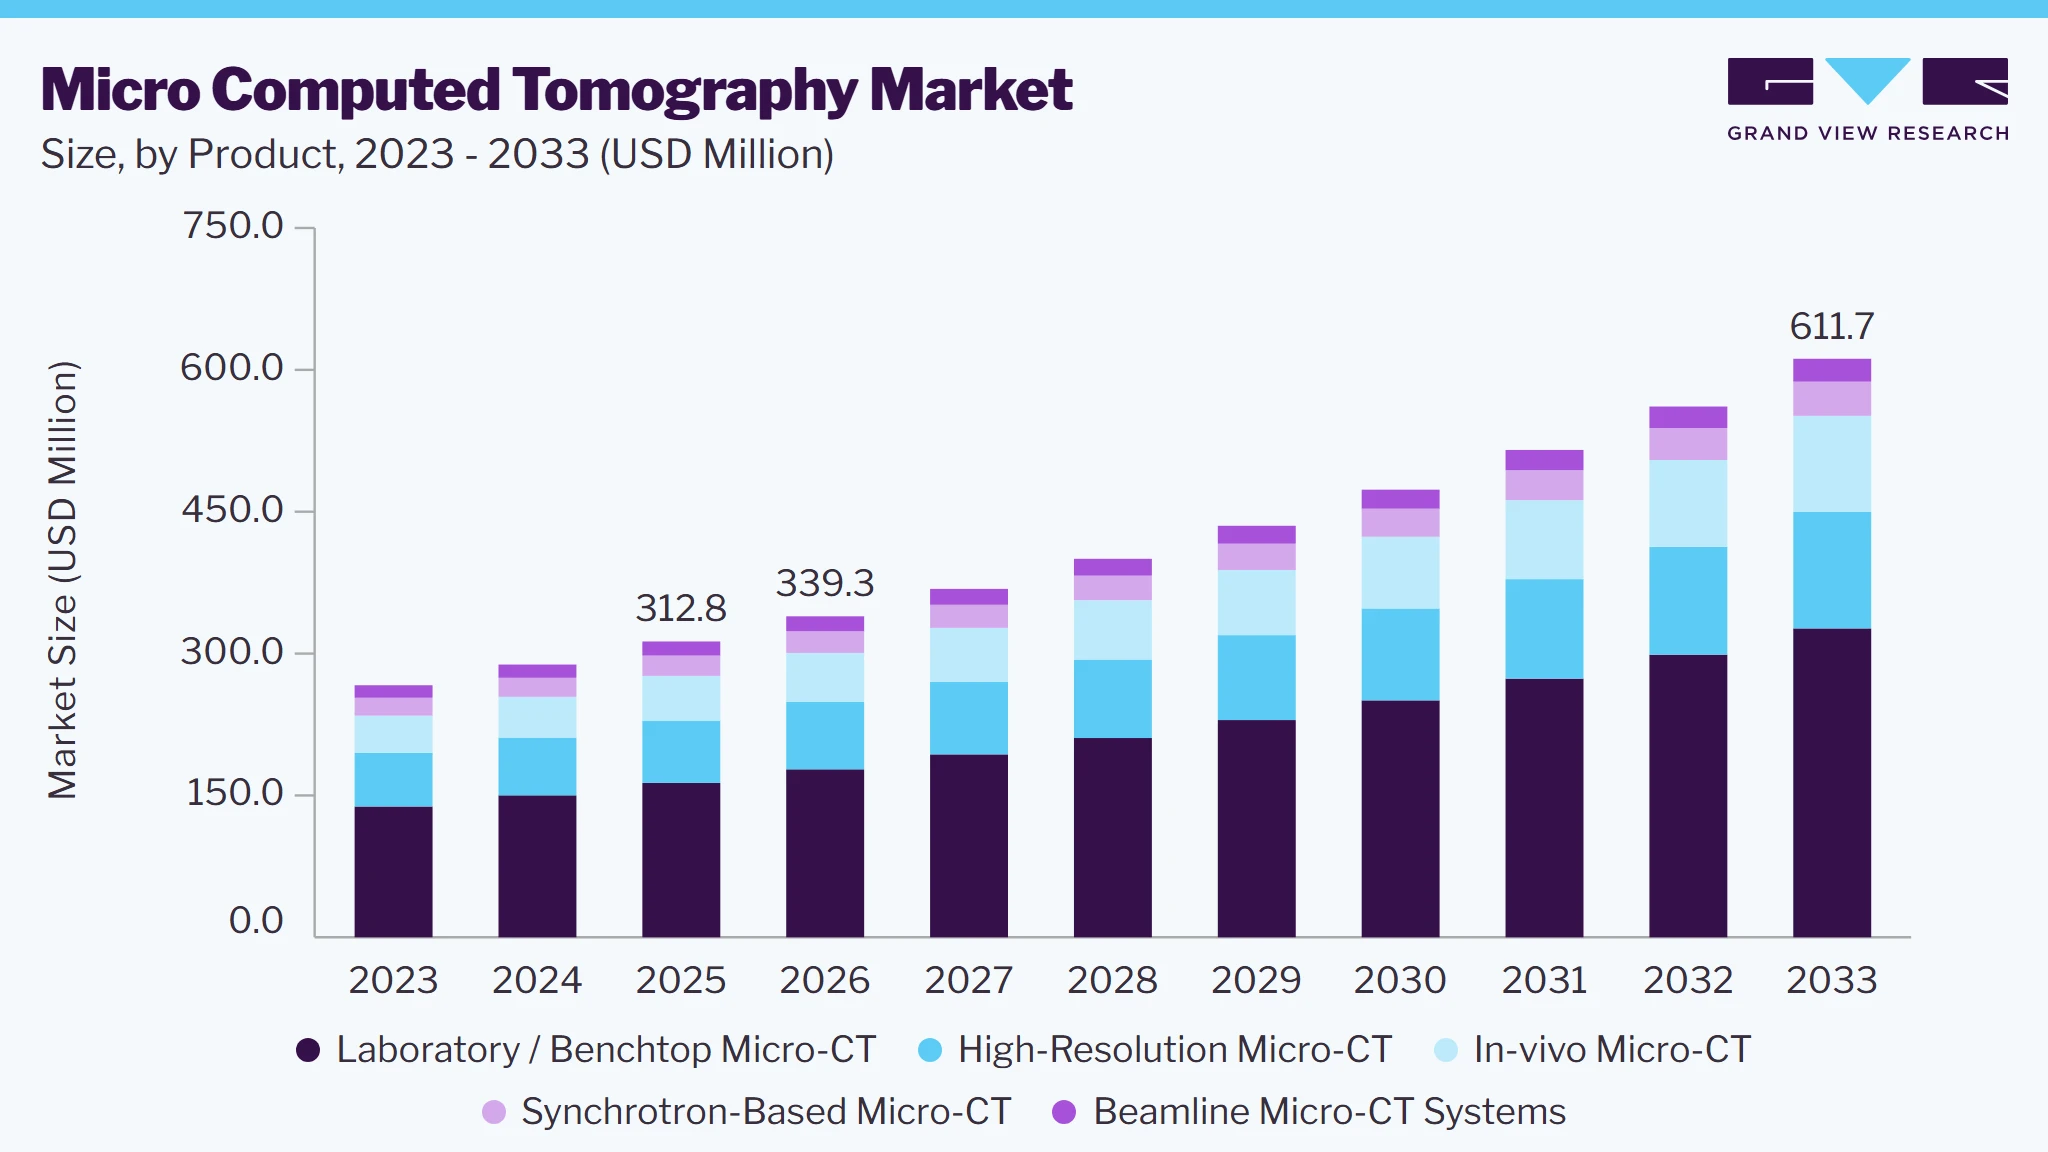 To learn more about this report, Download Free Sample Report
Micro computed tomography (micro-CT) is a high-resolution X-ray imaging technique that produces detailed three-dimensional images of internal structures at micron and sub-micron scale without destroying the sample. It is widely used to study bone microarchitecture, soft tissue, small-animal models, porous materials, composites, batteries, rocks, and manufactured components. As research increasingly needs quantitative, volumetric, and repeatable structural data, micro-CT is becoming a core analytical platform in academic, industrial, and pharmaceutical laboratories.
The market is evolving from standalone imaging instruments toward integrated imaging and analysis platforms. Vendors now pair hardware with automated workflows, advanced reconstruction algorithms, and quantitative analysis software. Progress in phase-contrast and spectral imaging, faster scanning, and AI-based denoising and reconstruction is widening the range of samples and research questions micro-CT can address, including low-contrast soft tissue, multi-material samples, and dynamic in-situ studies.
Market Dynamics
The micro computed tomography market is gaining momentum as research workflows increasingly depend on high-resolution 3D structural information. Growth is supported by rising biomedical and preclinical research activity, growing demand for non-destructive testing and characterization of advanced materials, heavy investment in battery and energy-storage R&D, and continuing improvements in system performance and usability.
Bone and musculoskeletal research is micro-CT’s anchor application, and the disease burden behind it is large. The International Osteoporosis Foundation estimates that osteoporosis affects over 500 million people worldwide, with more than 37 million fragility fractures a year among people over 55. In Europe alone, annual fractures are projected to rise from 4.28 million in 2019 to 5.34 million in 2034. This sustains demand for preclinical and human bone imaging. Instrument buyers are responding:
- Revvity’s Quantum GX3 offers 5 µm spatial resolution, a 3.9-second scan, field-of-view options from 8 to 86 mm, and respiratory and cardiac gating for in-vivo work
- Manchester Metropolitan University procured a SCANCO Xtreme CT II for human bone research, citing 58 µm resolution against roughly 400 µm for pQCT
- In December 2025, the University of Wisconsin’s Small Animal Imaging and Radiotherapy Facility added a NeoScan N80 ex-vivo micro-CT with an auto-sample changer for high-throughput studies
Driver 2 : Battery, EV and Energy-Storage R&D
EV growth is creating a new class of micro-CT users. China sold about 13 million electric cars in 2025, close to 55% of its new-car market, and accounted for over 80% of global battery cell production. Early 2026 was softer, with global EV sales down 8% in Q1 2026 after policy changes in China and the U.S., but the IEA still projects growth for the full year. CT is moving from the lab into production-line quality control:
- In September 2026, Xnovo Technology deployed its automated, AI-based 3D-CT inspection tool at BMW Group’s Cell Manufacturing Competence Centre in Parsdorf, Germany
- In March 2026, Waygate Technologies and Liminal Insights announced a partnership combining radiography, CT, and ultrasound for battery inspection across the production lifecycle
- VC Consult’s VCB2 inline system, built on Excillum’s MetalJet source, scans a full cylindrical cell at 20 µm resolution in under two seconds
High acquisition and maintenance costs remain an important restraint, particularly for advanced high-resolution, in-vivo, and synchrotron-based systems. Radiation shielding, facility requirements, and the specialized expertise needed for operation and data analysis can limit adoption among smaller laboratories. Synchrotron and beamline access is limited by availability and proposal-based scheduling. Large datasets also create storage, computing, and workflow-management challenges.
Market Concentration & Characteristics
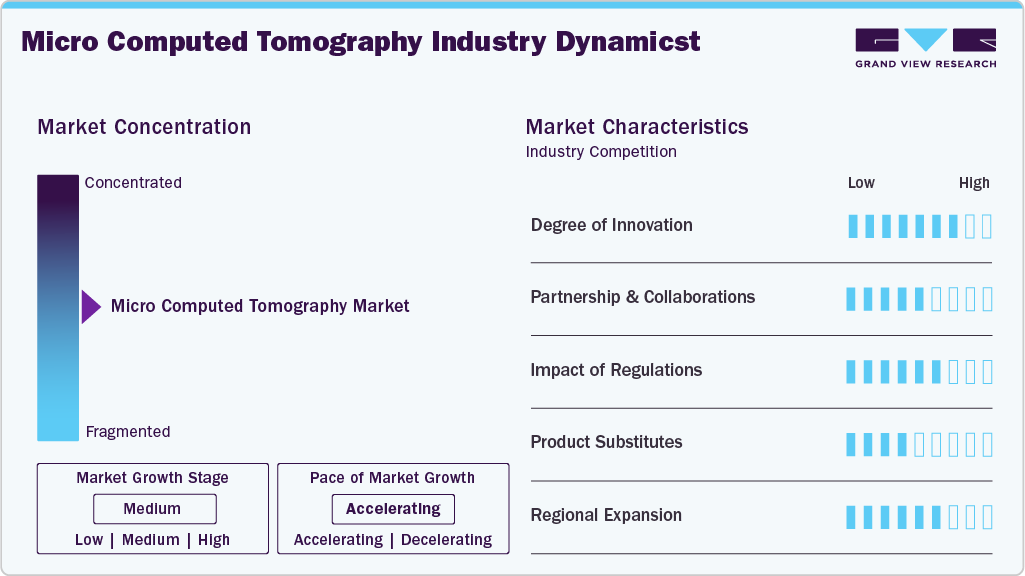
The micro-CT market is a specialized scientific-instrument industry in which system performance, application expertise, software, and service support influence purchasing decisions. Products are differentiated by spatial resolution, X-ray source and detector configuration, sample size, field of view, scanning speed, in-situ capabilities, spectral or phase-contrast functions, and the ability to integrate with analytical workflows. Product development often requires close interaction between instrument manufacturers and end users. Research institutions may require customized sample holders, environmental stages, specialized acquisition protocols, or analysis software. Industrial users may prioritize throughput, measurement repeatability, automation, and inspection of components with complex geometries. The market includes suppliers with broad scientific-instrument portfolios as well as companies focused on specialized micro-CT or X-ray microscopy systems. Competitive positioning should therefore be assessed by product capability and target application rather than by total company revenue alone.
 To learn more about this report, Download Free Sample Report
The market is characterized by continuous innovation in X-ray sources, detectors, reconstruction algorithms, and automated analysis software. Key areas of development include sub-micron resolution, faster and lower-dose scanning, spectral and phase-contrast imaging for improved material and soft-tissue differentiation, and AI-driven workflows. Innovation is shifting from simply acquiring images toward delivering automated, quantitative, and reproducible insights. Some of the key innovations are:
-
A resolution upgrade to Thermo Fisher’s HeliScan reduced the smallest achievable voxel from 800 nm to 400 nm
-
Tescan’s UniTOM HR was introduced as the first dynamic micro-CT to combine sub-micron static imaging with 4D time-resolved capability
-
In April 2026, North Star Imaging launched efX 3.0 CT visualization software, delivering a reimagined, project-based workflow for industrial X-ray and computed tomography (CT) visualization. Similarly, recently Glimpse launched Explore, a web-based industrial X-ray CT (computed tomography) viewer and sharing platform designed for hardware teams
Partnerships in the micro-CT market can involve instrument manufacturers, universities, national laboratories, research institutes, battery developers, materials manufacturers, pharmaceutical companies, and software developers. Collaborations may support the development of specialized imaging methods, testing protocols, sample environments, reconstruction algorithms, and application-specific workflows. Research facilities can provide manufacturers with access to demanding applications and early feedback on system performance. Industrial partners may support the development of methods for battery characterization, additive manufacturing, composites, or other complex materials. Software collaborations may focus on segmentation, AI-assisted reconstruction, quantitative analysis, and automated image processing.
Publicly funded research infrastructure also contributes to the development of specialized micro-CT capabilities. For example, the Australian Synchrotron's micro-computed tomography beamline provides micron-scale imaging and phase-contrast methods for research users.
The impact of regulations on micro computed tomography depends on their final application. Because micro-CT delivers high-resolution 3D imaging at the micrometer scale, systems are legally divided into preclinical/industrial applications (imaging small animals or materials) and clinical medical applications (imaging human patients, such as in dental or extremity scans). However, most systems are sold as research or industrial instruments rather than clinical devices, that ease the regulatory impact on the system. Radiation-safety rules, export and import requirements, and GLP-aligned workflows in pharmaceutical settings still shape system design and purchasing.
Micro-CT competes with or complements other imaging and characterization techniques depending on the sample and research question. Potential alternatives include conventional X-ray CT, microscopy, scanning electron microscopy, magnetic resonance imaging, ultrasound, optical imaging, destructive sectioning, and other non-destructive testing methods.
Conventional CT may be more suitable for larger objects or applications where micrometer-scale resolution is unnecessary. Microscopy can provide high-resolution surface or section-level information but may not reveal the full internal three-dimensional structure of an opaque sample without preparation or sectioning. Magnetic resonance and optical methods may be preferred for selected biological applications depending on tissue characteristics, contrast requirements, and study design.
Micro-CT's competitive position depends on its ability to deliver useful three-dimensional internal information at an appropriate resolution, sample size, acquisition time, and cost. In many workflows, it complements rather than fully replaces other methods.
Regional market development is influenced by investment in scientific research, university and laboratory infrastructure, industrial R&D, pharmaceutical and biotechnology activity, battery manufacturing, additive manufacturing, and access to advanced imaging systems. These include China’s HEPS, with 14 user beamlines in its first phase and space for at least 90. They also include South Korea’s Korea Light Source, which broke ground on July 27, 2026 with a KRW 1.1643 trillion budget. There is also Thailand’s Siam Photon Source II, a 3 GeV facility with seven Phase-1 beamlines,
Analyst Perspective
The micro computed tomography market has a positive outlook through 2033, with value shifting from standalone scanners toward integrated platforms that pair high-resolution hardware with AI-assisted reconstruction and automated analysis. Laboratory/benchtop systems and research institutes remain the base of demand, and biomedical and preclinical research remains the largest application. Growth is increasingly coming from faster-expanding areas: in-vivo imaging, pharma and biotech users, and energy and battery research, where micro-CT is moving from lab characterization into production-line inspection. North America leads on funding and vendor presence, while Asia Pacific is the fastest-growing region, supported by large EV and battery supply chains and new synchrotron and national R&D investment. High capital cost, limited access to advanced facilities, and growing competition from lower-cost regional vendors remain the main constraints. Players that combine strong hardware with software and serve both research and industrial users are best placed to gain share.
Product Insights
The laboratory / benchtop micro-CT segment dominated the market in 2025, accounting for approximately 52.2% of overall market revenue. Its leading position is primarily attributed to its smaller footprint, and lower cost than synchrotron-based alternatives. Institutions keep investing in this class, including the Rostock system above and the Institut de Recherche en Médecine de Montpellier’s installation of a NeoScan N80 for bone biology. Vendors are also pushing benchtop limits on sample size and speed, as with the SkyScan 1273, and on dynamic capability.
The in-vivo micro-CT segment is expected to witness fastest growth in the micro CT market over the forecast period. Growth is supported by rising preclinical research, increasing demand for longitudinal imaging of live small-animal models, and the need for reduced-dose, high-throughput systems in drug discovery and translational studies. Advances in low-dose protocols, respiratory and cardiac gating, and faster acquisition are improving image quality while limiting radiation exposure to the animal. Expanding use in oncology, musculoskeletal, and respiratory research is expected to further accelerate adoption.
Technology Insights
The spatial resolution segment dominated the market with a revenue share of 34.6% in 2025, supported by its high spatial resolution. The feature allows detailed visualization and quantification of fine structures such as trabecular bone, pores, fibers, and microcracks. Ongoing improvements in X-ray sources, detectors, and geometric magnification are pushing achievable resolution to sub-micron levels. This sustains strong demand from users who need precise structural and morphometric data.
The AI-assisted reconstruction segment is expected to witness the fastest growth over the forecast period. AI and deep-learning methods are being used to reduce noise and artifacts, enable high-quality reconstruction from fewer projections or lower doses, accelerate processing, and automate image segmentation and analysis. These capabilities improve throughput and reproducibility and make advanced imaging accessible to less specialized users. Their value is greatest where fast scanning, low-dose imaging, and large-volume analysis matter, such as in-vivo studies and high-throughput industrial and battery inspection. Growing vendor investment in software-driven differentiation is expected to support rapid adoption.
Application Insights
The biomedical & preclinical research segment dominated the market with a revenue share of 36.0% in 2025, supported by the established role of micro-CT in studying bone and musculoskeletal conditions, cardiovascular and pulmonary structures, tumor models, dental and implant research, and tissue engineering. Micro-CT provides quantitative, three-dimensional morphological data that supports disease modeling, therapeutic evaluation, and translational research. Strong academic funding, extensive use in core imaging facilities, and widespread adoption in small-animal studies continue to underpin the segment’s leadership.
The energy & battery research segment is expected to witness the fastest growth over the forecast period. Growth is driven by rapid expansion of battery development for electric vehicles and energy storage, and by the need to understand electrode microstructure, internal defects, swelling, and degradation mechanisms non-destructively. Micro-CT is increasingly used for quality control, failure analysis, and in-situ or operando studies of battery cells. Interest in next-generation chemistries such as solid-state batteries, along with fuel cell and hydrogen-related research, is expected to further strengthen demand.
End Use Insights
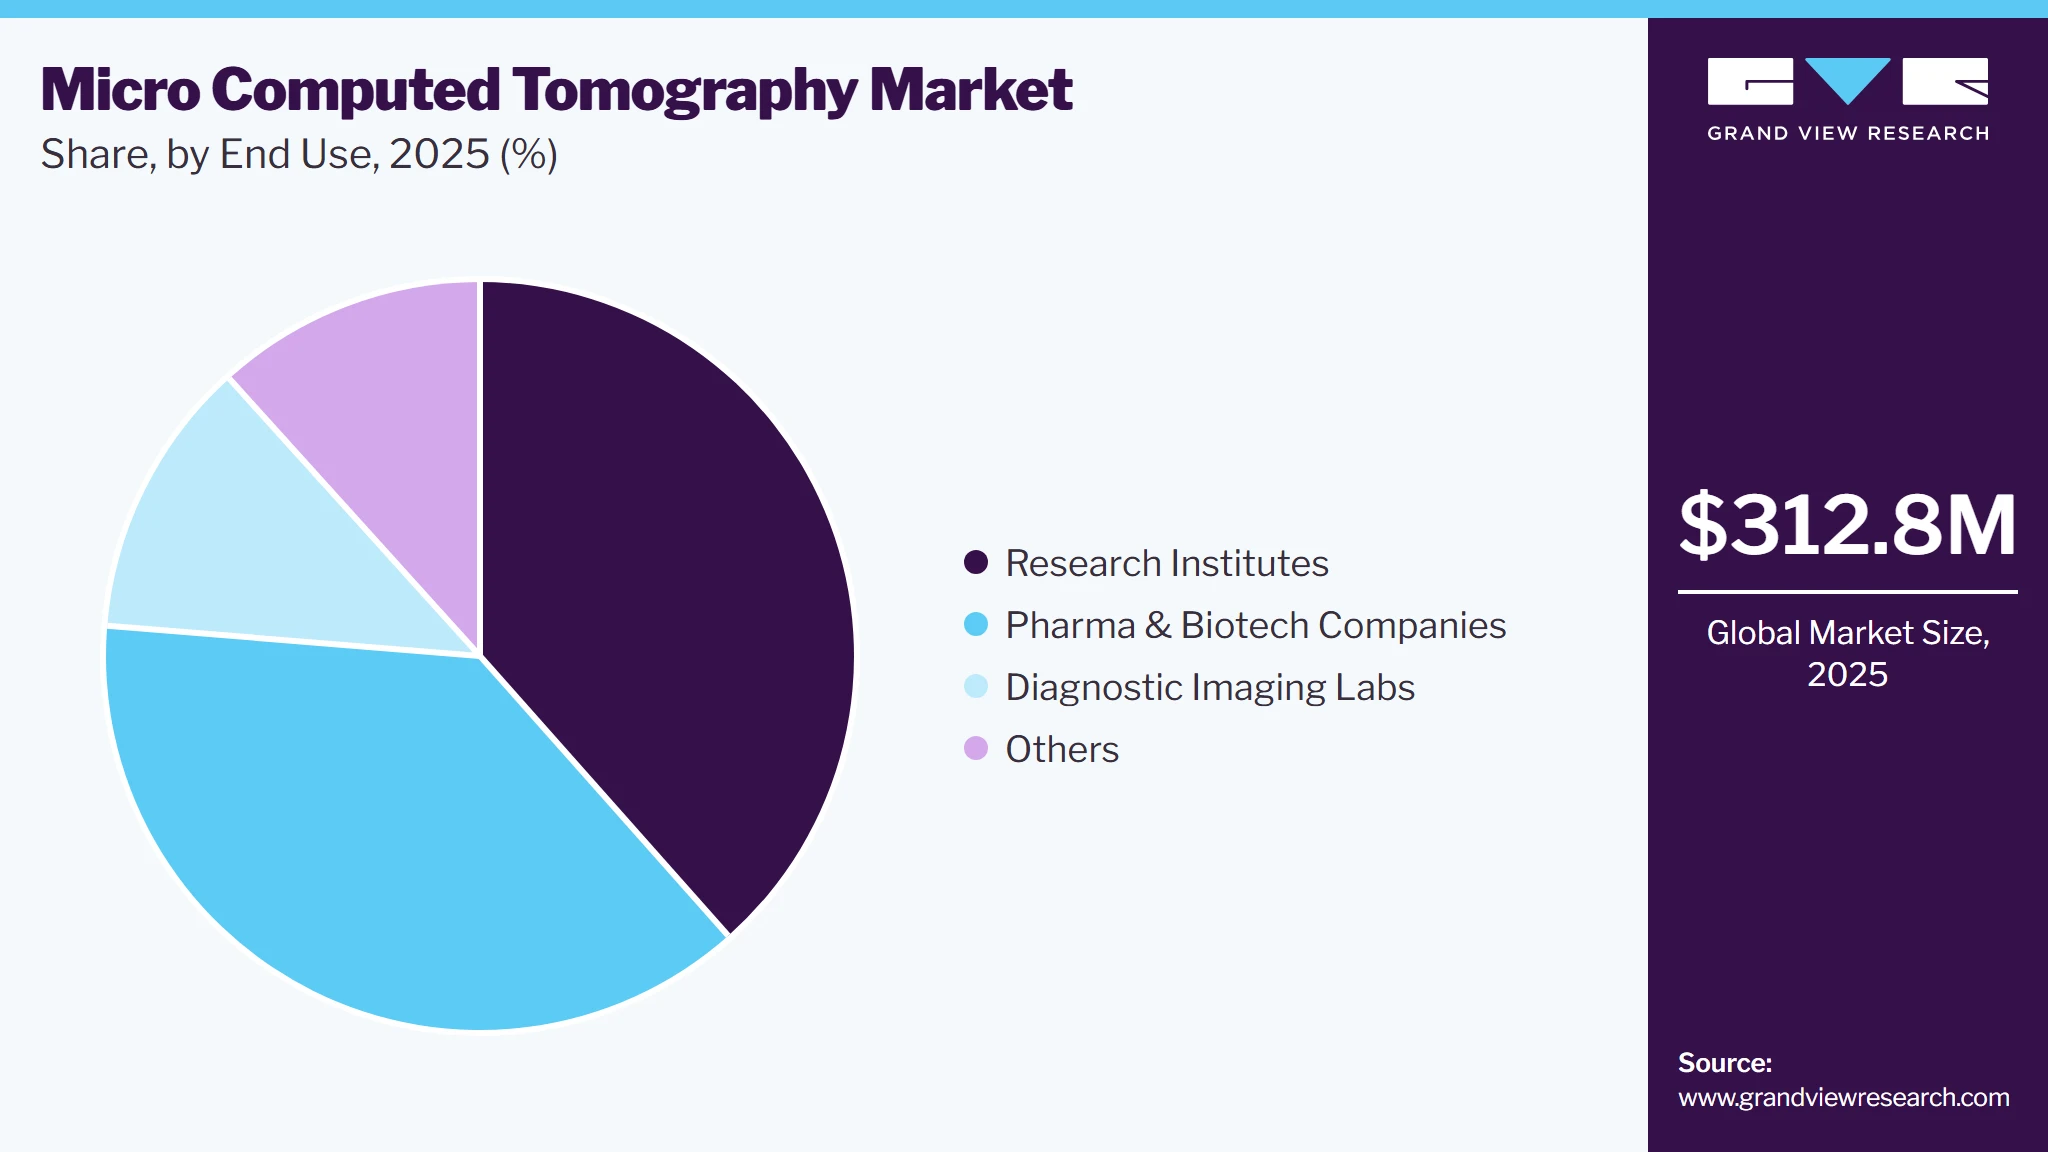
The research institutes segment dominated the market with a revenue share of 38.4% in 2025, supported by the large installed base of micro-CT systems in universities, government laboratories, and core facilities. These institutions use micro-CT across biomedical, materials, geological, and environmental studies, and benefit from public research funding and shared-instrumentation models. For instance, by February 2026, the Rostock and Wisconsin installations above. At the high end, HEPS had supported 222 proposals at 13 user beamlines with more than 700 users from 91 institutes. The breadth of applications and demand for versatile, high-resolution systems continue to make research institutes the primary buyers.
 To learn more about this report, Download Free Sample Report
The pharma & biotech companies segment is expected to witness the fastest growth over the forecast period. Growth is supported by increasing use of micro-CT in preclinical drug discovery and development, particularly for evaluating efficacy and safety in musculoskeletal, oncology, respiratory, and metabolic models. Demand for higher throughput, reproducible quantitative endpoints, and in-house imaging capabilities is encouraging companies to invest in advanced and in-vivo systems. Greater use of imaging biomarkers and AI-enabled analysis within R&D pipelines is expected to reinforce this trend.
Regional Insights
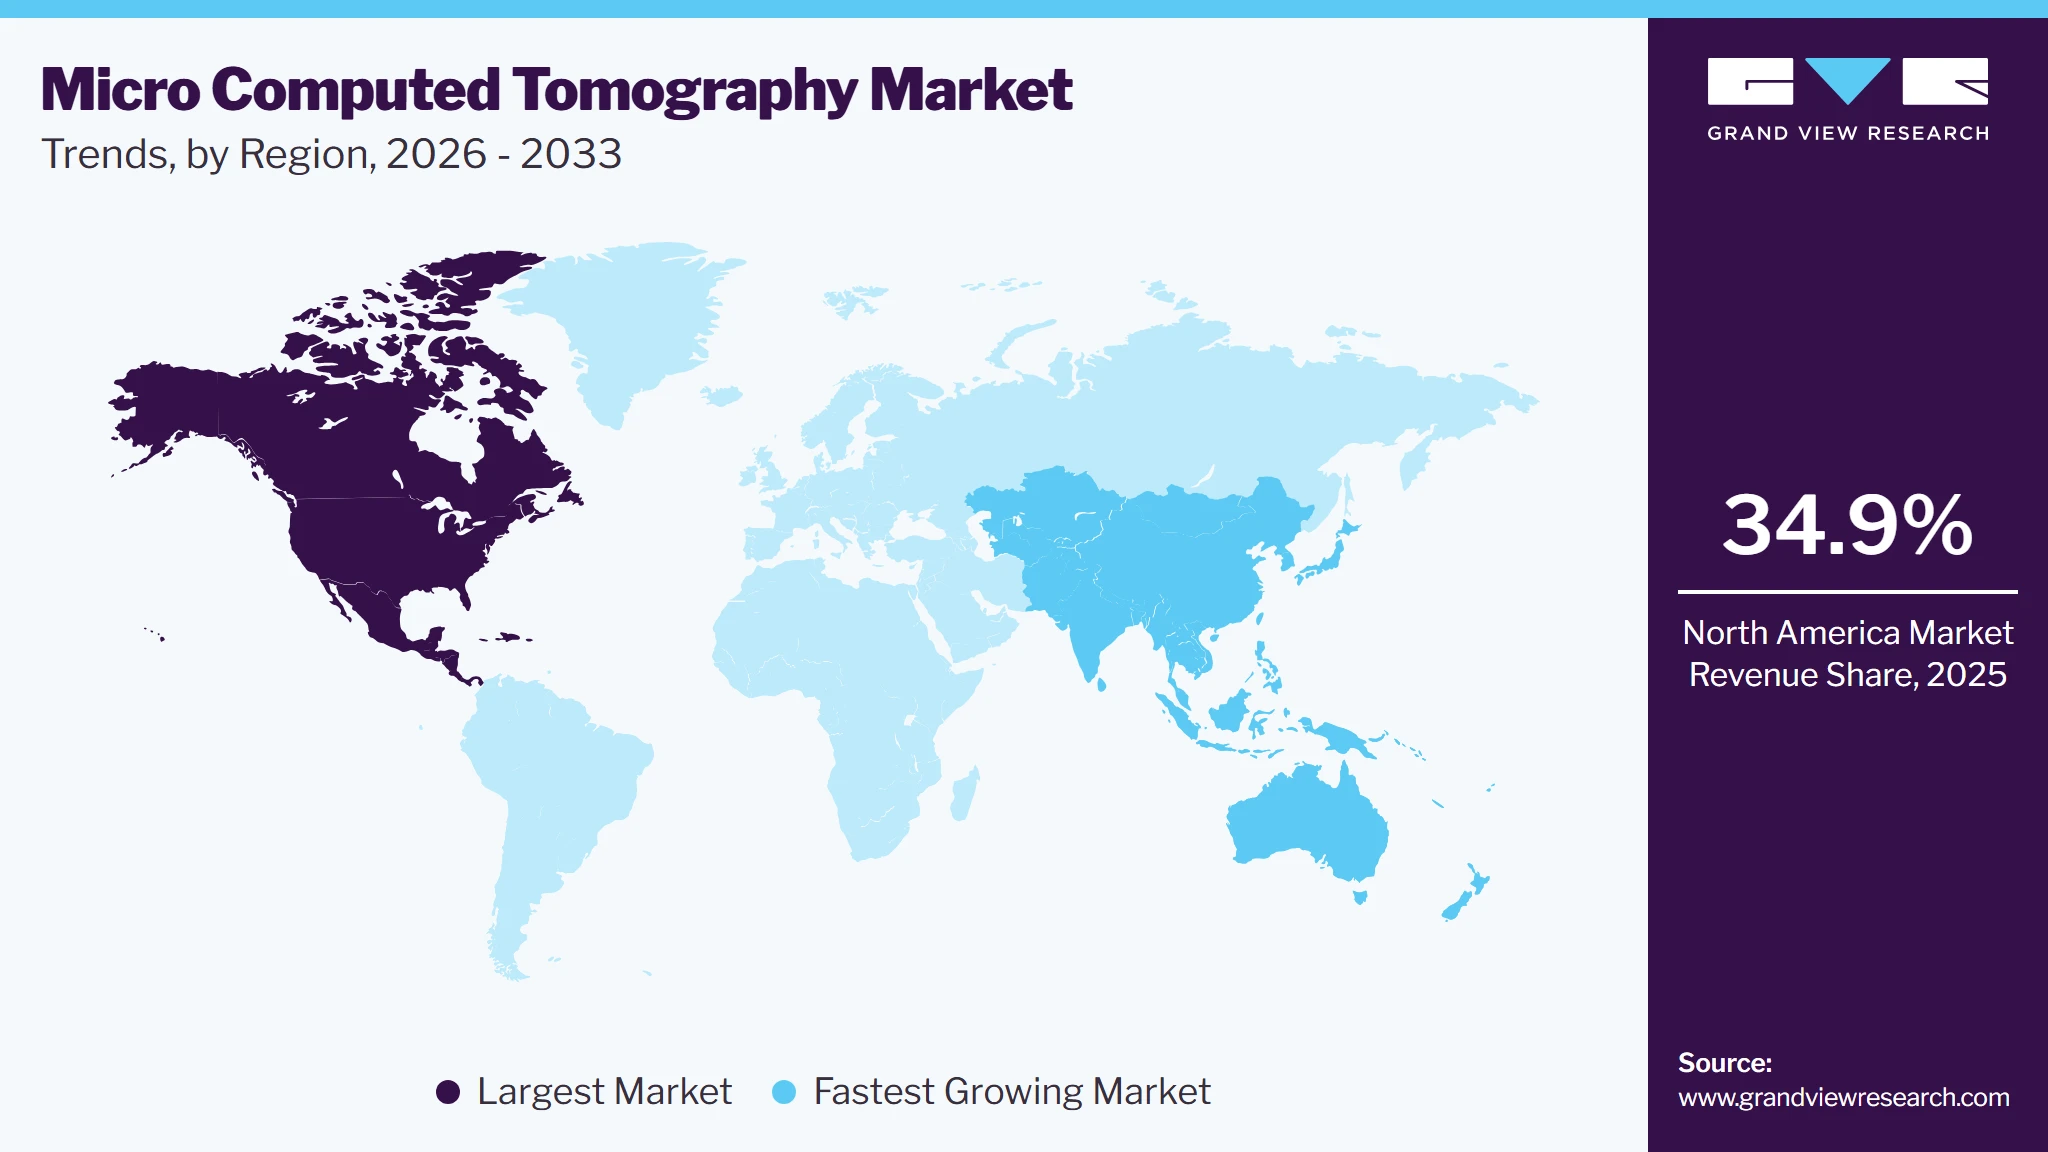
North America accounted for the largest revenue share of 46.4% in 2025, supported by strong public and private research funding, a dense network of academic and research institutions, a large pharmaceutical and biotechnology sector, and the presence of leading micro-CT manufacturers. Industrial inspection is also expanding. North Star Imaging reported Nadcap accreditation for nondestructive testing at its California and Florida facilities in 2026. The U.S. is the main contributor, with extensive use of micro-CT in biomedical, materials, and energy research, and is expected to grow significantly over the forecast period.
 To learn more about this report, Download Free Sample Report
U.S. Micro Computed Tomography Market Trends
The market in theU.S.held the largest share in the north america region in 2025 andis experiencing strong growth due to the APS upgrade and a dense network of vendors and core facilities. The APS upgrade’s brightness gains mean imaging tasks that took hours can now be done in minutes. Recent activity includes the Tescan Warrendale demo lab, Revvity’s Waltham-based preclinical imaging portfolio, and new core-facility purchases such as Wisconsin’s N80.
Europe Micro Computed Tomography Market Trends
The Europe micro CT market is supported by a large bone-health burden (see the IOF projections above), strong battery-manufacturing ambitions, and world-class light sources. European EV sales grew by more than 30% in 2025, the strongest growth among major markets. Facility roadmaps are shaping access. Diamond-II is backed by £519 million of funding, and PETRA IV carries estimated construction costs of about €1.8 billion, with first light expected from 2032.
The U.K. micro CT market is supported by a world-class academic research base, strong life-science and pharmaceutical R&D, and access to national synchrotron and imaging facilities. Demand comes from preclinical research, orthopedics and dental research, materials science, and advanced manufacturing. Government and charity research funding and shared-facility models encourage the use of advanced systems. Growing interest in battery and energy research is also adding to demand.
The Germany micro CT market is characterized by a strong industrial base in automotive, aerospace, and precision engineering, and by a well-funded research sector. Industrial inspection, materials characterization, and additive-manufacturing quality control are important demand drivers alongside biomedical research. The presence of leading imaging and X-ray technology companies and research organizations supports innovation and local availability. Growing battery and electric-vehicle research is expected to strengthen demand for high-resolution and high-speed systems.
The Spain micro CT marketis benefiting from expanding research infrastructure, access to national synchrotron facilities, and growing biomedical and materials research. Public research centers and universities are the main buyers, with applications spanning life sciences, paleontology, geoscience, and industrial materials. Funding variability and regional budget differences influence adoption. Increasing industrial R&D and energy-related research are expected to support gradual market growth.
Asia Pacific Micro Computed Tomography Market Trends
The Asia-Pacific micro computed tomography market is expected to represent the fastest-growing regional markets, supported by rising research and development investment, expanding academic and pharmaceutical research infrastructure, and rapid growth in battery manufacturing, electronics, and advanced materials. China, Japan, South Korea, and India are key contributors, with growing local manufacturing and increasing domestic participation in the micro-CT supply landscape. Government support for scientific research and healthcare innovation is also expanding the installed base.
China's micro CT market is expected to grow rapidly, supported by large government investment in scientific research, a rapidly expanding battery and electric-vehicle industry, and growing biomedical and pharmaceutical R&D. The presence of domestic micro-CT manufacturers and growing localization of advanced instruments improve affordability and availability. Demand is rising in battery and materials inspection, semiconductor and electronics analysis, and preclinical research. The country’s expanding synchrotron and large-facility infrastructure further supports advanced imaging.
Japan's micro CT market is supported by a highly developed research ecosystem, a strong materials, electronics, and automotive industry, and advanced synchrotron infrastructure. The market places strong emphasis on accuracy, reliability, and quality. Key applications include materials and battery research, biomedical and dental studies, and industrial inspection. An aging population and a focus on musculoskeletal and regenerative research support demand for bone-focused micro-CT.
Latin America Micro Computed Tomography Market Trends
The Latin America micro CT marketis expected to expand gradually as research infrastructure develops and academic and industrial imaging capabilities grow. Brazil and Mexico are the main markets. Adoption is influenced by funding constraints and import costs, but increasing collaboration with international institutions and growing use in life sciences and geological research are supporting demand.
Brazil's micro CT market is supported by a strong public research system, a large university network, and advanced national synchrotron infrastructure. Applications include biomedical and dental research, geological and petroleum-related core analysis, and agricultural and materials research. Currency volatility and import costs can affect purchasing, but the country’s strong science base and growing industrial and energy research are expected to support continued growth.
Middle East & Africa Micro Computed Tomography Market Trends
The Middle East & Africa (MEA) micro CT marketis influenced by investment in universities, scientific research facilities, industrial laboratories, and specialized healthcare or biotechnology research. Saudi Arabia and the UAE are relevant markets to assess for research infrastructure and investment in advanced scientific equipment, while Kuwait and South Africa contribute through their research and industrial ecosystems.
The Saudi Arabia micro CT market is supported by a large government investment in research, higher education, and diversification under national development programs. Demand is emerging in petroleum and geoscience research, materials and energy research, and biomedical studies at leading research universities. Investment in advanced research infrastructure is expected to increase the installed base, though the market remains dependent on imports and international technical support.
Key Micro Computed Tomography Company Insights
The micro computed tomography market is moderately competitive, that includes manufacturers of micro-CT systems, high-resolution X-ray microscopy platforms, preclinical imaging systems, and specialized industrial or research imaging solutions. Competition is influenced by spatial resolution, sample capacity, image quality, scanning speed, system footprint, software capabilities, application support, and service coverage.
Key Micro Computed Tomography Companies
The following key companies have been profiled for this study on the micro computed tomography market.
-
Bruker Corporation
-
PerkinElmer Inc.
-
Thermo Fisher Scientific
-
Zeiss
-
NeoScan
-
Sanying Precision Instruments Co.Ltd
-
North Star Imaging Inc
-
SCANCO Medical AG
-
TESCAN
Market Participant Categorization
Category
Operating Strategies
Competitive Edge
Weakness
Established Players (Bruker Corporation, Thermo Fisher Scientific, Zeiss, PerkinElmer Inc.)
Established players are broadening micro-CT from stand-alone scanners into integrated imaging and analysis platforms. Their strategies include raising resolution and speed, adding dynamic and spectral capability, embedding AI-assisted reconstruction and analysis software, and extending portfolios across benchtop, high-resolution and in-vivo systems. They also expand through partnerships with research institutions, pharmaceutical companies and industrial users, and through strengthened global service networks..
Large installed bases, strong brand recognition, broad product portfolios, in-house detector and source expertise, global sales and service infrastructure, and established relationships with research institutes and pharma customers provide a strong foundation. Their ability to bundle hardware with software, training and long-term service supports recurring revenue and customer lock-in.
High system prices relative to smaller competitors, long sales cycles tied to research funding, and dependence on academic and public budgets. They may also face pressure from lower-cost regional vendors and agile specialists, and slower response to niche application needs.
Emerging Players (TESCAN, SCANCO Medical AG, NeoScan, Sanying Precision Instruments Co. Ltd, North Star Imaging Inc.)
Specialized players focus on defined niches, such as dynamic and spectral CT, high-resolution bone imaging, compact preclinical systems, domestic Chinese systems, or industrial inspection. Strategies include rapid product iteration, application-specific systems, competitive pricing, close collaboration with research users, and expansion into new regions through distributors and partnerships.
Focused expertise, faster innovation in targeted areas, flexible configurations, competitive pricing and strong application know-how allow specialists to win in segments where large players are less tailored. Regional vendors benefit from local presence and cost advantages.
Smaller scale and brand reach, limited service and distribution networks, narrower product portfolios, and reliance on third-party components in some cases. Limited installed bases and published evidence relative to established players can slow adoption in larger institutional and pharma accounts.
Recent Development:
-
In October 2026, Xavier University acquired a new micro-CT (micro-computed tomography) scanner, a transformational research tool rarely found at undergraduate teaching institutions. In the announcement from university the Assistant Professor of Biology and 2013 Xavier alumnus Tyler Imfeld, Ph.D said
“To have this kind of infrastructure at a small, teaching-focused institution like Xavier ... it's transformative in ways that I don't think have all been realized just yet.”
– Assistant Professor of Biology and 2013 Xavier alumnus Tyler Imfeld, Ph.D.
-
In July 2026, Fraunhofer EZRT’s RoboCT, a robot-based micro-CT system for large and complex components, was featured as a way to bring large-scale CT out of the lab and into production-adjacent inspection.
Micro Micro Computed Tomography Market Report Scope
Report Attribute
Details
Market size in 2025
USD 312.8 million
Estimated market size in 2026
USD 339.3 million
Projected market size by 2033
USD 611.7 million
Growth rate
CAGR of 8.8% from 2026 to 2033
Base year for estimation
2025
Historical data
2021 - 2024
Forecast period
2026 - 2033
Quantitative units
Revenue in USD million and CAGR from 2026 to 2033
Report coverage
Revenue forecast, company ranking, competitive landscape, growth factors, and trends
Segments covered
Product, technology, application, end use, region
Regional scope
North America; Europe; Asia Pacific; Latin America; MEA
Country scope
U.S.; Canada; Mexico; U.K.; Germany; France; Italy; Spain; Denmark; Sweden; Norway; Japan; China; India; Australia; Thailand; South Korea; Brazil; Argentina; South Africa; Saudi Arabia; UAE; Kuwait
Key companies profiled
Bruker Corporation, PerkinElmer Inc., Thermo Fisher Scientific, Zeiss, NeoScan, Sanying Precision Instruments Co.Ltd, North Star Imaging Inc, SCANCO Medical AG, TESCAN.
Customization scope
Free report customization (equivalent up to 8 analyst’s working days) with purchase. Addition or alteration to country, regional, and segment scope
Pricing and purchase options
Avail customized purchase options to meet your exact research needs. Explore purchase options
Global Micro Computed Tomography Market Report Segmentation
This report forecasts revenue growth at global, regional, and country levels and provides an analysis of the latest industry trends in each of the sub-segments from 2021 to 2033. For the purpose of this study, Grand View Research has segmented the global micro computed tomography market report based on product, technology, application, end use and region:
-
Product Outlook (Revenue, USD Million, 2021 - 2033)
-
Laboratory / Benchtop Micro-CT
-
High-Resolution Micro-CT
-
In-vivo Micro-CT
-
Synchrotron-Based Micro-CT
-
Beamline Micro-CT Systems
-
-
Technology Outlook (Revenue, USD Million, 2021 - 2033)
-
Spatial Resolution
-
Phase-Contrast Imaging
-
Spectral / Multi-Energy Imaging
-
High-Speed Scanning
-
AI-Assisted Reconstruction
-
Others
-
-
Application Outlook (Revenue, USD Million, 2021 - 2033)
-
Biomedical & Preclinical Research
-
Materials & Industrial Research
-
Energy & Battery Research
-
Pharmaceutical Research
-
Geological & Environmental Research
-
Others
-
-
End Use Outlook (Revenue, USD Million, 2021 - 2033)
-
Research Institutes
-
Pharma & Biotech Companies
-
Diagnostic Imaging Labs
-
Others
-
-
Region Outlook (Revenue, USD Million, 2021 - 2033)
-
North America
-
U.S.
-
Canada
-
Mexico
-
-
Europe
-
U.K.
-
Germany
-
France
-
Italy
-
Spain
-
Denmark
-
Sweden
-
Norway
-
-
Asia Pacific
-
China
-
Japan
-
South Korea
-
India
-
Australia
-
Thailand
-
-
Latin America
-
Brazil
-
Argentina
-
-
MEA
-
Saudi Arabia
-
South Africa
-
UAE
-
Kuwait
-
-
Research Methodology
The micro computed tomography marketfigures in this report are based on a proven research process that combines executive interviews with secondary research from proprietary databases, company filings, and recognized regulatory and institutional sources. Market size is built through value-chain sizing-reconciling supply-side and demand-side estimates-and triangulated with bottom-up and top-down approaches. Every estimate passes multiple levels of expert validation before publication, with each micro computed tomography segment quantified using the revenue-capture definitions in the table below.
Segment Definition
Product
Revenue capture definition
Laboratory / Benchtop Micro-CT
Revenue generated from qualifying laboratory or benchtop micro-CT systems used for research, materials characterization, or other in-scope applications.
High-Resolution Micro-CT
Revenue generated from systems primarily marketed or classified for high-resolution micro-CT imaging. A system already counted as benchtop or in-vivo should not be counted again.
In-vivo Micro-CT
Revenue generated from systems designed and marketed for in-vivo imaging, particularly preclinical small-animal research.
Synchrotron-Based Micro-CT
Revenue generated from qualifying micro-CT instrumentation specifically attributable to synchrotron-based systems, where separately identifiable.
Beamline Micro-CT Systems
Revenue generated from qualifying beamline micro-CT instrumentation and associated equipment where the scope explicitly includes these systems. Avoid overlap with synchrotron-based systems.
Technology
Revenue capture definition
Spatial Resolution
Revenue attributable to systems classified by a defined spatial-resolution category or capability. The classification must be exclusive if market shares are calculated.
Phase-Contrast Imaging
Revenue generated from systems sold with qualifying phase-contrast imaging capabilities, where the revenue can be assigned separately or systems are classified by their primary technology.
Spectral / Multi-Energy Imaging
Revenue generated from qualifying systems with spectral or multi-energy imaging capabilities.
High-Speed Scanning
Revenue generated from systems primarily classified by high-speed acquisition capabilities under a defined technical threshold.
AI-Assisted Reconstruction
Revenue attributable to systems or software incorporating qualifying AI-assisted reconstruction. If software is not separately measured, do not add a notional AI revenue amount to the full instrument revenue.
Others
Revenue generated from qualifying technologies such as photon-counting detector technology, multi-modal micro-ct integration, dynamic / time-resolved micro-ct.
Application
Revenue capture definition
Biomedical & Preclinical Research
Revenue generated from systems purchased primarily for biomedical, biological specimen, and preclinical imaging applications.
Materials & Industrial Research
Revenue generated from qualifying systems primarily used for materials characterization, non-destructive evaluation, and industrial research.
Energy & Battery Research
Revenue generated from systems primarily used for battery, energy-storage, and other qualifying energy-material research.
Pharmaceutical Research
Revenue generated from systems primarily used for pharmaceutical or biotechnology research where the use can be distinguished from general biomedical research.
Geological & Environmental Research
Revenue generated from systems primarily used for geological, environmental, soil, rock, fossil, and related research.
Others
Revenue generated from systems used in electronics & semiconductor research, food & agriculture research, forensic research applications.
End Use
Revenue capture definition
Research Institutes
Revenue generated from systems purchased by universities, public research institutions, national laboratories, and other qualifying research organizations.
Pharma & Biotech Companies
Revenue generated from systems purchased directly by pharmaceutical and biotechnology companies. External imaging-service expenditure should be excluded unless services are explicitly in scope.
Diagnostic Imaging Labs
Revenue generated from qualifying micro-CT systems purchased by specialized imaging laboratories. Conventional clinical CT equipment should be excluded..
Others
Revenue generated from qualifying electronics & semiconductor companies, automotive & aerospace companies, food & beverage companies, mining/oil & gas companies.
Estimation Model
No Stage
Key Question
Process Steps
Data Sources
01
Scope Definition
Which systems, technologies, applications and users are included in the micro-CT market?
1. Define micro-CT systems by product type: laboratory/benchtop, high-resolution, in-vivo, synchrotron-based and beamline systems. Include the associated software and services.
2. Define the technologies covered: spatial resolution, phase-contrast, spectral/multi-energy, high-speed scanning and AI-assisted reconstruction
3. Segment the market by product, technology, application, end use and region, including country-level coverage.
4. Align the base year (2025) and forecast horizon (2026-2033) for the market assessment.Company filings and product catalogs, scientific publications, industry and standards bodies, synchrotron and research facility reports.
02
Build the Product Base
How large is the installed base of micro-CT systems and the annual demand for new and replacement units?
1. Estimate the installed base and annual system shipments in each region and country, split by product type.
2. Map demand across end users (research institutes, pharma and biotech, diagnostic imaging labs, others) and applications.
3. Assess replacement and upgrade cycles, including retrofits to higher resolution or newer detectors and sources.
4. Adjust for funding availability, shared core-facility models, and access constraints at synchrotron and beamline facilities.Research funding databases (e.g., NIH, NSF, Horizon Europe), public procurement and tender records, university and core facility equipment listings, facility annual reports.
03
Estimate Penetration
How widely is micro-CT used within each application and end-use segment, and how intensively?
1. Estimate adoption rates by application, including biomedical and preclinical, materials and industrial, energy and battery, pharmaceutical, and geological and environmental research.
2. Assess utilization by purpose, including (longitudinal in-vivo studies, high-throughput screening, failure analysis, and in-situ or 4D experiments
3. Evaluate adoption drivers, including resolution needs, scan speed, AI-enabled workflows, funding and published-evidence trends.
4. Estimate technology-mix shift over the forecast period, such as growth in AI-assisted reconstruction and spectral imaging.Peer-reviewed literature, researcher and core-facility surveys, conference proceedings, patent filings, industry and distributor expert interviews.
04
Revenue Conversion
How do installed base, shipments and utilization translate into market revenue?
1. Collect average selling prices by product type and region, including manufacturer price lists, tender values and distributor pricing.
2. Calculate system revenue from unit shipments, then add service contracts, software licenses, upgrades and consumables..
3. Segment revenue by product, technology, application, end use and region.
4. Cross-check the calculated market value against company revenues, unit shipments, distributor feedback and expert interviews.Manufacturer price lists, company financial reports, distributor and tender databases, procurement databases, primary interview
Delivered Customizations
CLIENT REQUEST
CUSTOMIZATION DELIVERED
VALUE ADDS
Porter Analysis
Conducted a detailed Porter’s Five Forces analysis of the micro computed tomography market, evaluating competitive rivalry across instrument manufacturers, specialized preclinical and industrial vendors, and regional (particularly Chinese) entrants. The assessment covered supplier power across X-ray sources, detectors, precision stages and software/GPU components. It also covered buyer power among research institutes, pharma and biotech companies, core facilities and industrial users, and substitutes including electron and optical microscopy, MRI, histology, nano-CT, clinical CT and conventional X-ray. Barriers to entry included capital cost, X-ray source and detector technology, intellectual property, radiation-safety compliance, service networks and software capability.
Enables stakeholders to understand the competitive attractiveness of the micro-CT market, supporting decisions on partnerships, product differentiation, software and AI investment, channel strategy and market entry.
Competitive Landscape
Conducted a comprehensive application analysis of micro-CT across biomedical and preclinical research, materials and industrial research, energy and battery research, pharmaceutical research, and geological and environmental research. The analysis evaluated use cases including bone and musculoskeletal morphology, longitudinal in-vivo small-animal imaging, implant and tissue-engineering studies, porosity and defect analysis, additive-manufacturing inspection, battery electrode and cell characterization, core and rock analysis, and in-situ or 4D dynamic studies.
Helps stakeholders identify high-value applications and use cases driving micro-CT adoption, supporting product positioning, feature development, software and AI integration, and channel and customer strategy.
Geographical Analysis
Conducted a detailed PESTEL analysis examining the political, economic, social, technological, environmental and legal factors shaping the micro-CT market. The assessment covered public research funding and science policy, investment in large-scale research facilities, trade and export controls, currency and import costs, healthcare and bone-disease burden, growth in EV and battery manufacturing, advances in X-ray sources, detectors and AI reconstruction, sustainability and energy-transition priorities, radiation-safety regulation, and GLP/GMP data-integrity requirements.
Enables stakeholders to evaluate macro-environmental opportunities and risks shaping micro-CT adoption, supporting market-entry planning, pricing, technology investment and geographic prioritization.
Frequently Asked Questions About This Report
Some key players operating in the micro-CT market include Bruker Corporation, PerkinElmer Inc., Thermo Fisher Scientific, Zeiss, NeoScan, Sanying Precision Instruments Co.Ltd, North Star Imaging Inc, SCANCO Medical AG, TESCAN.
Key factors that are driving the micro-CT market growth include, a wide range of applications, technological advancements, and increase in use of micro CT for research and development activities
Asia Pacific is the fastest-growing region over the forecast period.
The global micro computed tomography market size was valued at USD 312.8 million in 2025 and is estimated at USD 339.3 million in 2026.
The global micro computed tomography market is expected to grow at a CAGR of 8.8% from 2026 to 2033, reaching USD 611.7 million by 2033.
North America dominated with a 46.4% revenue share in 2025.
Laboratory / Benchtop Micro-CT segment dominated the market, with a revenue share of 52.2% in 2025.
Biomedical & preclinical research segment held the largest revenue share of 36.0% in 2025 while energy & battery research segment is expected to be the fastest-growing market.
The research institutes segment dominated the market with a revenue share of 38.4% in 2025, supported by the large installed base of micro-CT systems in universities, government laboratories, and core facilities.
About the Author(s)
Medical Devices Research Team
Healthcare · Medical DevicesThis report was authored by the medical devices research team at Grand View Research - comprising two research analysts, one senior research analyst, and one industry expert - with specialized expertise in the medical devices segment of the healthcare industry. All findings are based on proprietary healthcare databases, executive interviews, and regulatory analysis, subject to internal peer review prior to publication.
Last Updated:
Speak to Analyst

Customize this report to your needs - add regions, segments, or data points, with 20% free customization.
Or view our licence options:


ISO 9001:2015 & 27001:2022 Certified
We are GDPR and CCPA compliant! Your transaction & personal information is safe and secure. For more details, please read our privacy policy.


