- Home
- »
- Next Generation Technologies
- »
-
Projection Mapping Market Size & Share Report, 2022-2030GVR Report cover
![Projection Mapping Market Size, Share & Trends Report]()
Projection Mapping Market Size, Share & Trends Analysis Report By Dimension (2D, 3D, And 4D), By Throw Distance (Short Throw, Standard Throw), By Application (Events, Large Venue), By Region, And Segment Forecasts, 2022 - 2030
- Report ID: GVR-4-68039-951-1
- Number of Report Pages: 80
- Format: PDF, Horizon Databook
- Historical Range: 2017 - 2020
- Forecast Period: 2022 - 2030
- Industry: Technology
Report Overview
The global projection mapping market size was valued at USD 3.2 billion in 2021 and is expected to expand at a compound annual growth rate (CAGR) of 10.9% from 2022 to 2030. Factors such as increasing demand for various events, and rising demand for better projectors for permanent and semi-permanent installation are driving the demand for projection mapping. Additionally, the advancement in the technology of video projection is also fueling the demand for projection mapping around the world. In June 2022, ViewSonic Corporation, a global provider of visual solutions, announced the launch of its new X1 and X2 Light Emitting Diode (LED) projectors for home cinema seekers that offer high brightness features.

The projector features 3rd generation LED technology that delivers brighter and vivid visuals and 30,000-hour long lifespans. The projector offers an instantaneous entertainment experience along with flexible installation options. The COVID-19 pandemic severely affected the projection mapping industry, especially land-based events, owing to the complete ban on social gathering events across most parts of the world. The projection mapping market experienced a significant decline in growth during the pandemic. For instance, the UN cultural agency revealed that nearly 90 percent of treasured cultural institutions were closed.
Projection mapping can be defined as a 3D video projection technique that uses colors and lights to project virtual images on non-flat surfaces or irregular shapes like city landmarks, industrial sites, public buildings, and several others. Projection mapping offers a unique opportunity to immerse and attract a large audience with inspiring spectacles and captivating shows even from a distance. The projection mapping dimension involves providing a better experience to the audience. Various service providers who want different dimension type for projection mapping can connect to various manufacturers. The services provider will fulfill the demand as per the requirements of the customer providing end-to-end fulfillment service.
Moreover, the high installation cost associated with the type of dimension implementation is restraining the market growth. Also, factors such as constant developments in projectors and associated technologies is resulting in additional costs. Such factors are creating dissatisfaction among the clients, as a result customers are shifting towards alternative solutions providers that offer cost-efficient services. Additionally, the lack of technological expertise and knowledge is further hampering the projection mapping industry growth.
Dimension Type Insights
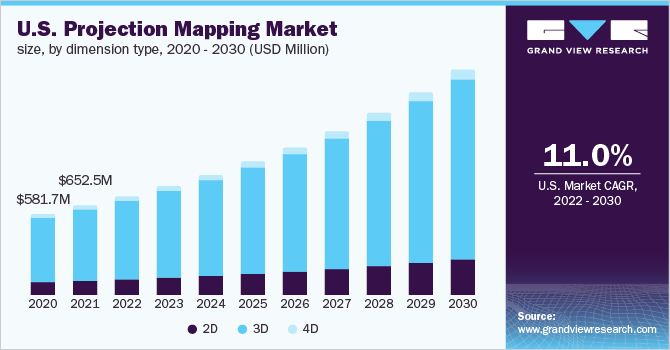
The 2D projection mapping segment is expected to register a CAGR of 9.8% over the forecast period. The growth of the 2D projection mapping segment can be attributed to its simplified usage. Moreover, 3D and 4D technologies have a high potential of gathering a large audience however, 2D projection mapping executed by experts can also create a highly enhanced visual experience for end-users. The reduction in the costs of 3D and 4D projection mapping technologies over the past few years is also driving the segment growth.
Furthermore, the 3D and 4D mapping segments accounted for a significant market share with a CAGR of 11.0% and 14.7% respectively over the forecast period. This growth can be attributed to the increase in the number of projection mapping applications and events and entertainment activities, especially in the Asia Pacific region.
Throw Distance Insights
The standard throw segment accounted for the largest revenue share of 68.7% in 2021. The segment is projected to witness a CAGR of 11.2% over the forecast period. The growth of this segment can be attributed to the growing number of events and activities which require projectors that have high brightness and pixel resolutions for the projection. Furthermore, the short-throw is expected to witness a CAGR of 10.2% over the forecast period.
Application Insights
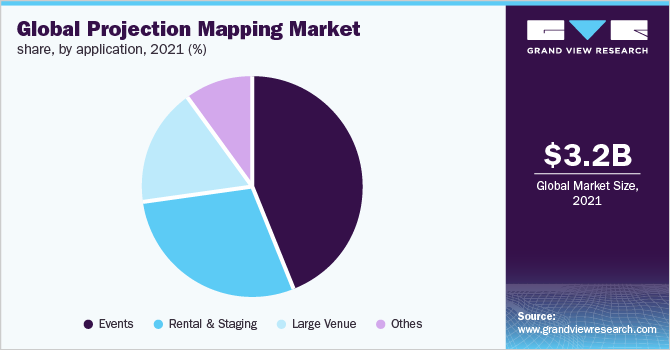
The events segment dominated the market and held the largest revenue share of 43.6% in 2021 and is projected to retain its position over the forecast period. The growth of this segment can be attributed to the growing media events and sporting events around the globe.

Furthermore, projection mapping is being highly utilized in the half-time shows of sports events, launch events, and at venues such as places with huge crowd gatherings and auditoriums to improve the visual experience and simplify high audience engagement. The rental and staging segment is expected to grow at the fastest CAGR of over 13.0% in the coming years This is attributed to the increased demand for projection mapping from organizations for the advertising and marketing of their products, corporate events, and product launches. In April 2022, Digital Projection featured its new TITAN laser 33000 4K-UHD projector in the show of a national heroine at the historic Jhansi fort in Northern India with the support of eight projectors to enhance the visitor experience.
Regional Insights
Asia Pacific dominated the market and accounted for the largest revenue share of 39.3% in 2021. The region is anticipated to expand at the highest CAGR of over 12.1% over the forecast period. The growth of the regional market can be attributed to the existence of market players in the region. Growing tourism and advertising, mass events, increasing investment and expenditure by governments, and new technology adoption in the region along with a large number of service providers are the key drivers for market growth in the region.
North America is expected to be the fastest-growing region and is anticipated to expand at a CAGR of over 10.3% over the forecast period. Factors such as the existence of leading companies that manufacture or develop the hardware and software, and technology infrastructure facilities for projection mapping are the reasons for the growth of the market in the region.
Key Companies & Market Share Insights
The competitive landscape of the market is fragmented, featuring several global as well as regional players. The key participants are entering into strategic collaborations, partnerships, and mergers and acquisitions to expand their business footprint and survive the highly competitive environment. Moreover, service providers are investing considerably in research and development activities to incorporate new technologies in their offerings and develop advanced products to gain a competitive advantage over other market players.
For instance, in August 2021, BenQ announced a partnership with Fly Elise-ng, a Netherlands -based image alignment solution provider. As a part of this strategic partnership, BenQ offered its consultancy and integration expertise to Fly Elise-ng and integrated Fly Elise-ng’s Auto-alignment, Design Pro, and Edge-blending solutions into its product portfolio. Some of the prominent players in the projection mapping market include:
-
AV Stumpfl GmbH
-
Barco
-
BenQ
-
Christie Digital Systems USA, Inc
-
Digital Projection
-
Optoma Corporation
-
Panasonic Corporation
-
Seiko Epson Corporation
-
Sharp NEC Display Solutions
-
Vivitek, INC
-
ViewSonic Corporation
Projection Mapping Market Report Scope
Report Attribute
Details
Market size value in 2021
USD 3,169.0 million
Revenue forecast in 2030
USD 8.0 billion
Growth Rate
CAGR of 10.9% from 2022 to 2030
Base year for estimation
2021
Historical data
2017 - 2020
Forecast period
2022 - 2030
Quantitative units
Revenue in USD Billion and CAGR from 2022 to 2030
Report coverage
Revenue forecast, company ranking, competitive landscape, growth factors, and trends
Segments covered
Dimension type, throw distance, application, region
Regional scope
North America; Europe; Asia Pacific; Latin America; MEA
Country scope
U.S.; Canada; U.K.; Germany; France; Italy; Rest of Europe; China; India; Japan; Rest of Asia Pacific, Brazil; Mexico, Rest of Latin America
Key companies profiled
AV Stumpfl GmbH; Barco; BenQ; Christie Digital Systems USA, Inc.; Digital Projection; Optoma Corporation; Panasonic Corporation; Seiko Epson Corporation; Sharp NEC Display Solutions; Vivitek, INC.; ViewSonic Corporation
Customization scope
Free report customization (equivalent up to 8 analyst’s working days) with purchase. Addition or alteration to country, regional, and segment scope.
Pricing and purchase options
Avail customized purchase options to meet your exact research needs. Explore purchase options
Segments Covered in the Report
This report forecasts revenue growth at global, regional, and country levels and provides an analysis of the latest industry trends in each of the sub-segments from 2017 to 2030. For this study, Grand View Research has segmented the global projection mapping market report based on dimension type, throw distance, application, and region:
-
Dimension Type Outlook (Revenue, USD Million, 2017 - 2030)
-
2D
-
3D
-
4D
-
-
Throw Distance Outlook (Revenue, USD Million, 2017 - 2030)
-
Short throw
-
Standard throw
-
-
Application Outlook (Revenue, USD Million, 2017 - 2030)
-
Events
-
Rental & Staging
-
Large Venue
-
Others
-
-
Regional Outlook (Revenue, USD Million, 2017 - 2030)
-
North America
-
U.S.
-
Canada
-
-
Europe
-
U.K.
-
Germany
-
France
-
Italy
-
Rest of Europe
-
-
Asia Pacific
-
China
-
India
-
Japan
-
Rest of Asia Pacific
-
-
Latin America
-
Brazil
-
Mexico
-
Rest of Latin America
-
-
Middle East & Africa
-
Frequently Asked Questions About This Report
b. The global projection mapping market size was estimated at USD 3.2 billion in 2021 and is expected to reach USD 3,169.0 million in 2022.
b. The global projection mapping market is expected to grow at a compound annual growth rate of 10.9% from 2022 to 2030 to reach USD 8.0 billion by 2030.
b. Asia Pacific dominated the projection mapping market with a share of 39.3% in 2021. This is attributable to the increasing investment by the government as well as private organizations to support and bring advanced technology use across the region.
b. Some key players operating in the projection mapping market include AV Stumpfl GmbH, Barco, BenQ, Christie Digital Systems USA, Inc, Digital Projection, Optoma Corporation, Panasonic Corporation, Seiko Epson Corporation, Sharp NEC Display Solutions, Vivitek, INC, and ViewSonic Corporation.
b. Key factors that are driving the projection mapping market growth include increasing demand for various events and rising demand for better projectors for permanent and semi-permanent installation.
Share this report with your colleague or friend.
![gvr icn]()
NEED A CUSTOM REPORT?
We can customize every report - free of charge - including purchasing stand-alone sections or country-level reports, as well as offer affordable discounts for start-ups & universities. Contact us now
![Certified Icon]()
We are GDPR and CCPA compliant! Your transaction & personal information is safe and secure. For more details, please read our privacy policy.
We are committed towards customer satisfaction, and quality service.
"The quality of research they have done for us has been excellent."


