GVR Report cover Prosthetics And Orthotics Market Size, Share & Trends Report

Prosthetics And Orthotics Market Size, Share & Trends Analysis Report By Product Type (Orthotics (Upper Limb, Lower Limb, Spinal), Prosthetics (Upper Extremity, Lower Extremity)), By Region, And Segment Forecasts, 2024 - 2030

  • Report ID: GVR-2-68038-553-3
  • Number of Pages: 125
  • Format: Electronic (PDF)
  • Historical Range: 2018 - 2023
  • Industry: Healthcare

Prosthetics And Orthotics Market Trends

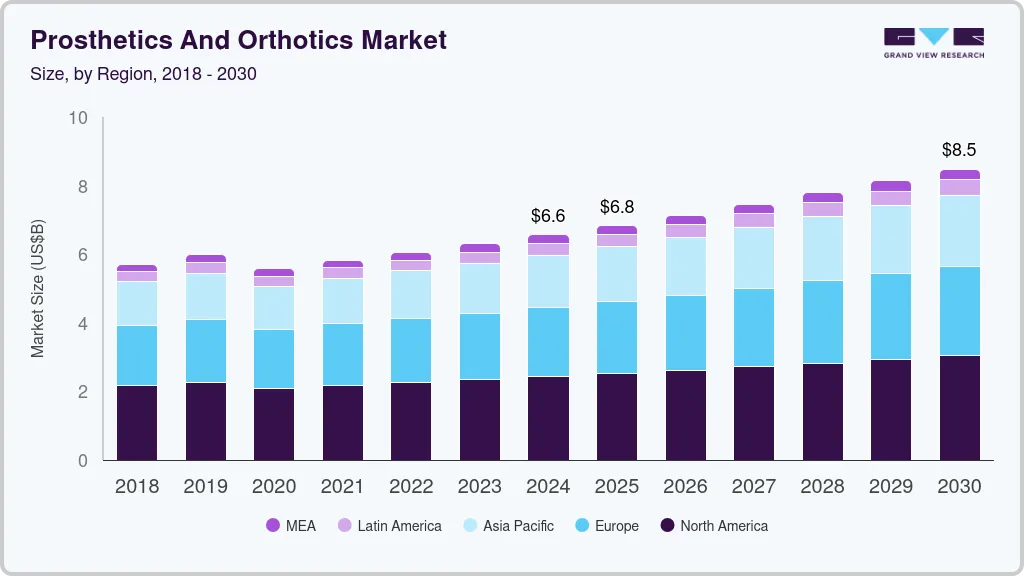
The global prosthetics and orthotics market size was valued at USD 6.92 billion in 2023 and is projected to grow at a compound annual growth rate (CAGR) of 4.4% from 2024 to 2030. Rising incidences of sports injuries and road accidents, a growing number of diabetes-related amputations, and increasing prevalence of osteosarcoma across the globe are attributed to drive the market. For instance, according to Stanford University, in the U.S., annually, more than 3.5 million children suffer from sports injuries. Thus, sports-induced injury is anticipated to drive the demand for prosthetics and orthotics solutions during the forecast period.

U.S. Prosthetics And Orthotics market size and growth rate, 2024 - 2030

Moreover, rise in incidence of road accidents drives the market growth. For instance, according to data published by the World Health Organization (WHO), around 1.19 million people die annually due to road traffic crashes, and around 20-50 million people across the globe are injured or disabled owing to road accidents. Similarly, according to the Ministry of Road Transport and Highways, around 4,61,312 road accidents were reported in India in 2022. Such factors are fueling market growth.
Total number of Accidents in Indiafrom 2018 to 2022

Furthermore, rise in the number of diabetes-related amputations fuels the market growth. Individuals living with diabetes are at a higher risk of developing foot complications due to nerve damage, which can lead to chronic ulcers and amputation. Diabetes-related foot complications are one of the most common and severe complications that affect people with diabetes across the globe. Several studies have shown that the risk of amputation could be up to 25 times higher for people with diabetes than a person without the condition. For instance, in the U.S., annually, approximately 154,000 people with diabetes undergo amputation, and diabetes complications cause 80% of non-traumatic lower limb amputations.

Technological advancement in orthotics & prosthetics is expected to boost the market growth over the forecast period. 3D printed prosthetics by Limb Forge are expected to gain market penetration in developing regions due to their cost-effectiveness and ease of usage. In addition, in June 2022, Ottobock introduced the C-Leg 4 knee prosthetic. This new model boasts a deep-sleep mode to conserve battery power and a redesigned charger that can be used with one hand for added convenience. It has been designed to perform various functions, including improved stance release, assisted descent on stairs and ramps, better support while sitting down, and 'Stumble Recovery Plus.' All these functions can be adjusted and controlled via the company's 'Cockpit' app.

 Market Concentration & Characteristics

Market growth stage is high, and pace of the market growth is accelerating. The market is characterized by a moderate-to-high degree of growth due to rising R&D programs, and increased investment in developing prosthetics and orthotics solutions. For instance, in October 2022, researchers from Brown University and the Massachusetts Institute of Technology developed sophisticated ways to monitor muscle movements by using a simple set of magnets to make it easier for people with amputations to control their prosthetic limbs.

Prosthetics And Orthotics Market Concentration & Characteristics

The market is characterized by a high degree of innovation due to rapid technological advancements. For instance, in February 2022, Össur introduced its ‘POWER KNEE,’ a microprocessor prosthetic knee designed for people facing above-knee amputation or limb difference. The company has used a motor-powered “smart” prosthesis, which leverages advanced algorithms for detecting patterns in human movement, thus adjusting and learning the user’s rhythm and speed in real time.

Prosthetics and orthotics industry is characterized by a medium level of merger and acquisition (M&A) activity by the leading players. This is due to several factors, including the desire to access new technologies in a rapidly growing market. For instance, in August 2022, Össur acquired Naked Prosthetics, a Washington-based company that provides finger prostheses. The acquisition aims to fulfill the needs of the growing number of patients with finger and partial hand loss. In addition, it helps Össur to strengthen its upper limb product portfolio globally.
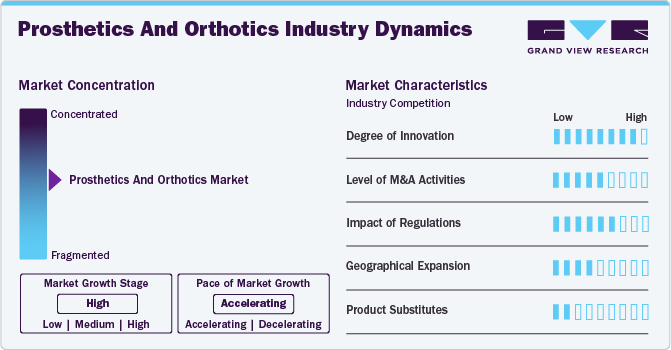
The structured regulatory framework for prosthetics and orthotics solutions positively impacts market growth. Data published by WHO reported that according to the Convention on the Rights of Persons with Disabilities (CRPD), Member States must implement effective measures for ensuring personal mobility and promoting accessibility to mobility devices and assistive technologies, including orthoses and prostheses. Over 170 countries have ratified the CRPD since 2006, making it mandatory to ensure availability and affordability of high-quality assistive products such as prostheses and orthoses. In addition, the Therapeutic Goods Administration (TGA) regulates prosthetics and orthotic devices in Australia.

Several market players are adopting this strategy to expand their product portfolio and market their products in different regions. For instance, in January 2023, WillowWood Global LLC, a manufacturer and distributor of prosthetic products, partnered with Reboocon Bionics B.V., a manufacturer of the motorized prosthetic knee. This partnership focused on distribution of products in the U.S. market and R&D collaboration to advance prosthetics technology.

Several market players and research institutes are developing robotic arms which can be used as prosthetics. For instance, in May 2022, University of Minnesota Twin Cities researchers collaborated with industry players. This new development in robotics has enabled amputees to control a robotic arm using their brain signals instead of relying on muscle movements.

Product Type Insights

By product type, market is segmented into orthotics and prosthetics. Orthotics segment accounted for largest revenue share of 71.7% in 2023. Growth of this segment is attributed to rising prevalence of osteoarthritis, increasing incidences of sports injuries, and growing penetration of orthopedic technology. For instance, according to data published by the Institute for Health Metrics and Evaluation in August 2023, currently, 15% of people aged 30 and above suffer from osteoarthritis. It is projected osteoarthritis is expected to affect approximately 1 billion people by 2050. Orthotics segment is further segmented into upper limb, lower limb, and spinal. Upper limb orthotics accounted for the largest share owing to various benefits, such as reduced pain and rapid recovery in terms of movement.

Global Prosthetics And Orthotics market share and size, 2023

Prosthetics segment is expected to register the fastest CAGR during the forecast period. An increase in the disability rate globally is expected to drive the market over the forecast period. For instance, according to WHO, around 1.3 billion people experience significant disability, which accounts for 16% of the global population. Furthermore, a report published by the Rehabilitation Research and Training Center on Disability Statistics and Demographics in 2023 showed that the number of people with disabilities in the U.S. increased from around 18,232,000 in 2010 to 20,270,000 in 2021. Thus, rise in number of disabled people fuels demand for prosthetics and orthotic devices.

Regional Insights

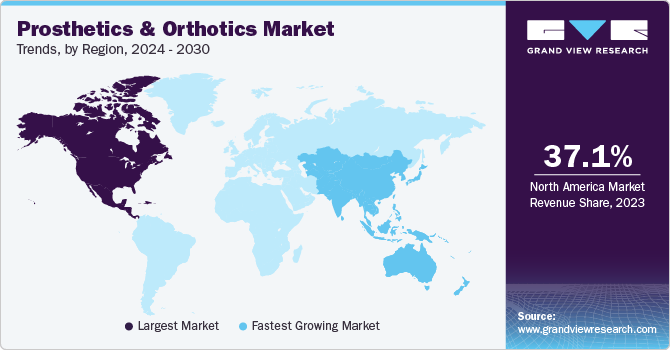
North America dominated the market with a revenue share of 37.1% in 2023. This growth can be attributed to well-established healthcare infrastructure, increasing R&D investments by companies, and favorable reimbursement policies. Moreover, the rising prevalence of osteosarcoma and increasing incidences of sports injuries are expected to drive market growth. Moreover, the focus of the U.S. healthcare system on the quality of care and value-based services has led to a favorable market environment for prosthetics & orthotics. For instance, in August 2023, LIMBER Prosthetics & Orthotics, Inc., a San Diego startup company, received an investment of USD 388K to develop their prosthetics & orthotics products.
Prosthetics And Orthotics Market Trends, by Region, 2024 - 2030

Asia Pacific is anticipated to witness fastest growth in the prosthetics and orthotics market. An increasing number of diabetes-related amputations, a rise in number of road accidents, growing funds, and supportive government initiatives drive the regional market growth. For instance, according to the Medical Technology Association of Australia, in the 2021-2022 Federal Budget, the Government has announced AUD 22 million (USD 14.52 million) to bring reforms to the Prostheses List. These reforms aim to gradually decrease the Prostheses List benefits in accordance with the public prices for prostheses. The reforms aimed to ensure that patients have the right to choose their clinician and have access to prosthetic devices. Moreover, according to a report published by the Asian Diabetes Prevention Initiative, 60.0% of the diabetic population lives in Asia, currently. By 2030, it is estimated that both India and China are expected to have around half a million people with diabetes. Thus, such factors are expected to propel the market during the forecast period.

Key Companies & Market Share Insights

Some of the key players operating in the market include Össur, Blatchford Limited, WillowWood Global LLC, and Ottobock. Bauerfeind, Aether Biomedical, and Ultraflex Systems Inc. are some of the emerging market participants in the market.

  • Össur is a provider of non-invasive orthopaedics equipment. The company has extensive operations across 36 countries in the Americas, Europe, and Asia, with numerous distributors.

  • Aether Biomedical develops cutting-edge prosthetic and rehabilitation devices. The company is expanding its business by launching Zeus into the U.S. market, with its U.S. headquarters in Chicago, Illinois.

  • Ultraflex Systems Inc. provides individualized orthopedic and neurological solutions for pediatrics adults and pediatrics. The company markets its products through qualified distributors in Canada, Europe, Australia, and Japan.

Key Prosthetics And Orthotics Companies:

  • Össur
  • Blatchford Limited
  • Fillauer LLC
  • Ottobock
  • WillowWood Global LLC.
  • Ultraflex Systems Inc.
  • Steeper Group
  • Bauerfeind
  • Aether Biomedical
  • Mobius Bionics

Recent Developments

  • In July 2023, WillowWood introduced the Fiberglass META Shock X, featuring the company’s META-Unibody platform and a build height of just under 5.5 inches, thus offering several fitting options for various limb lengths.

  • In June 2023, Fillauer launched the Myo/One Electrode system, designed in partnership with Coapt. It is a streamlined, waterproof solution with one preamplifier providing two EMG signal channels for myoelectric devices and replaces fabrication aids, sealing rings, cables, and other devices with a cable. The system has two connection options and is compatible with the majority of the dual-site myoelectric devices.

  • In May 2023, WillowWood announced the release of the Alpha Control Liner System, an innovative prosthetic liner with embedded electronics, in partnership with Coapt. The system is of advantage to people using a myoelectric prosthesis, as it enables a more consistent and comfortable electrode contact with the skin, leading to enhanced functional control. Coapt’s Complete Control system leverages machine learning to understand user intentions and control prosthesis actions.

  • In March 2023, Steeper Group announced that it had joined the Eqwal Group, with the latter acquiring 100% of the shares in Steeper Group. The Eqwal Group has its headquarters in Toulouse, France, and is a global patient care services provider in prosthetics and orthotics. Through this development, Steeper Group aims to strengthen its clinical offerings in the United Kingdom and deliver innovative products and services.

  • In January 2023, Steeper Group launched the LIMB-art Prosthetic Leg Covers for its lower limb portfolio, featuring unique designs and customizations to increase patient self-esteem and confidence. The covers are available in 4 models -Vent, Core, Wave, and Ultralight - and weigh less than 250 gm each. Moreover, they have been manufactured using high-grade Nylon, which imparts toughness and flexibility to the product.

Prosthetics And Orthotics Market Report Scope

Report Attribute

Details

Market size value in 2024

USD 7.21 billion

Revenue forecast in 2030

USD 9.31 billion

Growth rate

CAGR of 4.4% from 2024 to 2030

Actual data

2018 - 2023

Forecast data

2024 - 2030

Quantitative units

Revenue in USD million/ billion & CAGR from 2024 to 2030

Report coverage

Revenue forecast, company ranking, competitive landscape, growth factors, and trends

Segments covered

Product type, region

Regions covered

North America; Europe; Asia Pacific; Latin America; MEA

Country Scope

U.S.; Canada; U.K.; Germany; Italy; France; Spain; Denmark; Norway; Sweden; Japan; China; India; South Korea; Australia, Brazil; Mexico; Argentina; South Africa; Saudi Arabia; UAE; Kuwait

Key companies profiled

Össur; Blatchford Limited; Fillauer LLC; Ottobock; WillowWood Global LLC.; Ultraflex Systems Inc.; Steeper Group; Bauerfeind; Aether Biomedical; Mobius Bionics

Customization scope

Free report customization (equivalent up to 8 analysts’ working days) with purchase. Addition or alteration to country, regional & segment scope.

Pricing and purchase options

Avail customized purchase options to meet your exact research needs. Explore purchase options

 Global Prosthetics And Orthotics Market Report Segmentation

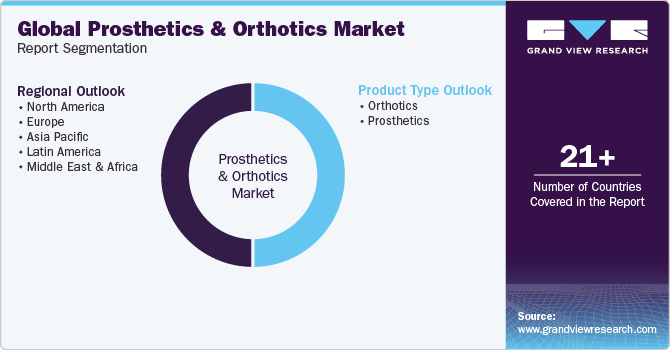
This report forecasts revenue growth at global, regional, and country levels and provides an analysis of the latest industry trends in each of the sub-segments from 2018 to 2030. For this study, Grand View Research has segmented the global prosthetics and orthotics market report based on product type, and region:

Global Prosthetics And Orthotics Market Report Segmentation

  • Product Type Outlook (Revenue, USD Billion, 2018 - 2030)

    • Orthotics

      • Upper limb

      • Lower limb

      • Spinal

    • Prosthetics

      • Upper Extremity

      • Lower Extremity

      • Liners

      • Sockets

      • Modular Components

  • Regional Outlook (Revenue, USD Billion, 2018 - 2030)

    • North America

      • U.S.

      • Canada

    • Europe

      • Germany

      • Italy

      • U.K.

      • France

      • Spain

      • Denmark

      • Norway

      • Sweden

    • Asia Pacific

      • China

      • Japan

      • India

      • South Korea

      • Australia

      • Thailand

    • Latin America

      • Brazil

      • Mexico

      • Argentina

    • Middle East and Africa (MEA)

      • UAE

      • South Africa

      • Saudi Arabia

      • Kuwait

Frequently Asked Questions About This Report

Table of Contents

Chapter 1. Prosthetics And Orthotics Market: Methodology and Scope
                   1.1. Market Segmentation & Scope
                   1.2. Segment Definitions
                       1.2.1. Product Type
                       1.2.2. Regional scope
                       1.2.3. Estimates and forecasts timeline
                   1.3. Research Methodology
                   1.4. Information Procurement
                       1.4.1. Purchased database
                       1.4.2. GVR’s internal database
                       1.4.3. Secondary sources
                       1.4.4. Primary research
                       1.4.5. Details of primary research
                   1.5. Information or Data Analysis
                       1.5.1. Data analysis models
                   1.6. Market Formulation & Validation
                   1.7. Model Details
                       1.7.1. Commodity flow analysis (Model 1)
                       1.7.2. Approach 1: Commodity flow approach
                       1.7.3. Volume price analysis (Model 2)
                       1.7.4. Approach 2: Volume price analysis
                   1.8. List of Secondary Sources
                   1.9. List of Primary Sources
                   1.10. Objectives
Chapter 2. Prosthetics And Orthotics Market: Executive Summary
                   2.1. Market Outlook
                   2.2. Segment Outlook
                       2.2.1. Product type outlook
                       2.2.2. Regional outlook
                   2.3. Competitive Insights
Chapter 3. Prosthetics and Orthotics Market: Variables, Trends & Scope
                   3.1. Market Lineage Outlook
                       3.1.1. Parent market outlook
                       3.1.2. Related/ancillary market outlook
                   3.2. Market Dynamics
                       3.2.1. Market driver analysis
                           3.2.1.1. Increasing incidence of sports injuries
                           3.2.1.2. Rising incidence of road accidents
                           3.2.1.3. Increasing prevalence of osteosarcoma
                           3.2.1.4. Rising geriatric population
                       3.2.2. Market restraint analysis
                           3.2.2.1. High cost of prosthetics
                           3.2.2.2. Lack of adequate healthcare infrastructure in less developed and developing countries
                   3.3. Prosthetics and Orthotics Market Analysis Tools
                       3.3.1. Industry Analysis - Porter’s
                           3.3.1.1. Supplier power
                           3.3.1.2. Buyer power
                           3.3.1.3. Substitution threat
                           3.3.1.4. Threat of new entrant
                           3.3.1.5. Competitive rivalry
                       3.3.2. PESTEL Analysis
                           3.3.2.1. Political landscape
                           3.3.2.2. Technological landscape
                           3.3.2.3. Economic landscape
Chapter 4. Prosthetics and Orthotics Market: Product Type Estimates & Trend Analysis
                   4.1. Product Type Market Share, 2023 & 2030
                   4.2. Segment Dashboard
                   4.3. Global Prosthetics and Orthotics Market by Product Type Outlook
                   4.4. Market Size & Forecasts and Trend Analyses, 2018 to 2030 for the following
                       4.4.1. Orthotics
                           4.4.1.1. Market estimates and forecasts 2018 to 2030 (USD Million)
                           4.4.1.2. Upper limb
                               4.4.1.2.1. Market estimates and forecasts 2018 to 2030 (USD Million)
                           4.4.1.3. Lower limb
                               4.4.1.3.1. Market estimates and forecasts 2018 to 2030 (USD Million)
                           4.4.1.4. Spinal
                               4.4.1.4.1. Market estimates and forecasts 2018 to 2030 (USD Million)
                       4.4.2. Prosthetics
                           4.4.2.1. Market estimates and forecasts 2018 to 2030 (USD Million)
                           4.4.2.2. Upper extremity
                               4.4.2.2.1. Market estimates and forecasts 2018 to 2030 (USD Million)
                           4.4.2.3. Lower extremity
                               4.4.2.3.1. Market estimates and forecasts 2018 to 2030 (USD Million)
                           4.4.2.4. Liners
                               4.4.2.4.1. Market estimates and forecasts 2018 to 2030 (USD Million)
                           4.4.2.5. Sockets
                               4.4.2.5.1. Market estimates and forecasts 2018 to 2030 (USD Million)
                           4.4.2.6. Modular components
                               4.4.2.6.1. Market estimates and forecasts 2018 to 2030 (USD Million)
Chapter 5. Prosthetics and Orthotics Market: Regional Estimates & Trend Analysis
                   5.1. Regional Market Share Analysis, 2023 & 2030
                   5.2. Regional Market Dashboard
                   5.3. Global Regional Market Snapshot
                   5.4. Market Size, & Forecasts Trend Analysis, 2018 to 2030
                   5.5. North America
                       5.5.1. U.S.
                           5.5.1.1. Key country dynamics
                           5.5.1.2. Regulatory framework/ reimbursement structure
                           5.5.1.3. Competitive scenario
                           5.5.1.4. U.S. market estimates and forecasts 2018 to 2030 (USD Million)
                       5.5.2. Canada
                           5.5.2.1. Key country dynamics
                           5.5.2.2. Regulatory framework/ reimbursement structure
                           5.5.2.3. Competitive scenario
                           5.5.2.4. Canada market estimates and forecasts 2018 to 2030 (USD Million)
                   5.6. Europe
                       5.6.1. UK
                           5.6.1.1. Key country dynamics
                           5.6.1.2. Regulatory framework/ reimbursement structure
                           5.6.1.3. Competitive scenario
                           5.6.1.4. UK market estimates and forecasts 2018 to 2030 (USD Million)
                       5.6.2. Germany
                           5.6.2.1. Key country dynamics
                           5.6.2.2. Regulatory framework/ reimbursement structure
                           5.6.2.3. Competitive scenario
                           5.6.2.4. Germany market estimates and forecasts 2018 to 2030 (USD Million)
                       5.6.3. France
                           5.6.3.1. Key country dynamics
                           5.6.3.2. Regulatory framework/ reimbursement structure
                           5.6.3.3. Competitive scenario
                           5.6.3.4. France market estimates and forecasts 2018 to 2030 (USD Million)
                       5.6.4. Italy
                           5.6.4.1. Key country dynamics
                           5.6.4.2. Regulatory framework/ reimbursement structure
                           5.6.4.3. Competitive scenario
                           5.6.4.4. Italy market estimates and forecasts 2018 to 2030 (USD Million)
                       5.6.5. Spain
                           5.6.5.1. Key country dynamics
                           5.6.5.2. Regulatory framework/ reimbursement structure
                           5.6.5.3. Competitive scenario
                           5.6.5.4. Spain market estimates and forecasts 2018 to 2030 (USD Million)
                       5.6.6. Norway
                           5.6.6.1. Key country dynamics
                           5.6.6.2. Regulatory framework/ reimbursement structure
                           5.6.6.3. Competitive scenario
                           5.6.6.4. Norway market estimates and forecasts 2018 to 2030 (USD Million)
                       5.6.7. Sweden
                           5.6.7.1. Key country dynamics
                           5.6.7.2. Regulatory framework/ reimbursement structure
                           5.6.7.3. Competitive scenario
                           5.6.7.4. Sweden market estimates and forecasts 2018 to 2030 (USD Million)
                       5.6.8. Denmark
                           5.6.8.1. Key country dynamics
                           5.6.8.2. Regulatory framework/ reimbursement structure
                           5.6.8.3. Competitive scenario
                           5.6.8.4. Denmark market estimates and forecasts 2018 to 2030 (USD Million)
                   5.7. Asia Pacific
                       5.7.1. Japan
                           5.7.1.1. Key country dynamics
                           5.7.1.2. Regulatory framework/ reimbursement structure
                           5.7.1.3. Competitive scenario
                           5.7.1.4. Japan market estimates and forecasts 2018 to 2030 (USD Million)
                       5.7.2. China
                           5.7.2.1. Key country dynamics
                           5.7.2.2. Regulatory framework/ reimbursement structure
                           5.7.2.3. Competitive scenario
                           5.7.2.4. China market estimates and forecasts 2018 to 2030 (USD Million)
                       5.7.3. India
                           5.7.3.1. Key country dynamics
                           5.7.3.2. Regulatory framework/ reimbursement structure
                           5.7.3.3. Competitive scenario
                           5.7.3.4. India market estimates and forecasts 2018 to 2030 (USD Million)
                       5.7.4. Australia
                           5.7.4.1. Key country dynamics
                           5.7.4.2. Regulatory framework/ reimbursement structure
                           5.7.4.3. Competitive scenario
                           5.7.4.4. Australia market estimates and forecasts 2018 to 2030 (USD Million)
                       5.7.5. South Korea
                           5.7.5.1. Key country dynamics
                           5.7.5.2. Regulatory framework/ reimbursement structure
                           5.7.5.3. Competitive scenario
                           5.7.5.4. South Korea market estimates and forecasts 2018 to 2030 (USD Million)
                       5.7.6. Thailand
                           5.7.6.1. Key country dynamics
                           5.7.6.2. Regulatory framework/ reimbursement structure
                           5.7.6.3. Competitive scenario
                           5.7.6.4. Thailand market estimates and forecasts 2018 to 2030 (USD Million)
                   5.8. Latin America
                       5.8.1. Brazil
                           5.8.1.1. Key country dynamics
                           5.8.1.2. Regulatory framework/ reimbursement structure
                           5.8.1.3. Competitive scenario
                           5.8.1.4. Brazil market estimates and forecasts 2018 to 2030 (USD Million)
                       5.8.2. Mexico
                           5.8.2.1. Key country dynamics
                           5.8.2.2. Regulatory framework/ reimbursement structure
                           5.8.2.3. Competitive scenario
                           5.8.2.4. Mexico market estimates and forecasts 2018 to 2030 (USD Million)
                       5.8.3. Argentina
                           5.8.3.1. Key country dynamics
                           5.8.3.2. Regulatory framework/ reimbursement structure
                           5.8.3.3. Competitive scenario
                           5.8.3.4. Argentina market estimates and forecasts 2018 to 2030 (USD Million)
                   5.9. MEA
                       5.9.1. South Africa
                           5.9.1.1. Key country dynamics
                           5.9.1.2. Regulatory framework/ reimbursement structure
                           5.9.1.3. Competitive scenario
                           5.9.1.4. South Africa market estimates and forecasts 2018 to 2030 (USD Million)
                       5.9.2. Saudi Arabia
                           5.9.2.1. Key country dynamics
                           5.9.2.2. Regulatory framework/ reimbursement structure
                           5.9.2.3. Competitive scenario
                           5.9.2.4. Saudi Arabia market estimates and forecasts 2018 to 2030 (USD Million)
                       5.9.3. UAE
                           5.9.3.1. Key country dynamics
                           5.9.3.2. Regulatory framework/ reimbursement structure
                           5.9.3.3. Competitive scenario
                           5.9.3.4. UAE market estimates and forecasts 2018 to 2030 (USD Million)
                       5.9.4. Kuwait
                           5.9.4.1. Key country dynamics
                           5.9.4.2. Regulatory framework/ reimbursement structure
                           5.9.4.3. Competitive scenario
                           5.9.4.4. Kuwait market estimates and forecasts 2018 to 2030 (USD Million)
Chapter 6. Competitive Landscape
                   6.1. Recent Developments & Impact Analysis, By Key Market Participants
                   6.2. Company/Competition Categorization
                   6.3. Vendor Landscape
                       6.3.1. List of key distributors and channel partners
                       6.3.2. Key customers
                       6.3.3. Key company market share analysis, 2023
                       6.3.4. Össur
                           6.3.4.1. Company overview
                           6.3.4.2. Financial performance
                           6.3.4.3. Product benchmarking
                           6.3.4.4. Strategic initiatives
                       6.3.5. Blatchford Limited
                           6.3.5.1. Company overview
                           6.3.5.2. Financial performance
                           6.3.5.3. Product benchmarking
                           6.3.5.4. Strategic initiatives
                       6.3.6. Fillauer LLC
                           6.3.6.1. Company overview
                           6.3.6.2. Financial performance
                           6.3.6.3. Product benchmarking
                           6.3.6.4. Strategic initiatives
                       6.3.7. Ottobock
                           6.3.7.1. Company overview
                           6.3.7.2. Financial performance
                           6.3.7.3. Product benchmarking
                           6.3.7.4. Strategic initiatives
                       6.3.8. WillowWood Global LLC.
                           6.3.8.1. Company overview
                           6.3.8.2. Financial performance
                           6.3.8.3. Product benchmarking
                           6.3.8.4. Strategic initiatives
                       6.3.9. Ultraflex Systems Inc.
                           6.3.9.1. Company overview
                           6.3.9.2. Financial performance
                           6.3.9.3. Product benchmarking
                           6.3.9.4. Strategic initiatives
                       6.3.10. Steeper Group
                           6.3.10.1. Company overview
                           6.3.10.2. Financial performance
                           6.3.10.3. Product benchmarking
                           6.3.10.4. Strategic initiatives
                       6.3.11. Bauerfeind
                           6.3.11.1. Company overview
                           6.3.11.2. Financial performance
                           6.3.11.3. Product benchmarking
                           6.3.11.4. Strategic initiatives
                       6.3.12. Aether Biomedical
                           6.3.12.1. Company overview
                           6.3.12.2. Financial performance
                           6.3.12.3. Product benchmarking
                           6.3.12.4. Strategic initiatives
                       6.3.13. Mobius Bionics
                           6.3.13.1. Company overview
                           6.3.13.2. Financial performance
                           6.3.13.3. Product benchmarking
                           6.3.13.4. Strategic initiatives


List of Tables

Table 1 List of abbreviation
Table 2 North America prosthetics and orthotics market, by region, 2018 - 2030 (USD Million)
Table 3 North America prosthetics and orthotics market, by product type, 2018 - 2030 (USD Million)
Table 4 U.S. prosthetics and orthotics market, by product type, 2018 - 2030 (USD Million)
Table 5 Canada prosthetics and orthotics market, by product type, 2018 - 2030 (USD Million)
Table 6 Europe prosthetics and orthotics market, by region, 2018 - 2030 (USD Million)
Table 7 Europe prosthetics and orthotics market, by product type, 2018 - 2030 (USD Million)
Table 8 Germany prosthetics and orthotics market, by product type, 2018 - 2030 (USD Million)
Table 9 UK prosthetics and orthotics market, by product type, 2018 - 2030 (USD Million)
Table 10 France prosthetics and orthotics market, by product type, 2018 - 2030 (USD Million)
Table 11 Italy prosthetics and orthotics market, by product type, 2018 - 2030 (USD Million)
Table 12 Spain prosthetics and orthotics market, by product type, 2018 - 2030 (USD Million)
Table 13 Denmark prosthetics and orthotics market, by product type, 2018 - 2030 (USD Million)
Table 14 Sweden prosthetics and orthotics market, by product type, 2018 - 2030 (USD Million)
Table 15 Norway prosthetics and orthotics market, by product type, 2018 - 2030 (USD Million)
Table 16 Asia Pacific prosthetics and orthotics market, by region, 2018 - 2030 (USD Million)
Table 17 Asia Pacific prosthetics and orthotics market, by product type, 2018 - 2030 (USD Million)
Table 18 China prosthetics and orthotics market, by product type, 2018 - 2030 (USD Million)
Table 19 Japan prosthetics and orthotics market, by product type, 2018 - 2030 (USD Million)
Table 20 India prosthetics and orthotics market, by product type, 2018 - 2030 (USD Million)
Table 21 South Korea prosthetics and orthotics market, by product type, 2018 - 2030 (USD Million)
Table 22 Australia prosthetics and orthotics market, by product type, 2018 - 2030 (USD Million)
Table 23 Thailand prosthetics and orthotics market, by product type, 2018 - 2030 (USD Million)
Table 24 Latin America prosthetics and orthotics market, by region, 2018 - 2030 (USD Million)
Table 25 Latin America prosthetics and orthotics market, by product type, 2018 - 2030 (USD Million)
Table 26 Brazil prosthetics and orthotics market, by product type, 2018 - 2030 (USD Million)
Table 27 Mexico prosthetics and orthotics market, by product type, 2018 - 2030 (USD Million)
Table 28 Argentina prosthetics and orthotics market, by product type, 2018 - 2030 (USD Million)
Table 29 MEA prosthetics and orthotics market, by region, 2018 - 2030 (USD Million)
Table 30 MEA prosthetics and orthotics market, by product type, 2018 - 2030 (USD Million)
Table 31 South Africa prosthetics and orthotics market, by product type, 2018 - 2030 (USD Million)
Table 32 Saudi Arabia prosthetics and orthotics market, by product type, 2018 - 2030 (USD Million)
Table 33 UAE prosthetics and orthotics market, by product type, 2018 - 2030 (USD Million)
Table 34 Kuwait prosthetics and orthotics market, by product type, 2018 - 2030 (USD Million)


List of Figures

Fig. 1 Market research process
Fig. 2 Data triangulation techniques
Fig. 3 Primary research pattern
Fig. 4 Primary interviews in North America
Fig. 5 Primary interviews in Europe
Fig. 6 Primary interviews in APAC
Fig. 7 Primary interviews in Latin America
Fig. 8 Primary interviews in MEA
Fig. 9 Market research approaches
Fig. 10 Value-chain-based sizing & forecasting
Fig. 11 QFD modeling for market share assessment
Fig. 12 Market formulation & validation
Fig. 13 Prosthetics and orthotics market: market outlook
Fig. 14 Prosthetics and orthotics competitive insights
Fig. 15 Parent market outlook
Fig. 16 Related/ancillary market outlook
Fig. 17 Penetration and growth prospect mapping
Fig. 18 Industry value chain analysis
Fig. 19 Prosthetics and orthotics market driver impact
Fig. 20 Prosthetics and orthotics market restraint impact
Fig. 21 Prosthetics and orthotics market strategic initiatives analysis
Fig. 22 Prosthetics and orthotics market: Product Type movement analysis
Fig. 23 Prosthetics and orthotics market: Product Type outlook and key takeaways
Fig. 24 Orthotics market estimates and forecast, 2018 - 2030
Fig. 25 Upper limb market estimates and forecast, 2018 - 2030
Fig. 26 Lower limb market estimates and forecast, 2018 - 2030
Fig. 27 Spinal market estimates and forecast, 2018 - 2030
Fig. 28 Prosthetics market estimates and forecast, 2018 - 2030
Fig. 29 Upper extremity market estimates and forecast, 2018 - 2030
Fig. 30 Lower extremity market estimates and forecast, 2018 - 2030
Fig. 31 Liners market estimates and forecast, 2018 - 2030
Fig. 32 Sockets market estimates and forecast, 2018 - 2030
Fig. 33 Modular components market estimates and forecast, 2018 - 2030
Fig. 34 Global Prosthetics and orthotics market: Regional movement analysis
Fig. 35 Global Prosthetics and orthotics market: Regional outlook and key takeaways
Fig. 36 Global Prosthetics and orthotics market share and leading players
Fig. 37 North America market share and leading players
Fig. 38 Europe market share and leading players
Fig. 39 Asia Pacific market share and leading players
Fig. 40 Latin America market share and leading players
Fig. 41 Middle East & Africa market share and leading players
Fig. 42 North America: SWOT
Fig. 43 Europe SWOT
Fig. 44 Asia Pacific SWOT
Fig. 45 Latin America SWOT
Fig. 46 MEA SWOT
Fig. 47 North America, by country
Fig. 48 North America
Fig. 49 North America market estimates and forecasts, 2018 - 2030
Fig. 50 U.S.
Fig. 51 U.S. market estimates and forecasts, 2018 - 2030
Fig. 52 Canada
Fig. 53 Canada market estimates and forecasts, 2018 - 2030
Fig. 54 Europe
Fig. 55 Europe market estimates and forecasts, 2018 - 2030
Fig. 56 UK
Fig. 57 UK market estimates and forecasts, 2018 - 2030
Fig. 58 Germany
Fig. 59 Germany market estimates and forecasts, 2018 - 2030
Fig. 60 France
Fig. 61 France market estimates and forecasts, 2018 - 2030
Fig. 62 Italy
Fig. 63 Italy market estimates and forecasts, 2018 - 2030
Fig. 64 Spain
Fig. 65 Spain market estimates and forecasts, 2018 - 2030
Fig. 66 Denmark
Fig. 67 Denmark market estimates and forecasts, 2018 - 2030
Fig. 68 Sweden
Fig. 69 Sweden market estimates and forecasts, 2018 - 2030
Fig. 70 Norway
Fig. 71 Norway market estimates and forecasts, 2018 - 2030
Fig. 72 Asia Pacific
Fig. 73 Asia Pacific market estimates and forecasts, 2018 - 2030
Fig. 74 China
Fig. 75 China market estimates and forecasts, 2018 - 2030
Fig. 76 Japan
Fig. 77 Japan market estimates and forecasts, 2018 - 2030
Fig. 78 India
Fig. 79 India market estimates and forecasts, 2018 - 2030
Fig. 80 Thailand
Fig. 81 Thailand market estimates and forecasts, 2018 - 2030
Fig. 82 South Korea
Fig. 83 South Korea market estimates and forecasts, 2018 - 2030
Fig. 84 Australia
Fig. 85 Australia market estimates and forecasts, 2018 - 2030
Fig. 86 Latin America
Fig. 87 Latin America market estimates and forecasts, 2018 - 2030
Fig. 88 Brazil
Fig. 89 Brazil market estimates and forecasts, 2018 - 2030
Fig. 90 Mexico
Fig. 91 Mexico market estimates and forecasts, 2018 - 2030
Fig. 92 Argentina
Fig. 93 Argentina market estimates and forecasts, 2018 - 2030
Fig. 94 Middle East and Africa
Fig. 95 Middle East and Africa market estimates and forecasts, 2018 - 2030
Fig. 96 South Africa
Fig. 97 South Africa market estimates and forecasts, 2018 - 2030
Fig. 98 Saudi Arabia
Fig. 99 Saudi Arabia market estimates and forecasts, 2018 - 2030
Fig. 100 UAE
Fig. 101 UAE market estimates and forecasts, 2018 - 2030
Fig. 102 Kuwait
Fig. 103 Kuwait market estimates and forecasts, 2018 - 2030
Fig. 104 Market share of key market players- Prosthetics and orthotics market

What questions do you have? Get quick response from our industry experts. Request a Free Consultation

Market Segmentation

  • Prosthetics and Orthotics Product Type Outlook (Revenue, USD Billion, 2018 - 2030)
    • Orthotics
      • Upper limb
      • Lower limb
      • Spinal
    • Prosthetics
      • Upper Extremity
      • Lower Extremity
      • Liners
      • Sockets
      • Modular Components
  • Prosthetics and Orthotics Regional Outlook (Revenue, USD Billion, 2018 - 2030)
    • North America
      • North America Prosthetics and Orthotics Market, By Product Type
        • Orthotics
          • Upper limb
          • Lower limb
          • Spinal
        • Prosthetics
          • Upper Extremity
          • Lower Extremity
          • Liners
          • Sockets
          • Modular Components
      • U.S.
        • U.S. Prosthetics and Orthotics Market, By Product Type
          • Orthotics
            • Upper limb
            • Lower limb
            • Spinal
          • Prosthetics
            • Upper Extremity
            • Lower Extremity
            • Liners
            • Sockets
            • Modular Components
      • Canada
        • Canada Prosthetics and Orthotics Market, By Product Type
          • Orthotics
            • Upper limb
            • Lower limb
            • Spinal
          • Prosthetics
            • Upper Extremity
            • Lower Extremity
            • Liners
            • Sockets
            • Modular Components
    • Europe
      • Europe Prosthetics and Orthotics Market, By Product Type
        • Orthotics
          • Upper limb
          • Lower limb
          • Spinal
        • Prosthetics
          • Upper Extremity
          • Lower Extremity
          • Liners
          • Sockets
          • Modular Components
      • UK
        • UK Prosthetics and Orthotics Market, By Product Type
          • Orthotics
            • Upper limb
            • Lower limb
            • Spinal
          • Prosthetics
            • Upper Extremity
            • Lower Extremity
            • Liners
            • Sockets
            • Modular Components
      • Germany
        • Germany Prosthetics and Orthotics Market, By Product Type
          • Orthotics
            • Upper limb
            • Lower limb
            • Spinal
          • Prosthetics
            • Upper Extremity
            • Lower Extremity
            • Liners
            • Sockets
            • Modular Components
      • France
        • France Prosthetics and Orthotics Market, By Product Type
          • Orthotics
            • Upper limb
            • Lower limb
            • Spinal
          • Prosthetics
            • Upper Extremity
            • Lower Extremity
            • Liners
            • Sockets
            • Modular Components
      • Italy
        • Italy Prosthetics and Orthotics Market, By Product Type
          • Orthotics
            • Upper limb
            • Lower limb
            • Spinal
          • Prosthetics
            • Upper Extremity
            • Lower Extremity
            • Liners
            • Sockets
            • Modular Components
      • Spain
        • Spain Prosthetics and Orthotics Market, By Product Type
          • Orthotics
            • Upper limb
            • Lower limb
            • Spinal
          • Prosthetics
            • Upper Extremity
            • Lower Extremity
            • Liners
            • Sockets
            • Modular Components
      • Denmark
        • Denmark Prosthetics and Orthotics Market, By Product Type
          • Orthotics
            • Upper limb
            • Lower limb
            • Spinal
          • Prosthetics
            • Upper Extremity
            • Lower Extremity
            • Liners
            • Sockets
            • Modular Components
      • Norway
        • Norway Prosthetics and Orthotics Market, By Product Type
          • Orthotics
            • Upper limb
            • Lower limb
            • Spinal
          • Prosthetics
            • Upper Extremity
            • Lower Extremity
            • Liners
            • Sockets
            • Modular Components
      • Sweden
        • Sweden Prosthetics and Orthotics Market, By Product Type
          • Orthotics
            • Upper limb
            • Lower limb
            • Spinal
          • Prosthetics
            • Upper Extremity
            • Lower Extremity
            • Liners
            • Sockets
            • Modular Components
    • Asia Pacific
      • Asia Pacific Prosthetics and Orthotics Market, By Product Type
        • Orthotics
          • Upper limb
          • Lower limb
          • Spinal
        • Prosthetics
          • Upper Extremity
          • Lower Extremity
          • Liners
          • Sockets
          • Modular Components
      • China
        • China Prosthetics and Orthotics Market, By Product Type
          • Orthotics
            • Upper limb
            • Lower limb
            • Spinal
          • Prosthetics
            • Upper Extremity
            • Lower Extremity
            • Liners
            • Sockets
            • Modular Components
      • India
        • India Prosthetics and Orthotics Market, By Product Type
          • Orthotics
            • Upper limb
            • Lower limb
            • Spinal
          • Prosthetics
            • Upper Extremity
            • Lower Extremity
            • Liners
            • Sockets
            • Modular Components
      • Japan
        • Japan Prosthetics and Orthotics Market, By Product Type
          • Orthotics
            • Upper limb
            • Lower limb
            • Spinal
          • Prosthetics
            • Upper Extremity
            • Lower Extremity
            • Liners
            • Sockets
            • Modular Components
      • South Korea
        • South Korea Prosthetics and Orthotics Market, By Product Type
          • Orthotics
            • Upper limb
            • Lower limb
            • Spinal
          • Prosthetics
            • Upper Extremity
            • Lower Extremity
            • Liners
            • Sockets
            • Modular Components
      • Australia
        • Australia Prosthetics and Orthotics Market, By Product Type
          • Orthotics
            • Upper limb
            • Lower limb
            • Spinal
          • Prosthetics
            • Upper Extremity
            • Lower Extremity
            • Liners
            • Sockets
            • Modular Components
      • Thailand
        • Thailand Prosthetics and Orthotics Market, By Product Type
          • Orthotics
            • Upper limb
            • Lower limb
            • Spinal
          • Prosthetics
            • Upper Extremity
            • Lower Extremity
            • Liners
            • Sockets
            • Modular Components
    • Latin America
      • Latin America Prosthetics and Orthotics Market, By Product Type
        • Orthotics
          • Upper limb
          • Lower limb
          • Spinal
        • Prosthetics
          • Upper Extremity
          • Lower Extremity
          • Liners
          • Sockets
          • Modular Components
      • Brazil
        • Brazil Prosthetics and Orthotics Market, By Product Type
          • Orthotics
            • Upper limb
            • Lower limb
            • Spinal
          • Prosthetics
            • Upper Extremity
            • Lower Extremity
            • Liners
            • Sockets
            • Modular Components
      • Mexico
        • Mexico Prosthetics and Orthotics Market, By Product Type
          • Orthotics
            • Upper limb
            • Lower limb
            • Spinal
          • Prosthetics
            • Upper Extremity
            • Lower Extremity
            • Liners
            • Sockets
            • Modular Components
      • Argentina
        • Argentina Prosthetics and Orthotics Market, By Product Type
          • Orthotics
            • Upper limb
            • Lower limb
            • Spinal
          • Prosthetics
            • Upper Extremity
            • Lower Extremity
            • Liners
            • Sockets
            • Modular Components
    • MEA
      • MEA Prosthetics and Orthotics Market, By Product Type
        • Orthotics
          • Upper limb
          • Lower limb
          • Spinal
        • Prosthetics
          • Upper Extremity
          • Lower Extremity
          • Liners
          • Sockets
          • Modular Components
      • Saudi Arabia
        • Saudi Arabia Prosthetics and Orthotics Market, By Product Type
          • Orthotics
            • Upper limb
            • Lower limb
            • Spinal
          • Prosthetics
            • Upper Extremity
            • Lower Extremity
            • Liners
            • Sockets
            • Modular Components
      • UAE
        • UAE Prosthetics and Orthotics Market, By Product Type
          • Orthotics
            • Upper limb
            • Lower limb
            • Spinal
          • Prosthetics
            • Upper Extremity
            • Lower Extremity
            • Liners
            • Sockets
            • Modular Components
      • South Africa
        • Argentina Prosthetics and Orthotics Market, By Product Type
          • Orthotics
            • Upper limb
            • Lower limb
            • Spinal
          • Prosthetics
            • Upper Extremity
            • Lower Extremity
            • Liners
            • Sockets
            • Modular Components
      • Kuwait
        • Kuwait Prosthetics and Orthotics Market, By Product Type
          • Orthotics
            • Upper limb
            • Lower limb
            • Spinal
          • Prosthetics
            • Upper Extremity
            • Lower Extremity
            • Liners
            • Sockets
            • Modular Components

Prosthetics And Orthotics Market Dynamics

Driver: Increasing Prevalence of Arthritis

An increasing incidence of osteoarthritis is one of the key growth drivers of the market. It is the most common form of arthritis and affects people of all ages. According to the Arthritis Foundation, an anticipated 78 million people aged 18 years or above in the U.S. will be diagnosed with arthritis by 2040. Patients suffering from arthritis are the primary target population for orthopedic braces. Hence, the increasing prevalence of this disease is expected to boost the demand for these devices. Rheumatoid arthritis is another common form that affects the joints of the body and can cause muscle pain. According to RheumatoidArthritis.org, in 2016, around 1.3 million of the U.S. population and 1% of the global population were suffering from rheumatoid arthritis. The American Academy of Orthopedic Surgeons estimated that 90% of patients suffering from rheumatoid arthritis tend to develop some kind of symptoms in their feet and ankles. Thus, increasing the incidence of these chronic diseases can increase the demand for orthoses and propel market growth.

Driver: Increasing Incidence of Diabetes & Obesity

There is an overall increase in the prevalence of chronic disorders that are known to cause osteoarthritis. Throughout the globe, it is estimated that every 30 seconds one leg is amputated owing to diabetes. According to the CDC, 27.7% of adults who have arthritis are also obese. 33.7% of arthritic adults are also diabetic. According to the American Diabetes Association, there was a 62% increase in minor non-traumatic lower-extremity amputations (NLEA) and a 29% increase in major NLEAs, between 2009 and 2015. According to the American Journal of Managed Care (AJMC), around 82,000 diabetic amputations were performed in California between 2011 and 2017. According to the CDC, in 2017, around 85% of amputations performed on diabetic patients were due to foot ulcers. In addition, diabetes increases the chances of Peripheral Artery Disease (PAD), which is another major cause of amputation.

Restraint: High Cost of Prosthetics

The high cost of prosthetics is one of the major factors limiting the market growth. For instance, the price of a prosthetic leg can range from USD 5,000 to USD 50,000 and even the most expensive prosthetics can withstand only 3 to 5 years of wear & tear before they have to be replaced. Similarly, the cost of upper extremity devices can range from USD 3,000 to USD 30,000 and these devices also have to be replaced after a certain period. The high cost of prosthetics may impede product sales, especially in developing economies, where the overall purchasing power of consumers is low.

What Does This Report Include?

This section will provide insights into the contents included in this prosthetics and orthotics market report and help gain clarity on the structure of the report to assist readers in navigating smoothly.

Prosthetics and orthotics market qualitative analysis

  • Industry overview

  • Industry trends

  • Market drivers and restraints

  • Market size

  • Growth prospects

  • Porter’s analysis

  • PESTEL analysis

  • Key market opportunities prioritized

  • Competitive landscape

    • Company overview

    • Financial performance

    • Product benchmarking

    • Latest strategic developments

Prosthetics and orthotics market quantitative analysis

  • Market size, estimates, and forecast from 2018 to 2030

  • Market estimates and forecast for product segments up to 2030

  • Regional market size and forecast for product segments up to 2030

  • Market estimates and forecast for application segments up to 2030

  • Regional market size and forecast for application segments up to 2030

  • Company financial performance

What questions do you have? Get quick response from our industry experts. Request a Free Consultation

Research Methodology

A three-pronged approach was followed for deducing the prosthetics and orthotics market estimates and forecasts. The process has three steps: information procurement, analysis, and validation. The whole process is cyclical, and steps repeat until the estimates are validated. The three steps are explained in detail below:

Information procurement: Information procurement is one of the most extensive and important stages in our research process, and quality data is critical for accurate analysis. We followed a multi-channel data collection process for prosthetics and orthotics market to gather the most reliable and current information possible.

  • We buy access to paid databases such as Hoover’s and Factiva for company financials, industry information, white papers, industry journals, SME journals, and more.
  • We tap into Grand View’s proprietary database of data points and insights from active and archived monitoring and reporting.
  • We conduct primary research with industry experts through questionnaires and one-on-one phone interviews.
  • We pull from reliable secondary sources such as white papers and government statistics, published by organizations like WHO, NGOs, World Bank, etc., Key Opinion Leaders (KoL) publications, company filings, investor documents, and more.
  • We purchase and review investor analyst reports, broker reports, academic commentary, government quotes, and wealth management publications for insightful third-party perspectives.

Analysis: We mine the data collected to establish baselines for forecasting, identify trends and opportunities, gain insight into consumer demographics and drivers, and so much more. We utilized different methods of prosthetics and orthotics market data depending on the type of information we’re trying to uncover in our research.

  • Market Research Efforts: Bottom-up Approach for estimating and forecasting demand size and opportunity, top-down Approach for new product forecasting and penetration, and combined approach of both Bottom-up and Top-down for full coverage analysis.

  • Value-Chain-Based Sizing & Forecasting: Supply-side estimates for understanding potential revenue through competitive benchmarking, forecasting, and penetration modeling.

  • Demand-side estimates for identifying parent and ancillary markets, segment modeling, and heuristic forecasting.

  • Qualitative Functional Deployment (QFD) Modelling for market share assessment.

Market formulation and validation: We mine the data collected to establish baselines for forecasting, identify trends and opportunities, gain insight into consumer demographics and drivers, and so much more. We utilize different methods of data analysis depending on the type of information we’re trying to uncover in our research.

  • Market Formulation: This step involves the finalization of market numbers. This step on an internal level is designed to manage outputs from the Data Analysis step.

  • Data Normalization: The final market estimates and forecasts are then aligned and sent to industry experts, in-panel quality control managers for validation.

  • This step also entails the finalization of the report scope and data representation pattern.

  • Validation: The process entails multiple levels of validation. All these steps run in parallel, and the study is forwarded for publishing only if all three levels render validated results.

Prosthetics And Orthotics Market Categorization:

The prosthetics and orthotics market was categorized into two segments, namely product type (Orthotics, Prosthetics), and regions (North America, Europe, Asia Pacific, Latin America, Middle East & Africa).

Segment Market Methodology:

The prosthetics and orthotics market was segmented into Product type, and regions. The demand at a segment level was deduced using a funnel method. Concepts like the TAM, SAM, SOM, etc., were put into practice to understand the demand. We at GVR deploy three methods to deduce market estimates and determine forecasts. These methods are explained below:

Market research approaches: Bottom-up

  • Demand estimation of each product across countries/regions summed up to from the total market.

  • Variable analysis for demand forecast.

  • Demand estimation via analyzing paid database, and company financials either via annual reports or paid database.

  • Primary interviews for data revalidation and insight collection.

Market research approaches: Top-down

  • Used extensively for new product forecasting or analyzing penetration levels.

  • Tool used invoice product flow and penetration models Use of regression multi-variant analysis for forecasting Involves extensive use of paid and public databases.

  • Primary interviews and vendor-based primary research for variable impact analysis.

Market research approaches: Combined

  • This is the most common method. We apply concepts from both the top-down and bottom-up approaches to arrive at a viable conclusion.

Regional Market Methodology:

The prosthetics and orthotics market was analyzed at a regional level. The globe was divided into North America, Europe, Asia Pacific, Latin America, and Middle East & Africa, keeping in focus variables like consumption patterns, export-import regulations, consumer expectations, etc. These regions were further divided into twenty-two countries, namely, the U.S.; Canada; the UK.; Germany; Italy; France; Spain; Denmark; Norway; Sweden; Japan; China; India; South Korea; Australia, Brazil; Mexico; Argentina; South Africa; Saudi Arabia; UAE; Kuwait.

All three above-mentioned market research methodologies were applied to arrive at regional-level conclusions. The regions were then summed up to form the global market.

Prosthetics and orthotics market companies & financials:

The prosthetics and orthotics market was analyzed via companies operating in the sector. Analyzing these companies and cross-referencing them to the demand equation helped us validate our assumptions and conclusions. Key market players analyzed include:

  • Össur, Össur is one of the global leaders in non-invasive orthopedics. The company manufactures, markets, and distributes prosthetic products. The company has a wide product portfolio in artificial limbs. It also provides customized products as per the needs of customers. It operates in various business segments, including prosthetics, osteoarthritis, and injury solutions. The company is present in more than 25 countries across the Americas, Europe, and Asia.

  • Steeper Group, Steeper is a leading worldwide manufacturer of upper extremity prosthetic products. Steeper Group’s mission is to generate turning points that empower customers, patients, and people, globally. Through 2020, the company strengthened its partnership with world-class manufacturers to continue to deliver leading-edge products, while continuing its orthotics and prosthetics manufacturing. The company’s purpose is to form and permit turning points in people’s lives, whether they are a clinician or a patient.

  • Blatchford, Inc., Blatchford manufactures and commercializes orthopedic products and services designed for providing mobility, function, & cosmetics after amputation. The company provides highly specialized treatment and rehabilitation in markets such as Norway, the UK, Russia, the Middle East, and India.

  • Fillauer LLC, Fillauer LLC is a subsidiary of Fillauer Companies, Inc. It designs, manufactures, and commercializes orthotic & prosthetic products for pediatrics and adults. It manufactures more than 3,200 prosthetic and orthotic products globally.

  • Ottobock, Ottobock, a medical technology organization, operates in orthotics, prosthetics, medical care, and mobility solutions. The company operates as a subsidiary of Ottobock Holding GmbH & Co. KG. It has a network of sales and service companies in over 50 countries and a medical care department with over 130 fitting centers worldwide.

  • WillowWood Global LLC, The WillowWood Global LLC designs, manufactures, and commercializes lower limb prosthetic components for amputees. The company also develops CAD equipment and software for the prosthetic and orthotic community. It offers products such as transtibial, custom & upper extremity liners, suction sleeves, and suspension aids.

  • Ultraflex Systems, Ultraflex Systems manufactures and provides neurological & orthopedic bracing solutions for pediatrics and adults. It offers products through resellers and distributors in the U.S., Latin American countries, and Canada.

Value chain-based sizing & forecasting

Supply Side Estimates

  • Company revenue estimation via referring to annual reports, investor presentations, and Hoover’s.

  • Segment revenue determination via variable analysis and penetration modeling.

  • Competitive benchmarking to identify market leaders and their collective revenue shares.

  • Forecasting via analyzing commercialization rates, pipelines, market initiatives, distribution networks, etc.

Demand side estimates

  • Identifying parent markets and ancillary markets

  • Segment penetration analysis to obtain pertinent

  • revenue/volume

  • Heuristic forecasting with the help of subject matter experts

  • Forecasting via variable analysis

Prosthetics And Orthotics Market Report Objectives:

  • Understanding market dynamics (in terms of drivers, restraints, & opportunities) in the countries.

  • Understanding trends & variables in the individual countries & their impact on growth and using analytical tools to provide high-level insights into the market dynamics and the associated growth pattern.

  • Understanding market estimates and forecasts (with the base year as 2023, historic information from 2018 to 2023, and forecast from 2024 to 2030). Regional estimates & forecasts for each category are available and are summed up to form the global market estimates.

Prosthetics And Orthotics Market Report Assumptions:

  • The report provides market value for the base year 2023 and a yearly forecast till 2030 in terms of revenue/volume or both. The market for each of the segment outlooks has been provided on region & country basis for the above-mentioned forecast period.

  • The key industry dynamics, major technological trends, and application markets are evaluated to understand their impact on the demand for the forecast period. The growth rates were estimated using correlation, regression, and time-series analysis.

  • We have used the bottom-up approach for market sizing, analyzing key regional markets, dynamics, & trends for various products and end-users. The total market has been estimated by integrating the country markets.

  • All market estimates and forecasts have been validated through primary interviews with the key industry participants.

  • Inflation has not been accounted for to estimate and forecast the market.

  • Numbers may not add up due to rounding off.

  • Europe consists of EU-8, Central & Eastern Europe, along with the Commonwealth of Independent States (CIS).

  • Asia Pacific includes South Asia, East Asia, Southeast Asia, and Oceania (Australia & New Zealand).

  • Latin America includes Central American countries and the South American continent

  • Middle East includes Western Asia (as assigned by the UN Statistics Division) and the African continent.

Primary Research

GVR strives to procure the latest and unique information for reports directly from industry experts, which gives it a competitive edge. Quality is of utmost importance to us, therefore every year we focus on increasing our experts’ panel. Primary interviews are one of the critical steps in identifying recent market trends and scenarios. This process enables us to justify and validate our market estimates and forecasts to our clients. With more than 8,000 reports in our database, we have connected with some key opinion leaders across various domains, including healthcare, technology, consumer goods, and the chemical sector. Our process starts with identifying the right platform for a particular type of report, i.e., emails, LinkedIn, seminars, or telephonic conversation, as every report is unique and requires a differentiated approach.

We send out questionnaires to different experts from various regions/ countries, which is dependent on the following factors:

  • Report/Market scope: If the market study is global, we send questionnaires to industry experts across various regions, including North America, Europe, Asia Pacific, Latin America, and MEA.

  • Market Penetration: If the market is driven by technological advancements, population density, disease prevalence, or other factors, we identify experts and send out questionnaires based on region or country dominance.

The time to start receiving responses from industry experts varies based on how niche or well-penetrated the market is. Our reports include a detailed chapter on the KoL opinion section, which helps our clients understand the perspective of experts already in the market space.

What questions do you have? Get quick response from our industry experts. Request a Free Consultation
gvr icn

GET A FREE SAMPLE

gvr icn

This FREE sample includes data points, ranging from trend analyses to estimates and forecasts. See for yourself.

gvr icn

NEED A CUSTOM REPORT?

We can customize every report - free of charge - including purchasing stand-alone sections or country-level reports, as well as offer affordable discounts for start-ups & universities. Contact us now

Certified Icon

We are GDPR and CCPA compliant! Your transaction & personal information is safe and secure. For more details, please read our privacy policy.