
- Home
- »
- Consumer F&B
- »
-
U.S. Frozen Fish Market Size & Share Report, 2026-2033GVR Report cover

U.S. Frozen Fish Market (2026 - 2033)
Size, Share & Trends Analysis Report By Fish Type (Salmon, Tuna, Cod), By Distribution Channel (Supermarkets & Hypermarkets, Convenience Stores, Specialty Seafood Retailers), And Segment Forecasts
Market Size, 2025
$17.3BMarket Estimate, 2026
$17.7BMarket Forecast, 2033
$21.6BCAGR, 2026–2033
2.8%U.S. Frozen Fish Market Summary
The U.S. frozen fish market size was valued at USD 17.3 billion in 2025 and is projected to grow from USD 17.7 billion in 2026 to USD 21.6 billion by 2033 at a CAGR of 2.8% from 2026 to 2033. The U.S. frozen fish industry is primarily driven by increasing consumer demand for convenient, affordable, and protein-rich seafood. Growing awareness of the nutritional benefits of fish, combined with the longer shelf life of frozen products, is supporting market growth.
Key Market Trends & Insights
- By fish type, the frozen salmon market held the largest share of 32.2% in 2025.
- By fish type, the frozen tuna market is projected to grow at a CAGR of 2.9% during the forecast period.
- By distribution channel, the supermarkets & hypermarkets channel held the largest share of 55.8% in 2025.
Market Trends & Insights
- Market Size in 2025: USD 17.7 Billion
- Estimated Market Size in 2026: USD 17.7 Billion
- Projected Market Size by 2033: USD 21.6 Billion
- CAGR (2026-2033): 2.8%
Prism AI by Grand View Research Free to tryAsk a question about the U.S. frozen fish marketTry asking✓Every figure cited from GVR research Prefer the report? Download free sample →Additionally, the expansion of retail stores, supermarkets, and online grocery platforms is increasing the availability and accessibility of frozen fish products across the country. According to data published in July 2025, U.S. consumers increasingly turned to online grocery shopping, with many using the recent Amazon Prime Day event to purchase seafood alongside other grocery products. Moreover, U.S. online grocery sales increased 27.6% year over year, while ship-to-home delivery rose 33% and pickup sales increased nearly 25%, further expanding consumer access to seafood products.
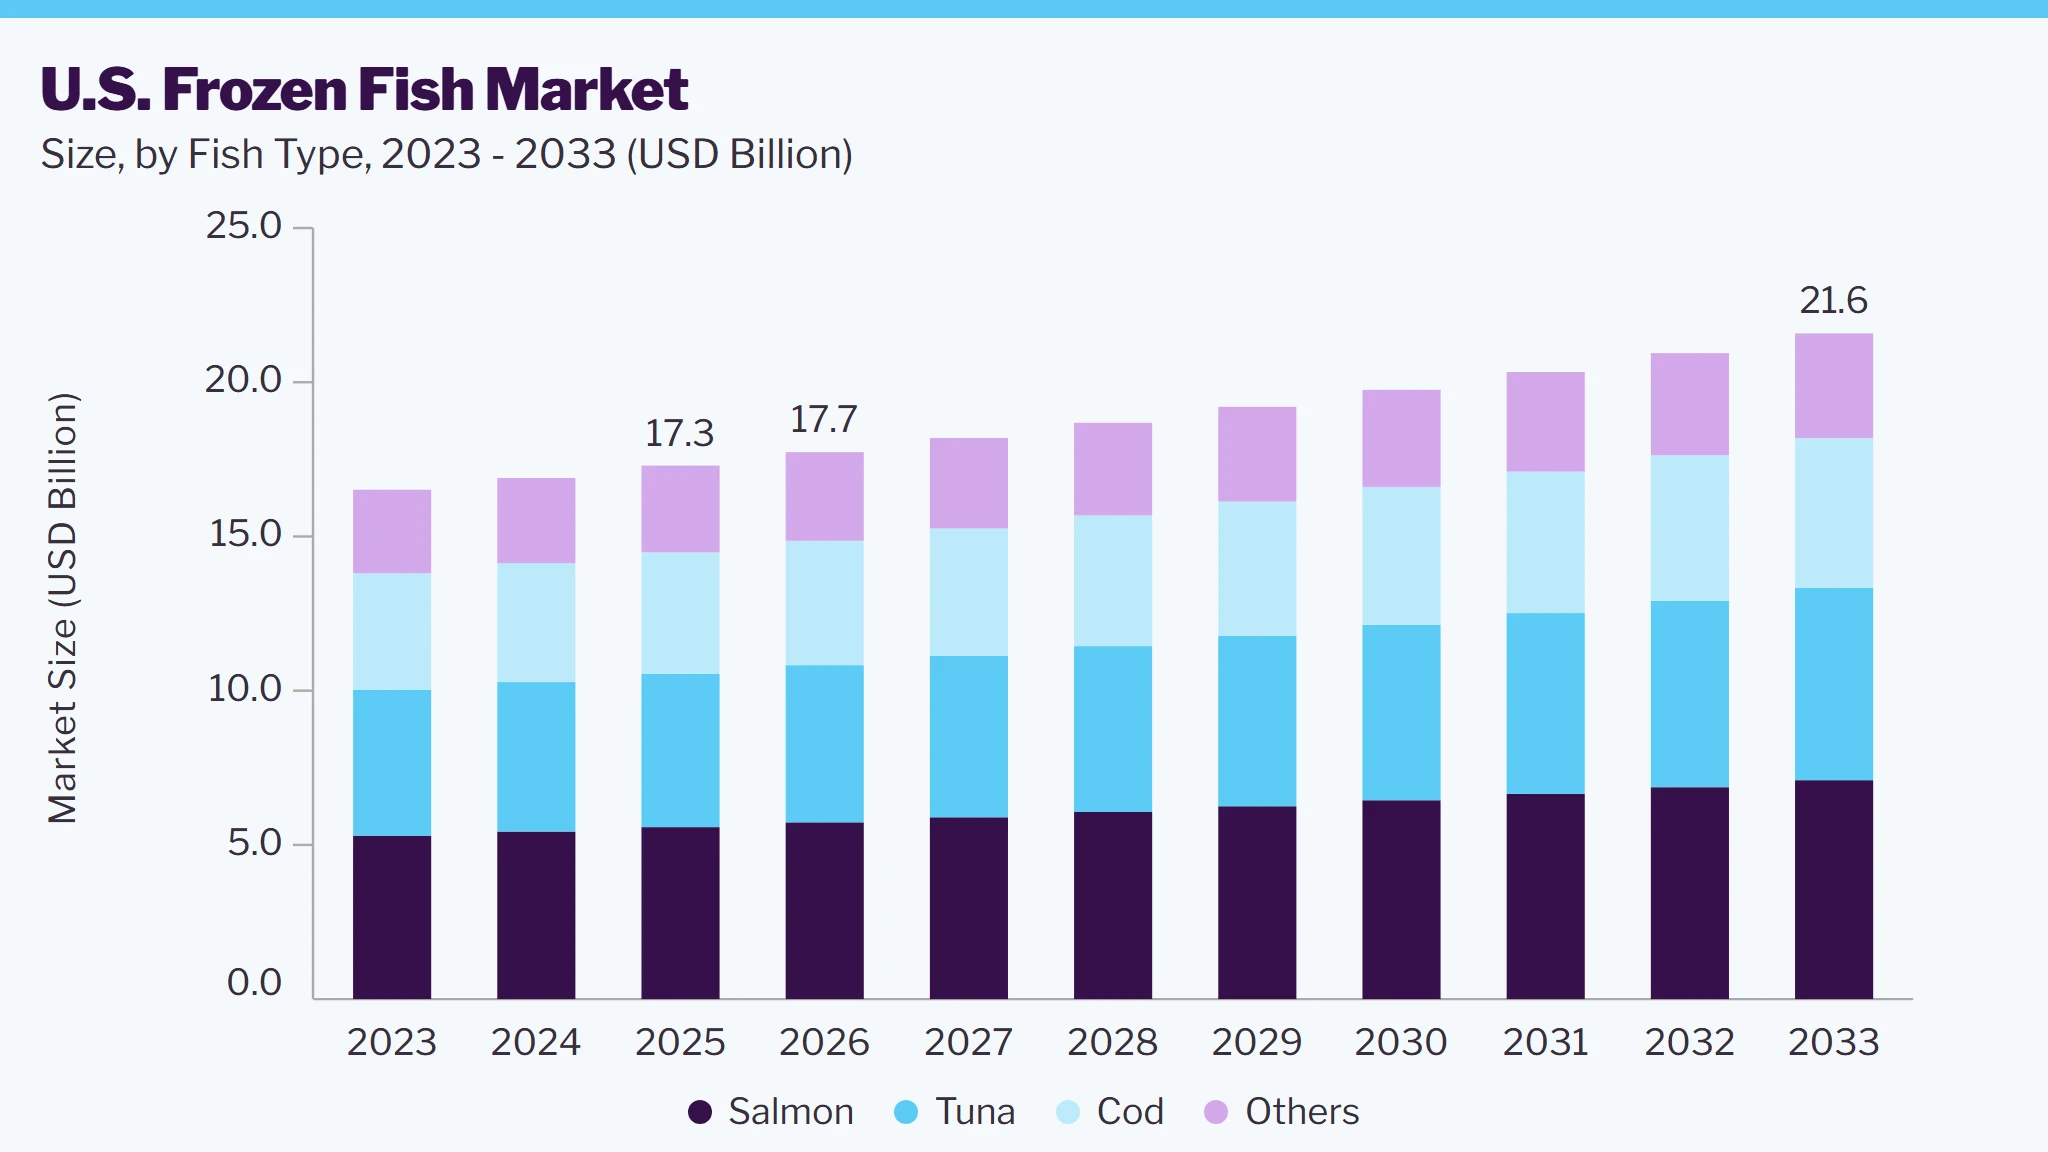 Source: Grand View Research, IR Documents, Primary Interviews, Paid DatabasesTo learn more about this report,
 Download Free Sample Report
Furthermore, rising urbanization and busy lifestyles are encouraging consumers to choose frozen seafood that requires minimal preparation and cooking time. Technological advancements in freezing and packaging methods are helping maintain the quality, freshness, and taste of fish products during storage and transportation. Increasing demand for diverse seafood varieties and ready-to-cook frozen fish products is also creating new opportunities for market expansion.
Market Dynamics
Busy lifestyles and limited time for meal preparation are encouraging U.S. consumers to choose convenient seafood products. Frozen fish can be stored for longer periods without frequent shopping. It also allows consumers to keep seafood readily available for planned meals. The ease of preparation makes frozen fish suitable for households seeking practical meal solutions. This changing consumption pattern supports continued demand in the U.S. frozen fish market. In January 2024, Scott & Jon’s expanded its frozen seafood portfolio by launching two frozen salmon bowl flavors for U.S. retailers nationwide. The products, priced at USD 4.99-6.49, feature portions increased by 20%, catering to demand for convenient and affordable seafood options.
The availability of fish can be affected by seasonal variations, weather conditions, and changes in fishing activity. Supply disruptions may create difficulties for processors and distributors in maintaining consistent inventories. Variations in supply can also affect procurement planning and production schedules. Import-related disruptions may further influence the availability of certain fish varieties. According to data published in January 2026, the global farmed salmon supply is expected to remain broadly flat, with production in Norway projected to decline by around 1% and Chile’s harvest expected to remain relatively stable. Strong demand combined with constrained supply could tighten salmon availability and contribute to higher prices, with industry experts forecasting a 16-18% price increase in 2026. These factors can create operational uncertainty for market participants.
U.S. consumers are increasingly interested in understanding where their seafood comes from. This creates opportunities for companies to provide greater transparency across the seafood supply chain. Digital tracking and improved supply-chain documentation can help businesses communicate product origin more effectively. Sustainable sourcing practices can also support stronger product differentiation in a competitive market. According to data published in January 2026, 90% of U.S. fisheries by volume were MSC certified, with more than 1,300 eco-labeled products available across all 50 states, including certified frozen seafood products. This growing availability of sustainably certified seafood highlights opportunities for companies to strengthen product differentiation and consumer trust through sustainable sourcing and transparent certification. As traceability expectations develop, companies can use transparent sourcing as a way to strengthen consumer trust.
Analyst Perspective
The U.S. frozen fish market is expected to maintain steady growth, supported by consistent demand for seafood across retail and foodservice channels. Consumer interest in convenient meal solutions and high-protein foods continues to support frozen fish consumption. Product innovation improved cold-chain infrastructure, and expanding online grocery channels are creating additional avenues for market development. Sustainability, responsible sourcing, and supply-chain transparency are becoming increasingly important factors for industry participants. Competition is likely to remain focused on product quality, sourcing capabilities, pricing, and distribution reach.
Consumer Insights
U.S. consumers are increasingly purchasing frozen fish as part of convenient and practical meal choices. Health and nutrition remain important considerations, particularly the protein and omega-3 content associated with many fish varieties. Consumers also value products that offer consistent quality, easy preparation, and flexible storage. Product origin, sustainability credentials, and clear labeling are becoming more relevant during purchasing decisions. Brand reputation, price, packaging, and availability across retail and online channels also influence consumer preferences.
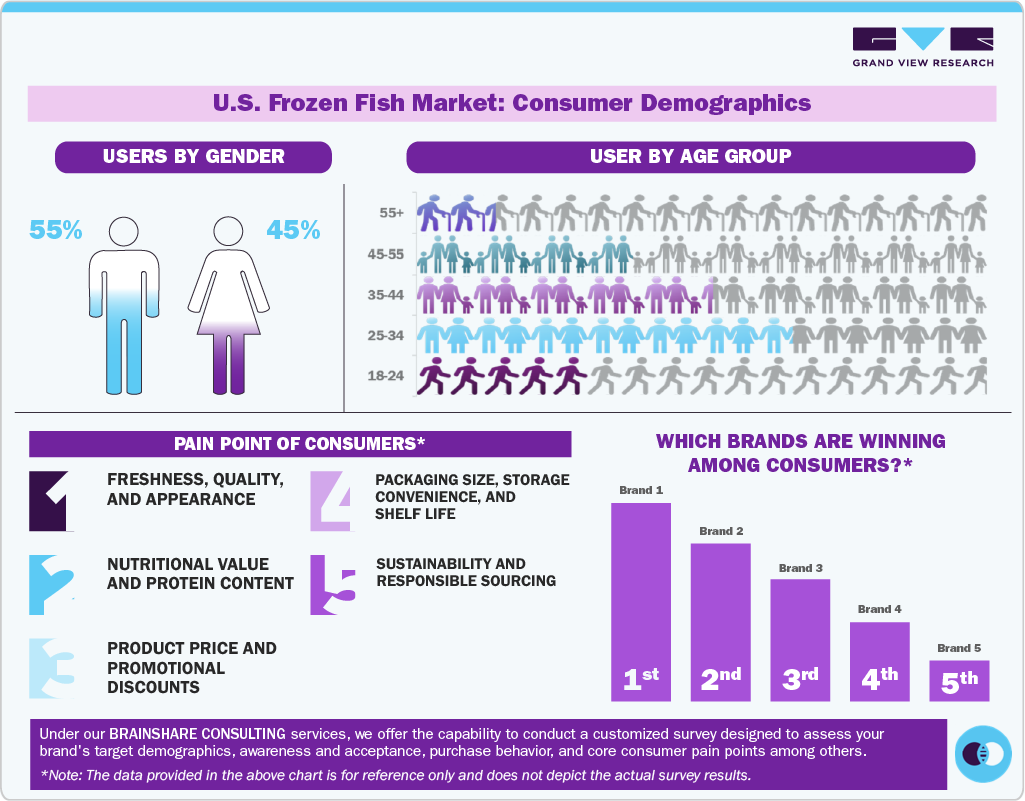 To learn more about this report, Download Free Sample Report
Fish Type Insights
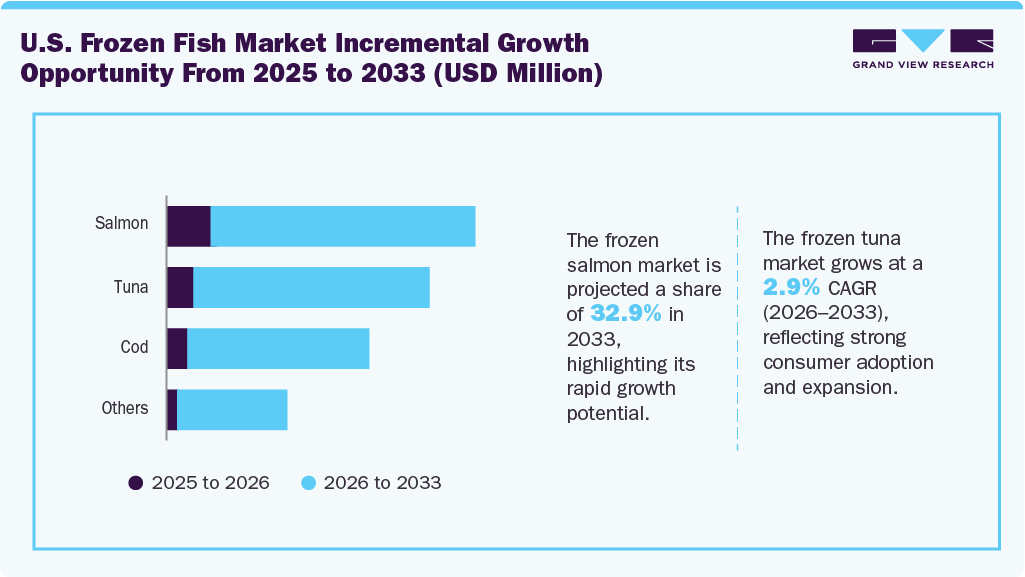
The frozen salmon accounted for the largest share of 32.2% of the revenue in 2025 in U.S. frozen fish market. The U.S. frozen salmon segment is supported by strong consumer preference for salmon as a premium seafood choice. Its high omega-3 fatty acid content and protein levels make it attractive to health-conscious consumers. Salmon is also widely used across household meals, restaurants, and foodservice applications. The availability of fillets, portions, and other convenient formats increases its suitability for different consumption occasions. Strong demand for farmed and wild salmon varieties further supports the segment’s presence in the frozen fish market.
 To learn more about this report, Download Free Sample Report
The frozen tuna market is projected to grow significantly at a CAGR of 2.9% from 2026 to 2033. The U.S. frozen tuna segment is driven by its versatility across foodservice, retail, and prepared-food applications. Tuna is commonly used in dishes such as salads, sandwiches, sushi, and ready-to-eat meals, creating demand across multiple food categories. Its relatively mild flavor allows it to appeal to a broad consumer base. Growing use of tuna in restaurants and commercial food preparation also supports consumption. The availability of different tuna species and cuts provides processors with opportunities to serve diverse market requirements.
Distribution Channel Insights
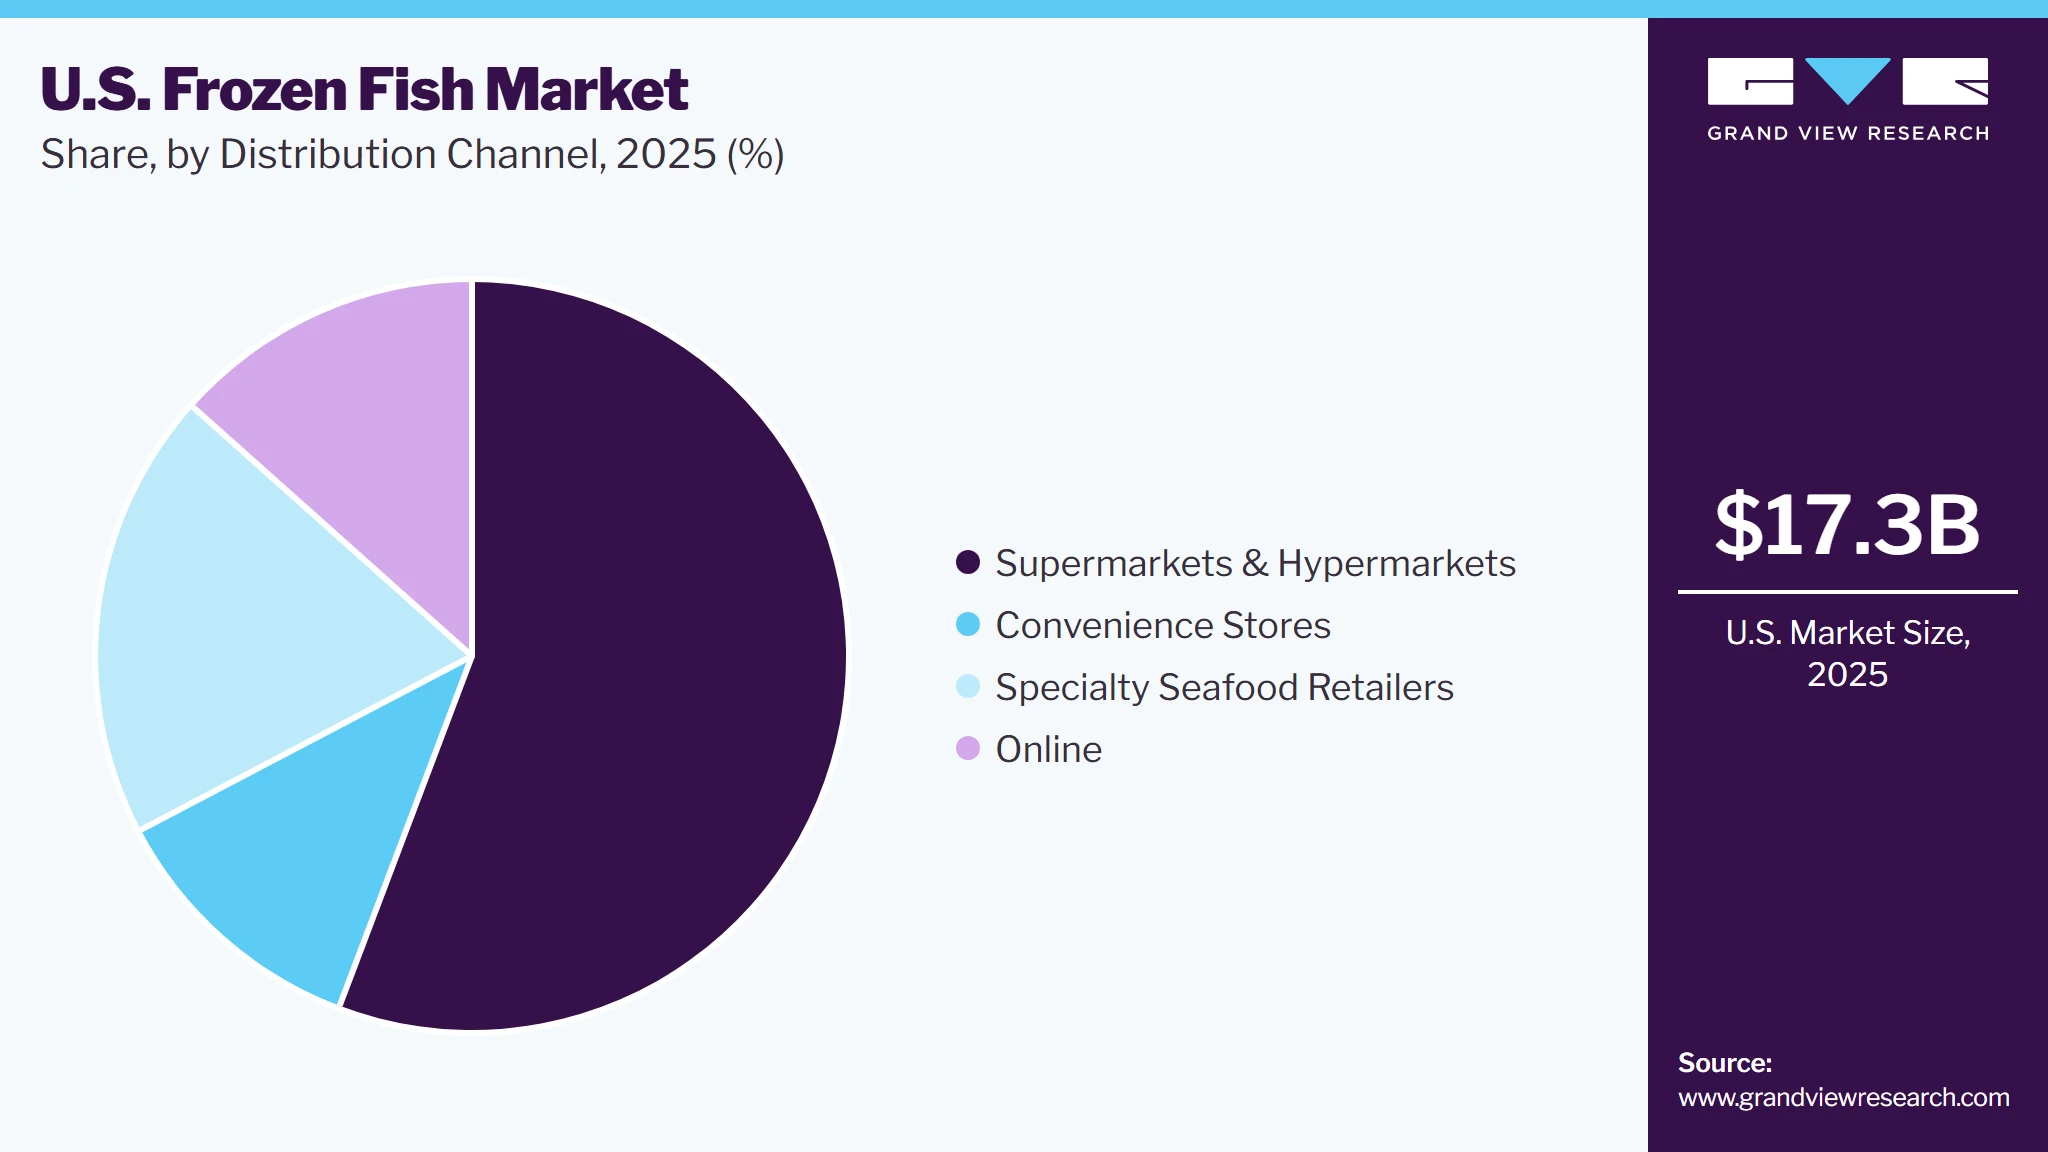
The sales of frozen fish through supermarkets & hypermarkets account for the largest share of 55.8% of the revenue in 2025 in U.S. frozen fish market. Supermarkets and hypermarkets remain important distribution channels due to their extensive physical presence across the U.S. Their dedicated frozen-food sections provide consumers with easy access to multiple fish varieties and package sizes. Promotional campaigns, discounts, and private-label offerings can encourage consumers to purchase frozen seafood. One-stop shopping also allows customers to combine frozen fish purchases with their regular grocery shopping. Strong relationships between retailers and seafood suppliers further support product availability in these outlets.
 To learn more about this report, Download Free Sample Report
The sales of U.S. frozen fish through online channels are projected to grow significantly at a CAGR of 3.3% from 2026 to 2033. Online distribution is gaining traction as consumers increasingly use digital platforms for grocery purchases. E-commerce allows shoppers to compare different frozen fish products, brands, pack sizes, and prices from home. Home-delivery services can also improve access to seafood for consumers who prefer not to visit physical stores. Digital platforms provide opportunities for companies to communicate product details, sourcing information, and preparation instructions directly to shoppers. The expansion of online grocery infrastructure and cold-chain delivery capabilities is supporting the availability of frozen fish through e-commerce channels.
Key Companies Insights & Market Share Insights
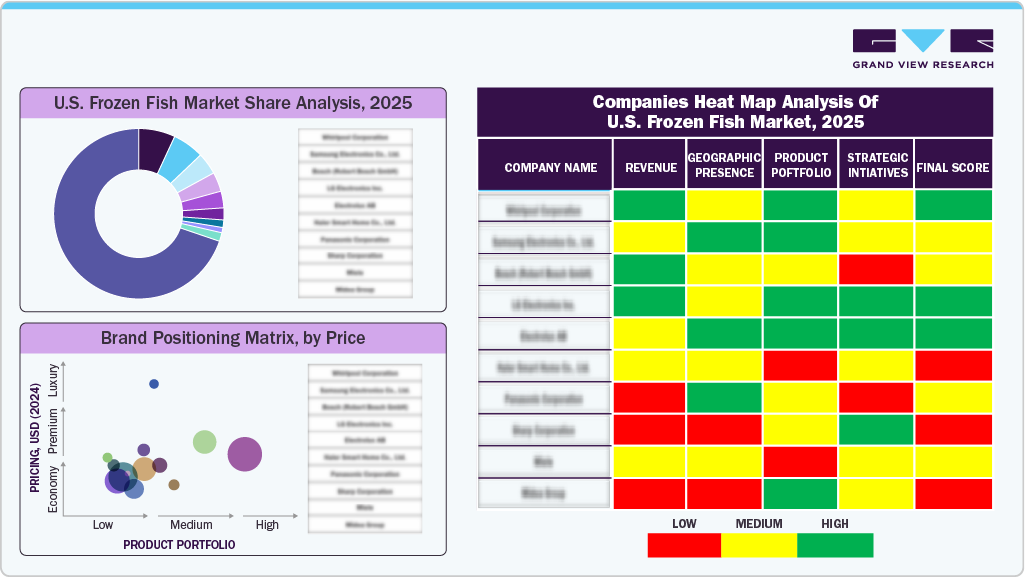
The U.S. frozen fish industry is characterized by the presence of established seafood processors, distributors, retailers, and vertically integrated companies. Key players compete through product variety, sourcing capabilities, brand recognition, pricing, and distribution networks. Market participants are increasingly focusing on sustainable sourcing, product innovation, and improved supply-chain efficiency to strengthen their position.
Private-label frozen seafood products from major retailers also contribute to competitive dynamics within the market. Overall, the industry remains fragmented across multiple product categories and distribution channels, with market share distributed among several domestic and international players.
 To learn more about this report, Download Free Sample Report
Key U.S. Frozen Fish Companies
-
Mowi
-
American Seafoods Company LLC
-
Icicle Seafoods, Inc
-
Thai Union Group PCL
-
Sysco Corporation
-
High Liner Foods Ingredients
-
Trident Seafoods Corporation.
-
Pacific American Fish Company Inc.
-
Nissui
-
Dongwon Industries Co., Ltd.
Competitive Benchmarking
Category
Operating Strategies
Competitive Edge
Weakness
Established Players (Mowi, Thai Union Group PCL)
- Vertical integration, large-scale processing, multi-channel distribution, and private-label contracts.
- Strong retailer relationships, traceability systems, and broad product portfolios.
- Complex operations, exposure to input-price volatility, and regulatory costs.
Emerging Players (High Liner Foods)
- Premium positioning, sustainable sourcing, value-added formats, and digital/online expansion.
- Faster innovation, differentiated products, and targeted consumer segments.
- Lower scale, weaker bargaining power, and higher per-unit costs.
Recent Developments
-
In March 2026, SeaPak renewed its “Even the Pickiest Pick SeaPak” national campaign for families, partnering with child nutrition expert Diana Rice to help parents encourage children to try seafood. The campaign promotes convenient, family-friendly frozen seafood options while highlighting ways to make seafood more appealing to younger consumers.
-
In January 2024, Scott & Jon’s expanded its frozen seafood portfolio by launching two frozen salmon bowl flavors for U.S. retailers nationwide. The products, priced at USD 4.99-6.49, feature portions increased by 20%, catering to demand for convenient and affordable seafood options.
U.S. Frozen Fish Market Report Scope
Report Attribute
Details
Market value size in 2026
USD 17.7 billion
Revenue Forecast in 2033
USD 21.6 billion
Growth rate (Revenue)
CAGR of 2.8% from 2026 to 2033
Actuals
2021 - 2025
Forecast period
2026 - 2033
Quantitative (Revenue) units
Revenue in USD Million, and CAGR from 2026 to 2033
Report coverage
Revenue forecast, company ranking, competitive landscape, growth factors, and trends
Segments covered
Fish Type, Distribution Channel
Country scope
U.S.
Key companies profiled
Mowi, American Seafoods Company LLC, Icicle Seafoods, Inc, Thai Union Group PCL, Sysco Corporation, High Liner Foods, Trident Seafoods Corporation, Pacific American Fish Company Inc., Nissui, Dongwon Industries Co., Ltd.
Customization scope
Free report customization (equivalent up to 8 analysts’ working days) with purchase. Addition or alteration to country, regional & segment scope.
Pricing and purchase options
Avail customized purchase options to meet your exact research needs. Explore purchase options
U.S. Frozen Fish Market Report Segmentation
This report forecasts revenue growth at the regional and country levels and provides an analysis of the latest industry trends and opportunities in each of the sub-segments from 2021 to 2033. For the purpose of this study, Grand View Research has segmented the U.S. frozen fish market report on the basis of fish type, distribution channel, and region:
-
Fish Type Outlook (Revenue, USD Million, 2021 - 2033)
-
Salmon
-
Tuna
-
Cod
-
Others
-
-
Distribution Channel Outlook (Revenue, USD Million, 2021 - 2033)
-
Supermarkets & Hypermarkets
-
Convenience Stores
-
Specialty Seafood Retailers
-
Online
-
Research Methodology
The U.S. frozen fish market figures in this report are based on a proven research process that combines executive interviews with secondary research from proprietary databases, company filings, and recognized regulatory and institutional sources. Market size is built through value-chain sizing - reconciling supply-side and demand-side estimates - and triangulated with bottom-up and top-down approaches. Every estimate passes multiple levels of expert validation before publication, with each U.S. frozen fish segment quantified using the revenue-capture definitions in the table below.
Segment Definition
Segment - Fish Type
Revenue capture definition
Salmon
Revenue in the U.S. frozen salmon segment is captured by supplying products to consumers seeking premium seafood and consistent year-round availability. Sales are supported by demand from both domestic consumption and commercial meal preparation. Suppliers can capture additional value through origin-based positioning, including wild-caught and farm-raised offerings. Packaging, brand positioning, and product certifications can further influence the realized selling price.
Tuna
Revenue in the U.S. frozen tuna segment is generated from demand across seafood restaurants, sushi businesses, retailers, and commercial kitchens. Higher-value sales are supported by tuna products intended for applications where appearance, texture, and freshness characteristics are particularly important. Suppliers can differentiate offerings through species, sourcing location, quality grades, and handling practices. Long-term supply relationships with foodservice and processing customers can provide recurring revenue opportunities.
Cod
Revenue in the U.S. frozen cod segment is supported by demand for a mild-flavored white fish used across household and commercial meal applications. Suppliers generate value by maintaining consistent quality and dependable supply throughout the year. Differentiation can be achieved through sourcing credentials, quality grades, packaging design, and preparation suitability. Institutional and foodservice contracts can provide additional volume-based revenue streams.
Others
Revenue from other frozen fish varieties is supported by demand for species that offer alternatives across different consumer preferences and culinary applications. The segment provides suppliers with opportunities to respond to regional consumption patterns and changing seafood preferences. Revenue potential can increase through introducing less-common species to new customer groups and retail categories. Flexible sourcing and diversified product portfolios can also help companies address fluctuations in demand across individual species.
Estimation Model
No.
Layer
Key Question
Description
01
Consumption Profile Layer
Who consumes frozen fish?
Health-conscious households, frequent seafood shoppers, families seeking convenient protein, and value-oriented consumers.
02
Market Reach Layer
Where do consumers access it?
Grocery chains, mass retailers, club stores, online grocery, specialty seafood retailers, and foodservice distributors.
03
Purchase & Retention Layer
What drives repeat purchases?
Convenience, price/value, taste, nutrition, easy preparation, product quality, and availability.
04
Value Generation Layer
How is revenue generated?
Frozen fillets & portions, breaded fish, value-added meals, private-label products, bulk/club packs, and foodservice supply.
Delivered Customizations
This report has been delivered with the following In-depth customizations
Client Request
Customization Delivered
Value Adds
U.S. Frozen Fish Market Supply & Sourcing Assessment
Mapped domestic production and import dependency across key frozen fish species, origin countries, harvesting methods, aquaculture exposure, seasonality, processing locations, and supply availability. Assessed supplier concentration and exposure to disruptions across major sourcing corridors.
Identifies sourcing vulnerabilities, diversification opportunities, supply-security priorities, and potential areas for strategic supplier development.
U.S. Frozen Fish Competitive & Pricing Assessment
Benchmarked major U.S. frozen fish suppliers, processors, private-label participants, and branded players across species, pack sizes, price points, promotional intensity, product claims, and market presence. Assessed pricing architecture and cost-to-serve differences across key product segments.
Clarifies competitive positioning, price/margin pools, whitespace in the market, and opportunities to improve commercial economics without relying solely on volume growth.
U.S. Frozen Fish Innovation, Sustainability & Regulatory Assessment
Evaluated product innovation across IQF, skin-on/skinless portions, breaded and seasoned formats, ready-to-cook products, packaging technologies, traceability, sustainability certifications, and responsible sourcing. Reviewed relevant U.S. seafood labeling, import, food-safety, and traceability requirements.
Highlights innovation themes, compliance implications, sustainability-led differentiation opportunities, and areas where new product or packaging concepts could strengthen market participation.
About the Author(s)
Consumer F&B Research Team
Consumer Goods · Consumer F&BThis report was authored by the consumer f&b research team at Grand View Research - comprising two research analysts, one senior research analyst, and one industry expert - with specialized expertise in the consumer f&b segment of the consumer goods industry. All findings are based on proprietary consumer goods databases, executive interviews, and regulatory analysis, subject to internal peer review prior to publication.
Last Updated:
Speak to Analyst

Customize this report to your needs - add regions, segments, or data points, with 20% free customization.
Or view our licence options:


ISO 9001:2015 & 27001:2022 Certified
We are GDPR and CCPA compliant! Your transaction & personal information is safe and secure. For more details, please read our privacy policy.


