- Home
- »
- Water & Sludge Treatment
- »
-
Process Chemicals for Water Treatment Market, Industry Report, 2025GVR Report cover
![Process Chemicals for Water Treatment Market Size, Share & Trends Report]()
Process Chemicals for Water Treatment Market Size, Share & Trends Analysis Report By Application (Sugar & Ethanol, Fertilizers, Geothermal Power, Petrochemicals, Refining), And Segment Forecasts, 2019 - 2025
- Report ID: GVR-2-68038-814-5
- Number of Report Pages: 103
- Format: PDF, Horizon Databook
- Historical Range: 2014 - 2015
- Forecast Period: 2017 - 2025
- Industry: Bulk Chemicals
Industry Insights
The global process chemicals for water treatment market size was valued at USD 6.10 billion in 2016. Heightened awareness regarding mitigating water pollution coupled with stringent regulations on water treatment and disposal has driven the market over the last few years. Rapid urbanization and industrialization witnessed in emerging economies such as China, India, and Brazil are likely to create substantial demand for process chemicals.
Increasing focus on alternative energy sources, such as geothermal energy, is boosting the dependence on geothermal plants across the world. Also, rapid industrialization coupled with favorable regulations is expected to spur the market, especially in emerging economies.

Regulations are playing a vital role in guiding industry participants towards assessing the impact of waste discharge on water quality and aquatic ecosystems. The oil & gas downstream and power generation sectors have particularly been at the core of the issue. Operational initiatives in these sectors towards water treatment have given rise to unique requirements in terms of the performance of chemicals. Therefore, constant product innovation and differentiation play a key role in process chemical manufacturers to capitalize on customer parameters and extend their footprint.
Water treatment process chemicals are majorly used in industrial and municipal wastewater treatment applications. The desalination process is primarily completed by non-chemical methods; the chemical process is used for corrosion inhibitors and biocides, among others. The reason behind spiraling demand for process chemicals is the reduced operating cost by 10-15% and 25 to 50% of the operating cost for industrial wastewater treatment.
Various industrial companies have adopted water-recycling systems in recent years owing to the scarcity of water. Besides this, rising awareness among consumers, renewed legislation, and media pressures are prompting companies to install modern and high-quality water treatment equipment. This trend has been positively influencing the demand for process chemicals.
Soaring needs to replace or upgrade current treatment plants in developed nations are fostering industry growth. Mandatory approval from pollution control boards as well as state government levels is further encouraging major industry participants to adopt high-performance water-treatment machinery and equipment. These companies are projected to comply with stringent environmental regulations about the appropriate treatment of wastewater.
Application Insights
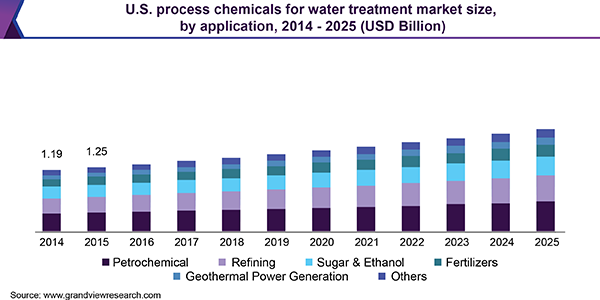
Based on the application, the market has been segmented into sugar & ethanol, fertilizers, geothermal power, petrochemicals, refining, and others. Petrochemicals held more than a quarter of the overall market volume in 2016. Petrochemical manufacturing represented the largest consumption of process chemicals in water treatment.
Petrochemical wastewater demands a combination of treatment methods to remove oil and other toxic contamination before they are discharged. Furthermore, stringent regulations on wastewater treatment and disposal necessitate high usage of process chemicals in the industry.
Refineries also represented a sizeable share in the process of chemicals for the water treatment market in 2016. Petroleum refineries and chemical plants use steam and water for a variety of processes ranging from desalination process to fluid catalytic cracking unit, cooling towers, and steam generators.
The scarcity of water is emerging as a common concern around the globe. Proper water treatment and operations of utility systems have become critical to have sustainable and reliable operations, which is fueling the demand for process chemicals used in water treatment.

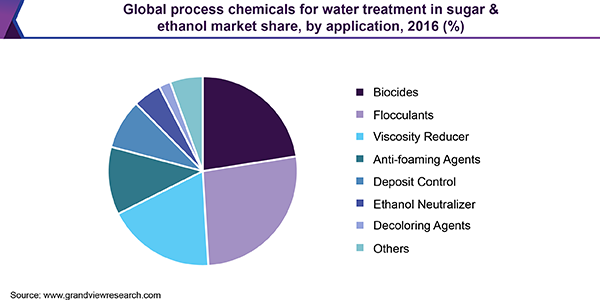
Surging demand for renewable fuels is impelling investments in numerous regions, including Brazil, Colombia, South America, Southeast Asia, and the United States. With ongoing expansion projects in the sugar and ethanol sector, investments in new power plants have become imperative and are estimated to grow the trade of ethanol as an unconventional source to fossil fuels.
Regional Insights
North America accounted for USD 1.42 billion in 2016. It is anticipated to progress at a CAGR of 4.9% over the forecast period. The process chemical industry in North America witnessed a severe decline after the global economic recession in 2008. The growth rate of this diverse and large sector tends to follow the track of GDP, but there are a couple of factors that can accelerate the growth of the market.
Since chemicals are low-priced, losses involved in chemical methods will be very less as compared to the physical process. Surging demand for clean water is bolstering the growth of the water treatment chemicals market. Deadly epidemics of cryptosporidium in American cities raised awareness for the need for freshwater. Products such as flocculants, coagulants, and biocides are extensively used in these industries for water treatment, reuse, and wastewater disposal.
Exhibiting a CAGR of 6.9%, Asia Pacific was valued at USD 1.79 billion in 2017. With rising investments in municipal drinking water, power plants, municipal wastewater, microelectronic plants, and refineries, Asia-Pacific is dominating the global wastewater and water treatment chemicals market.
Widening base of population and high urbanization rate in the Asia Pacific is creating a pressing need for water treatment. Insufficient water infrastructure, especially for wastewater treatment that is poorly maintained, is another problem that is being faced by the region. Countries such as Japan, South Korea, and India are witnessing a poor rate of wastewater treatment.
Other than poor wastewater infrastructure, governments of Japan, South Korea, and India are continually investing and focusing on the introduction of new wastewater treatment plants and upgrading capacity of existing plants, continuously pushing the demand for wastewater treatment chemicals higher.
Process Chemicals for Water Treatment Market Share Insights
The market is exceptionally aggressive with organizations undertaking a few activities, including regular mergers, acquisitions, capital extension, and strategic alliances. Established players are concentrating on expanding their share in the overall industry alongside productivity through technological innovation.
The market is dependent on raw material suppliers and manufacturers, who are primarily concentrated in the U.S., China, India, and Brazil. Organizations are concentrating on ideal business development by actualizing different development techniques. They are framing strategic alliances with strong players of the specific province and sharing innovative expertise for industrial sectors. Some of the key companies present in the market are Lenntech, Accepta, ChemTreat, Thermax, and Kemira.
Report Scope
Attribute
Details
The base year for estimation
2016
Actual estimates/Historical data
2014 - 2015
Forecast period
2017 - 2025
Market representation
Volume in Kilotons, Revenue in USD Million & CAGR from 2017 to 2025
Regional scope
North America; Europe, Middle East & Africa (EMEA); Asia Pacific, Latin America
Country Scope
U.S., Canada, U.K., Germany, China, Japan, New Zealand, Brazil, South Africa
Report coverage
Revenue forecast, company share, competitive landscape, growth factors and trends
15% free customization scope (equivalent to 5 analyst working days)
If you need specific information, which is not currently within the scope of the report, we will provide it to you as a part of customization
Segments Covered in the ReportThis report forecasts revenue and volume growth at global, regional, and country levels and provides an analysis of the industry trends in each of the sub-segments from 2014 to 2025. For this study, Grand View Research has segmented the global process chemicals for water treatment market report based on application and region:
-
Application Outlook (Volume, Kilotons; Revenue, USD Million, 2014 - 2025)
-
Sugar & Ethanol
-
Biocides
-
Flocculants
-
Viscosity Reducer
-
Anti-foaming Agents
-
Deposit Control
-
Ethanol Neutralizer
-
Decoloring Agents
-
Others
-
-
Fertilizers
-
Defoamers
-
pH Boosters
-
Granulation Aids
-
Sludge Conditioners
-
Antiscalants
-
Phosphates
-
Biocides
-
Silica Dispersants
-
Strength Agents
-
Anti-caking Agents
-
Wetting Agents
-
Others
-
-
Geothermal Power Generation
-
Defoamers
-
pH Boosters
-
Antiscalants
-
Biocides
-
Dewatering Aids
-
Silica Scale Control
-
Calcium Carbonate scale control
-
Others
-
-
Petrochemical Manufacturing
-
Defoamers
-
pH Boosters
-
Antiscalants
-
Biocides
-
Solvents
-
Others
-
-
Refining
-
Catalysts
-
pH Boosters
-
Solvents
-
Corrosion Inhibitors
-
Oxidizers
-
Coagulants & Flocculants
-
Demulsifiers
- Others
-
-
-
Regional Outlook (Volume, Kilotons; Revenue, USD Million, 2014 - 2025)
-
North America
-
The U.S.
-
Canada
-
-
Europe, Middle East & Africa
-
Belgium
-
France
-
Italy
-
Spain
-
U.K.
-
Germany
-
Austria
-
Sweden
-
Turkey
-
Finland
-
Poland
-
-
China
-
Asia Pacific
-
Singapore
-
India
-
Indonesia
-
South Korea
-
Australia
-
New Zealand
-
Japan
-
Thailand
-
Vietnam
-
CIS
-
Iran
-
-
Latin America
-
Brazil
-
Mexico
-
Argentina
-
Chile
-
-
South Africa
-
Share this report with your colleague or friend.
![gvr icn]()
NEED A CUSTOM REPORT?
We can customize every report - free of charge - including purchasing stand-alone sections or country-level reports, as well as offer affordable discounts for start-ups & universities. Contact us now
![Certified Icon]()
We are GDPR and CCPA compliant! Your transaction & personal information is safe and secure. For more details, please read our privacy policy.
We are committed towards customer satisfaction, and quality service.
"The quality of research they have done for us has been excellent."


