
- Home
- »
- Nutraceuticals & Functional Foods
- »
-
U.S. Amazon Creatine Supplements Competitive Intelligence Report - Grand View ResearchGVR Report cover
![U.S. Amazon Creatine Supplements Sales Data: Best Selling Products (SKU) and Brands, by Revenue & VolumeReport]()
U.S. Amazon Creatine Supplements Sales Data: Best Selling Products (SKU) and Brands, by Revenue & Volume
SKU-level competitive intelligence across 40 creatine supplements brands on Amazon U.S. - brand market share, sales volume, price trends, ratings and keyword demand. Refreshed every month.
U.S. Amazon Creatine Supplements Sales Data
SKU-level competitive intelligence across 40 creatine supplements brands on Amazon U.S. - brand market share, sales volume, price trends, ratings and keyword demand. Refreshed every month.
CATEGORY SNAPSHOT - JUNE 2026
$26.9M
Monthly category revenue
0.9 M
Monthly units sold
$26.4
Avg. selling price
4.6★
Avg. seller rating
40
Brands tracked
REPORT COVERAGE
What This Amazon Creatine Supplements Competitive Intelligence Report Covers
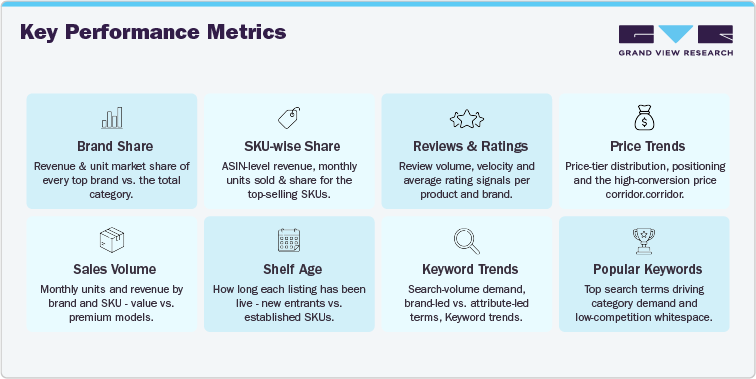
A monthly, SKU-level read on the U.S. creatine supplements category on Amazon - engineered to show where category revenue sits and how to compete for it. 8 tracked KPIs turn raw marketplace signals into decision-grade data for product, pricing and positioning calls.
Sample Output: Brand Share, SKU Sales Data & Keyword Insights
Every issue is delivered as a ready-to-present analytical report. Below are real pages from the June 2026 Amazon creatine supplements edition - the exact format and depth a client receives.
THORNE and Nutricost’s creatine supplements sales on Amazon, holding the highest revenue shares at 25.9% and 18.8%, respectively. Other notable brands such as Optimum Nutrition, Momentous, BulkSupplements and NAKED hold smaller individual shares, while the remaining brands together account for 55.3%, showing a moderately fragmented market.
In terms of customer ratings, brand performance is consistently strong, with most brands averaging around 4.6. THORNE and Nutricost stand out with the average rating of 4.7. Overall, the category shows strong consumer satisfaction, with leading revenue brands also maintaining competitive ratings.

The SKU-level sales data shows that ASIN B07978VPPH (Micronized Creatine Monohydrate Powder- 90 servings) is the leading product, generating $6.02 million monthly revenue with a 22.3% revenue share, making it the clear top SKU in the category.
Creatine Monohydrate Micronized Powder ASIN B00GL2HMES and Micronized Creatine Monohydrate Powder- 120 servings ASIN B002DYIZEO follow with monthly revenues of $3.09 million and $2.73 million, respectively. Nutricost has a strong SKU presence, with four products among the top listings, supported by high review volumes and strong ratings.


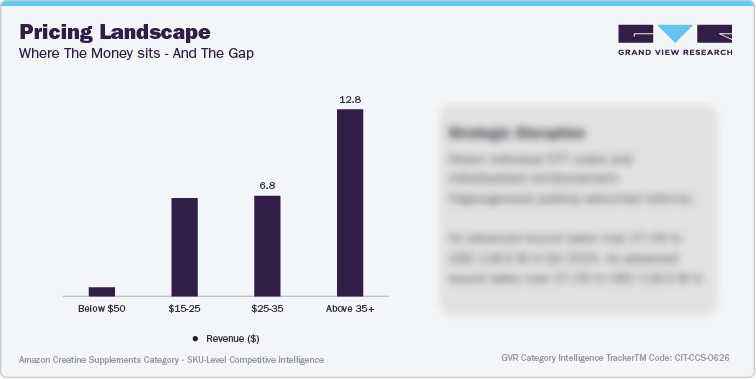
The pricing landscape shows that the largest revenue concentration is above $15, with the Above $35 price band generating USD 12.8 million and the $25 – $35 band generating USD 6.8 million. Together, these two bands account for nearly all category revenue, indicating that consumer demand is highly concentrated in accessible, mass-market pricing.
Built for Brand Managers, Amazon Sellers & Distributors
Built for Brand Managers, Amazon Sellers & Distributors
Anyone who needs accurate Amazon sales data, brand market share and category intelligence - without scraping listings or wrestling a dashboard.
Brand & Category Managers - benchmark brand share, track competitor SKUs, defend the price corridor and spot whitespace before the next launch.
Third-Party Amazon Sellers - validate the creatine supplements niche with real units-sold and revenue estimates, review barriers and low-competition keywords.
Distributors & Wholesalers - size category demand, find the fastest-selling SKUs and identify which brands are worth stocking and distributing.
Report vs. Tool
Finished Analysis, Not Just Another Amazon Dashboard
DIY Amazon analytics tools hand you raw data and leave the thinking to you. This report delivers the finished competitive intelligence - interpreted, source-tagged and validated against primary interviews.
-
Analyst-written strategic implications, not just charts to export
-
Bottom-up SKU roll-ups triangulated against category totals
-
Every data point source-tagged for methodological transparency
-
Month-over-month continuity under a fixed tracker code (CIT-CS-0626)
GVR Tracker
Brand & SKU market share
Computed & ranked
Strategic interpretation
Analyst-written
Primary validation
Included
Ready to present
Slides + tables
Effort to insight
Zero - it’s done
Get the Monthly Amazon Creatine Supplements Category Report
Single issue, annual subscription or multi-category bundle - with optional raw ASIN-level data export and dashboard access.
Pricing Options
Individual License
Team License
Enterprise License
- Report accessible by 1 user only
- One-time purchase
- PDF and PPT Only
- Report accessible by 5 users only
- 3 monthly issues
- PDF, PPT, and Excel (ASIN-Level Data)
- Report accessible by whole team
- 12 monthly issues with month-over-month trend continuity
- PDF, PPT, Excel (ASIN-Level Data) and Live Dashboard
-



Customize this report to your needs - add regions, segments, or data points, with 20% free customization.
Or view our licence options:


ISO 9001:2015 & 27001:2022 Certified
We are GDPR and CCPA compliant! Your transaction & personal information is safe and secure. For more details, please read our privacy policy.


