
- Home
- »
- Medical Devices
- »
-
U.S. Midwest Active Adult (55+) Community Market Size Estimate Trend And Competitive AnalysisGVR Report cover
![U.S. Midwest Active Adult (55+) Community Market: Comprehensive Competitive Benchmark Report]()
U.S. Midwest Active Adult (55+) Community Market: Comprehensive Competitive Benchmark Analysis And Market Size Estimate Trend
Market Overview
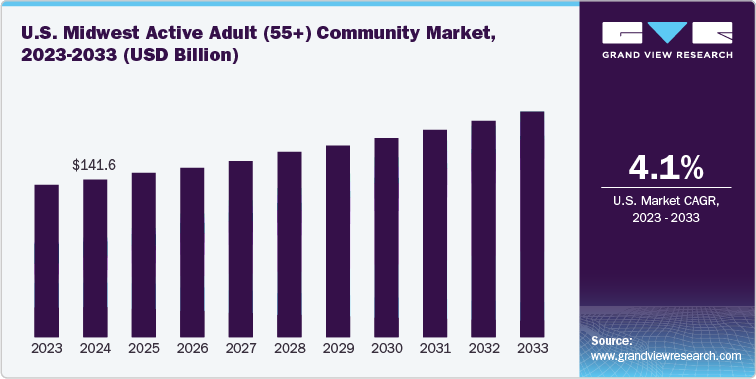
The U.S. Midwest active adult (55+) community market was valued at USD 141.58 billion in 2024 and is expected to register a CAGR of 4.07% over the forecast period to reach an estimated value of USD 202.73 billion by 2033. The growth is attributed to the increasing population of aging baby boomers in the region. According to the Indiana Business Research Center, which produces Indiana’s official population projections, the percentage of older adults aged 65 and over in Indiana is expected to rise from 16.5% of the state's total population in 2020 to 20.1% by 2030. This equates to a total of 1.4 million Hoosiers.
In addition, the U.S. Census Bureau reported that the population aged 55 and older in Indiana reached 2.02 million in 2023. These individuals are seeking residences that offer low maintenance living and provide amenities. As the number of retirees increases, the demand for active adult housing in the Midwest is rising.
Regional Highlights
-
Infrastructure improvements and regional economic development initiatives are making many Midwestern cities and suburbs more liveable.Both local governments and private developers are increasingly focusing on age-friendly designs, transportation networks, and healthcare infrastructure.This aligns with the priorities of older adults, who value safety, mobility, and access to medical care.
-
The rise of remote work and hybrid family arrangements is prompting some older adults to move closer to their children and grandchildren.
-
The increasing awareness and promotion of wellness-focused lifestyles among the 55+ population are influencing the design and marketing of active adult communities. Developers are integrating wellness programs, preventative healthcare services, and social support systems into their offerings.
U.S. Midwest Target Population Analysis
Tulsa, Oklahoma:
Tulsa, Oklahoma target population analysis, by age group, 2018 -2023
Age
2018
2019
2020
2021
2022
2023
2024
2025
2026
2027
2028
2029
2030
55 to 59
40,513
38,753
40,514
37,883
36,266
37,791
40,514
38,754
40,515
37,884
36,267
37,791
40,515
Similar age group analysis will be provided for Midwest and U.S. In addition, the retiree spending behavior and housing preferences andmigration patterns analysis (inbound retiree movement) will also be provided for U.S., Midwest and Tulsa, Oklahoma.
U.S. Migration Patterns Analysis (Inbound Retiree Movement)
-
National Trends
In 2023, the U.S. witnessed a significant increase in retiree relocations. According to a study by 401k Specialist, more than 338,000 Americans moved to retire in 2023, marking a 44% increase compared to 2022.
The United Van Lines 47th Annual National Movers Study highlighted that Americans are increasingly moving to more affordable, lower-density areas across the country, with many heading to Southern states. The study indicated that affordability, regional climates, urban planning, and job growth are significant factors influencing these migration patterns.
-
Key Destinations
-
Florida: Continues to be a top destination for retirees due to its warm climate and tax-friendly policies.
-
South Carolina and North Carolina: Attract retirees seeking a balance between coastal living and affordability.
-
Texas: Offers a combination of low taxes and diverse urban and rural living options.
-
-
Motivations For Relocation
-
Affordability: Retirees are seeking states with lower cost of living to maximize their retirement savings.
-
Proximity to Family: Many moves are motivated by the desire to be closer to children and grandchildren.
-
Healthcare Access: Availability of quality healthcare facilities is a critical consideration.
-
Lifestyle Changes: A desire for a change in environment or lifestyle, such as moving from urban to rural settings.
-
Furthermore, the U.S. Midwest active adult (55+) community market continues to attract investor and developer interest, largely driven by its comparatively affordable pricing structure. As national average prices for active adult units have declined in recent years, the Midwest has consistently maintained an even lower price range, offering a compelling value proposition. This pricing gap appeals to cost-conscious retirees seeking quality living at a lower cost and enhances return potential for developers and operators targeting underserved or emerging areas. The table below illustrates the sustained affordability of the Midwest market relative to national averages from 2018 to 2024.
Comparative analysis table: U.S. vs. Midwest U.S. active adult (55+) community market, by average price per unit (2018-2024) (USD)
Region
2018
2019
2020
U.S. Avg Price/Unit (USD)
275,000 - 285,000
265,000 - 275,000
245,000 - 255,000
Similar comparative analysis will be provided for U.S. and Midwest by CAP rates, average rental rates, net absorption trends, and occupancy trends.
Moreover, one of the key strengths of the U.S. Midwest active adult (55+) community market is its efficient operating cost structure. Available benchmarking data indicates that key expense categories remain well-managed relative to revenue. This level of cost control contributes to stable financial performance and strengthens the region’s attractiveness for ongoing and future investments. The table below outlines the estimated monthly operating expenses per unit and their share as a percentage of revenue.
In-depth Benchmarking of Operating Expenses Per Unit/Month and as a Percentage of Revenue:
Category
Operating Expenses Per Unit/Month (USD)
Staffing (Property Managers, Concierge, Maintenance)
2,537.34 - 2,919.3
Similarly, comparison of OpEx structures will be provided for the key 5 players in the U.S. midwest active adult (55+) community market.
Below is the representation of data that will be provided in a report:
SUN CITY HUNTLEY
Category
Operating Expenses Per Unit/Month (USD)
Staffing (Property Managers, Concierge, Maintenance)
324.07 - 396.08
-


Customize this report to your needs - add regions, segments, or data points, with 20% free customization.
Or view our licence options:


ISO 9001:2015 & 27001:2022 Certified
We are GDPR and CCPA compliant! Your transaction & personal information is safe and secure. For more details, please read our privacy policy.


