- Home
- »
- Reports
- »
-
Health & Wellness Management Services Category Report, 2030
![Health & Wellness Management Services Category Report, 2030]()
Health and Wellness Management Services Procurement Intelligence Report, 2023 - 2030 (Revenue Forecast, Supplier Ranking & Matrix, Emerging Technologies, Pricing Models, Cost Structure, Engagement & Operating Model, Competitive Landscape)
- Published Date: Dec, 2023
- Base Year for Estimate: 2022
- Report ID: GVR-P-10562
- Format: Electronic (PDF)
- Historical Data: 2020 - 2021
- Number of Pages: 60
Health and Wellness Management Services Category Overview
“Increased need for personalization and growing awareness about mental and social well-being are driving the category’s growth.”
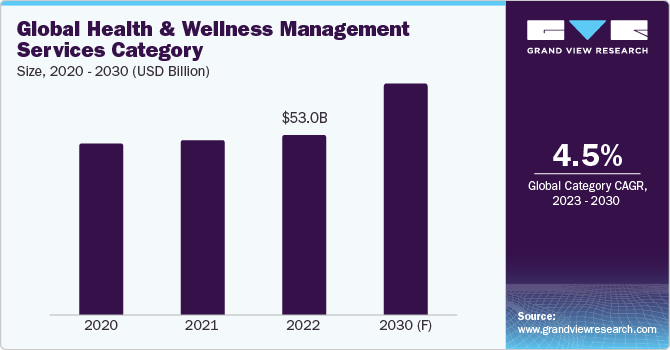
The health and wellness management services category is expected to grow at a CAGR of 4.47% from 2023 to 2030. Employee retention is a major concern for many businesses in the modern economy. The U.S. Bureau of Labor Statistics reports that 3.7 million workers had quit their positions as of September 2023. As the recruitment process is time-consuming and can cost as much as one-half to twice an employee's annual salary, this statistic is alarming as per a Forbes report. According to a Flexjobs study in 2022, 49% of workers quit because there were not enough healthy work-life boundaries, and 62% of workers quit because of a toxic workplace culture. As a result of these shifts in many industries, some businesses are starting to take a more proactive approach to employee retention by providing corporate well-being programs.
As per Wellable Labs' 2022 Employee Wellness Industry Trends Report, 76% of businesses are increasing their investments in stress management and resilience resources for their employees. Implementing these programs has in turn reduced voluntary employee attrition rates. The major factors driving the category's growth are increased employee attrition rates, a growing need for personalization, better work-life balance, rising awareness about mental and social well-being, and a growing use of digital healthcare applications.
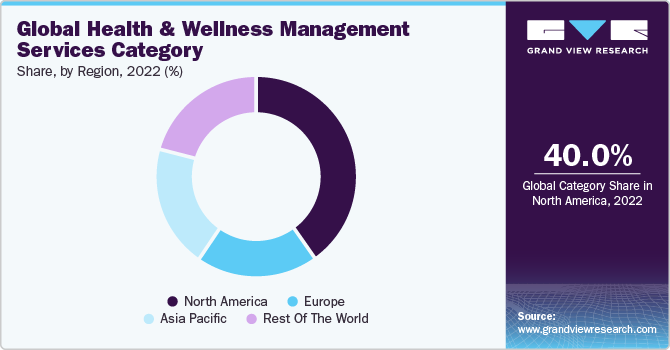
The global health and wellness management services category was estimated at USD 53 billion in 2022. In 2022, North America dominated the category with a share of 40% followed by Europe. Participants in well-being programs report a 70% increase in productivity over non-participants, according to the American Journal of Health Promotion in 2023.
Customers and employees are becoming more proactive about their health. There is an increase in personalized, data-driven healthcare applications that make it easy for customers to schedule doctor's appointments or get the prescription drugs they require, and gadgets that allow them to keep an eye on their symptoms and overall health in between visits. According to a PwC report in 2022, there will be significant growth in this well-being and fitness wearables industry in the next few years. It was also found that more than 70% of consumers were health-conscious and wanted their wearables to help them live longer.
Recent years have seen a significant increase in the popularity of fitness trackers and smartwatches as examples of wearable technology. In some companies, many employers are motivating staff members to track their activity levels, create fitness objectives, and get individualized feedback by introducing wearable technology into workplace programs. Employees in today's workplace frequently struggle with stress and anxiety. Employers are also promoting meditation applications or guided sessions to help staff members maintain balance in the face of demanding work schedules.
Supplier Intelligence
“What is the nature of the health and wellness management services category? Who are some of the leading players?”
The health and wellness management services industry is highly fragmented. Due to increasing consumer awareness and global demand, large companies have been investing heavily in developing new well-being services to gain a competitive edge. Following the pandemic, there has been an increased interest in supplements and telehealth sectors from investors. Businesses are actively working to support the health and well-being of their workforce in light of the growing importance of the environmental, social, and governance framework.
In an effort to lower the expense of employee healthcare, businesses are also funding well-being initiatives. For instance, in September 2023, it was announced that there was a planned merger between Virgin Pulse and HealthComp valued at USD 3 billion. As a result of the merger, an integrated health plan management platform will be created through technology and an AI-enabled data platform. This will offer health plan designs targeted at enhancing member health outcomes and reducing costs for both employers and members.
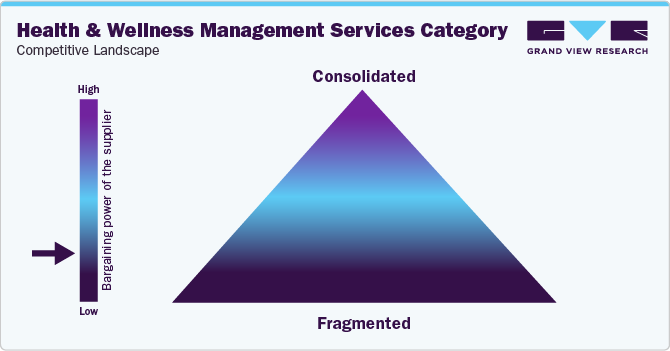
In many emerging economies such as India, this category is disorganized and fragmented. However, the industry in India is set to witness enormous growth over the next few years according to the Economic Times report in 2022. The bargaining power of suppliers globally is moderate owing to the presence of multiple players and high fragmentation. However, depending on the type of specialized service or region dominance, the suppliers can have a higher power. Barriers as such longer sales cycles for products or services, difficulty in gauging the local demand, dynamic regulatory landscape, pricing disparities, etc. can sometimes make it slightly difficult for new suppliers to enter this health and wellness management industry. A few instances of the different regulatory bodies or regulations include Equal Employment Opportunity Commission (EEOC), Genetic Information Nondiscrimination Act (GINA), Americans with Disabilities Act (ADA), and Health Insurance Portability and Accountability Act (HIPAA).
Key suppliers covered in the category:
-
ComPsych Corporation
-
Wellness Corporate Solutions (Laboratory Corporation of America)
-
Virgin Pulse, Inc.
-
EXOS
-
Marino Wellness LLC
-
Privia Health
-
Vitality Group International, Inc.
-
Wellsource, Inc.
-
Central Corporate Wellness
-
Truworth Wellness
-
Healthfirst, Inc.
-
FitMind LLC
-
Limeade, Inc.
-
TotalWellness
Pricing and Cost Intelligence
“What are some of the major cost components in this category? Which variables impact the total cost?”
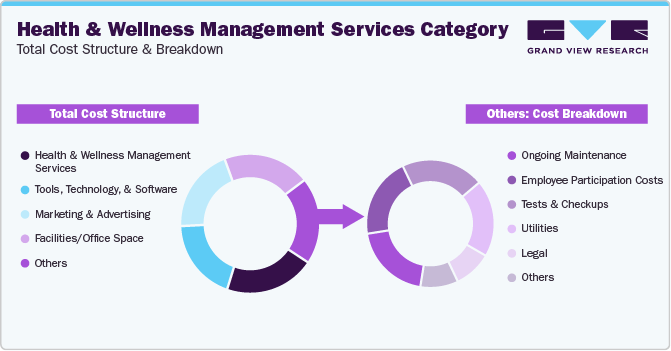
Salaries of health and wellness consultants, tools, technology, and software, marketing and advertising, and facilities/office space are some of the key cost components in this category. Some other costs may include ongoing maintenance, employee participation costs, tests and checkups, utilities, and legal costs, etc. Health and wellness consultants can include a range of professionals such as doctors, counselors, therapists, corporate coaches, etc. On average, marketing and advertising can account for between 8% - 15% of the total costs. For large corporations in the health and wellness segment, the allocation can increase up to 20%.
On average, as of May 2023, digital advertisement campaigns can cost between USD 1,250 and USD 10,000 per month. For Pay-per-click (PPC) ads, the Cost per Click (CPC) can range from USD 1.16 to USD 2. For small and medium-sized businesses, on a per-project basis, the cost of digital advertising campaigns can be around USD 1,000 - USD 7,000.
Corporate wellness initiatives can also lower a company's medical expenses. Healthier employees tend to visit the doctor less, take prescription medications less frequently, and require fewer hospitalizations, which can result in lower healthcare costs for companies. Insurance premiums, co-pays, deductibles, and other costs associated with offering healthcare benefits to employees may be included in a company's healthcare costs. According to a Zippia 2022 report, it was found that companies or employers receive a 6:1 return on investment in their wellness programs.
The cost of employee care varies greatly; according to Limeade studies in 2022, the average annual cost of a wellness program for each employee can range from USD 150 to 2,000. The size of the business, the kind of program, industry considerations, and the degree of support offered are some of the variables that affect how much a corporate wellness program costs. It is apparent that there are differences in the average cost of corporate wellness programs per employee; however, the cost per employee is also contingent upon the various elements that companies choose to include in their programs.
The chart below illustrates the major cost components associated with the category.
In 2022, Harvard researchers discovered that the adoption of well-being programs results in a USD 3.27 annual reduction in medical costs and a USD 2.73 annual reduction in absenteeism costs for every dollar spent on them. Comprehensive programs are being increasingly implemented at worksites to achieve a positive return on investment, particularly when it comes to program costs. An evaluation of health risks, rewards, a shift in culture, and challenges and campaigns to modify behavior are all components of a comprehensive well-being program. Additionally, customized health coaching and biometric screening may be part of the package.
For instance, biometric screening can cost between USD 40 - 75, health coaching (considering 6 sessions) can cost USD 140 - 165, and benefit-based incentives can range between USD 200 and 8,000 per employee annually. Benefits-based wellness incentive programs can involve elements such as paid time off, an HSA or HRA contribution, a reduction in co-pay or deductible, or a rebate on insurance premiums.
The report provides a detailed analysis of the cost structure and the pricing models adopted by prominent suppliers in this category.
Sourcing Intelligence
“What kind of strategies are considered in this category? Which are the most mature markets?”
Among the major markets, the U.S. is the most mature, followed by Europe. More than 65% - 70% of employees in the North American region receive some kind of well-being initiative or program. More than 40% - 45% of employees in the European region receive well-being benefits or programs. However, as per recent studies in 2022, businesses in the Asia Pacific area such as New Zealand, Singapore, and Australia, provide programs in the different aspects of well-being at a cost that is nearly the same as the worldwide average.
Some of the most preferred destination countries for this category are Sweden, Denmark, Singapore, New Zealand, Australia, Austria, and the U.S. Singaporeans have a very good healthcare system and manage chronic diseases well, with a focus on early detection and prevention and close physician supervision. The nation also has an extensive well-being management system. Singaporean businesses are increasing their workers' benefits related to mental health and wellness.
There are high standards of quality care in the Swedish healthcare system, as well as an above-average expenditure on healthcare. Approximately 600,000 Swedes are covered by private health insurance, which is usually provided by their employers and allows them to bypass waiting lists.
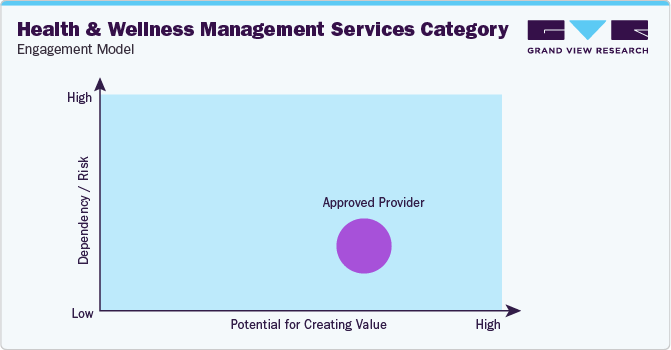
"An approved provider is a supplier that meets a predefined set of qualifications, quality standards, prior-proven performances, or other selection criteria."
In terms of health and wellness management services sourcing intelligence, companies engage with approved providers. Selecting vendors based on a comprehensive program/approach that addresses employee needs on a holistic level, evaluating suppliers on program access, administration cost, and relevant metrics (such as employee satisfaction and participation, work and peer environment, absenteeism, etc.), negotiating with more than two vendors to obtain better cost-effectiveness, assessing whether the findings can help in establishing best practices in the workplace, if the program needs to be updated every six months or there is an urgent need for data refresh, whether suppliers adhere to the regulatory standards and compliance such as HIPAA and EEOC are some of the strategies considered in this category.
The report also provides details regarding day one, quick wins, portfolio analysis, key negotiation strategies of key suppliers, and low-cost/best-cost sourcing analysis.
Health and Wellness Management Services Procurement Intelligence Report Scope
Report Attribute
Details
Health and Wellness Management Services Category Growth Rate
CAGR of 4.47% from 2023 to 2030
Base Year for Estimation
2022
Pricing Growth Outlook
8% - 12% (Annually)
Pricing Models
Cost plus, value-based, and tiered pricing model
Supplier Selection Scope
Cost and pricing, past engagements, productivity, geographical presence
Supplier Selection Criteria
Employee assistance programs, workplace wellness programs, health assessments, tools, technology, and tracking, operational capabilities, quality measures, certifications, data privacy regulations, and others
Report Coverage
Revenue forecast, supplier ranking, supplier positioning matrix, emerging technology, pricing models, cost structure, competitive landscape, growth factors, trends, engagement, and operating model
Key Companies Profiled
ComPsych Corporation, Wellness Corporate Solutions (Laboratory Corporation of America), Virgin Pulse, Inc., EXOS, Marino Wellness LLC, Privia Health, Vitality Group International, Inc., Wellsource, Inc., Central Corporate Wellness, Truworth Wellness, Healthfirst, Inc., FitMind LLC, Limeade, Inc., and TotalWellness
Regional Scope
Global
Revenue Forecast in 2030
USD 75.2 billion
Historical Data
2020 - 2021
Quantitative Units
Revenue in USD million and CAGR from 2023 to 2030
Customization Scope
Up to 48 hours of customization free with every report.
Pricing and Purchase Options
Avail customized purchase options to meet your exact research needs. Explore purchase options
Frequently Asked Questions About This Report
b. The global health and wellness management services category size was valued at USD 53 billion in 2022 and is estimated to witness a CAGR of 4.47% from 2023 to 2030.
b. The increasing awareness and preference for better lifestyle management, growing employee assistance programs in workplaces, rising use of personalized health applications in addition to increasing investments in mental health and stress management programs by companies to boost employee morale are driving the growth of this category.
b. North America dominates this category with the largest share, as more than 65 – 70% of corporate employees have access to different kinds of corporate wellness programs, followed by the European region.
b. The global health and wellness management services is a highly fragmented industry. In many emerging economies such as India, this category is disorganized and fragmented. Some of the key players include ComPsych Corporation, Wellness Corporate Solutions (Laboratory Corporation of America), Virgin Pulse, Inc., EXOS, Marino Wellness LLC, Privia Health, Vitality Group International, Inc., Wellsource, Inc., Central Corporate Wellness, Truworth Wellness, Healthfirst, Inc., FitMind LLC, Limeade, Inc., and TotalWellness.
b. Salaries of health and wellness consultants, tools, technology and software, marketing and advertising, and facilities/office space are some of the key costs associated with this category. Few other costs can include ongoing maintenance, employee participation costs, tests and checkups, utilities and legal, etc.
b. Evaluating vendors on program access, administration cost, and relevant metrics, negotiating with more than two vendors to obtain better cost-effectiveness and whether the findings can help in establishing best practices in the workplace, assessing if the program needs to be updated every 6 months or there is an urgent need for data refresh are some of the strategies considered in this category.
Share this report with your colleague or friend.
GET A FREE SAMPLE
This FREE sample includes market data points, ranging from trend analyses to market estimates & forecasts. See for yourself...
Add-on Services
Should Cost Analysis
Component wise cost break down for better negotiation for the client, highlights the key cost drivers in the market with future price fluctuation for different materials (e.g.: steel, aluminum, etc.) used in the production process
Rate Benchmarking
Offering cost transparency for different products / services procured by the client. A typical report involves 2-3 case scenarios helping clients to select the best suited engagement with the supplier
Salary Benchmarking
Determining and forecasting salaries for specific skill set labor to make decision on outsourcing vs in-house.
Supplier Newsletter
A typical newsletter study by capturing latest information for specific suppliers related to: M&As, technological innovations, expansion, litigations, bankruptcy etc.
![gvr icn]()
NEED A CUSTOM REPORT?
We can customize every report - free of charge - including purchasing stand-alone sections or country-level reports, as well as offer affordable discounts for start-ups & universities.
Contact us now to get our best pricing.
![esomar icon]()
ESOMAR certified & member
![ISO]()
ISO Certified
We are GDPR and CCPA compliant! Your transaction & personal information is safe and secure. For more details, please read our privacy policy.
We are committed towards customer satisfaction, and quality service.
Client Testimonials

"The quality of research they have done for us has been excellent..."
ISO Certified


