- Home
- »
- Reports
- »
-
Learning and Development Sourcing Intelligence Report, 2030
![Learning and Development Sourcing Intelligence Report, 2030]()
Learning and Development Procurement Intelligence Report, 2023 - 2030 (Revenue Forecast, Supplier Ranking & Matrix, Emerging Technologies, Pricing Models, Cost Structure, Engagement & Operating Model, Competitive Landscape)
- Published Date: Dec, 2023
- Base Year for Estimate: 2022
- Report ID: GVR-P-10565
- Format: Electronic (PDF)
- Historical Data: 2020 - 2021
- Number of Pages: 60
Learning and Development Category Overview
“The learning and development category is growing rapidly as organizations prioritize enhancing employees' skills and knowledge for professional growth.”
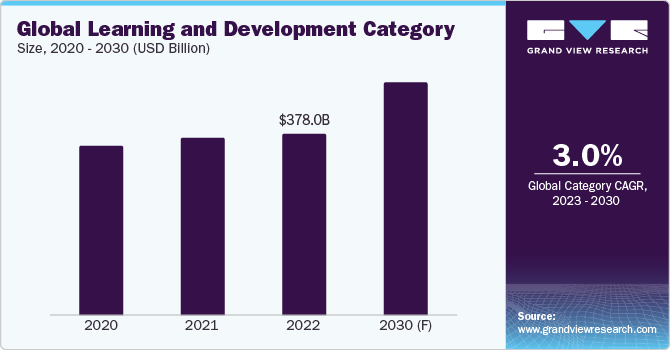
The global learning and development category is expected to grow at a CAGR of 3% from 2023 to 2030. The learning and development (L&D) services are experiencing a rapid and constant transformation due to trends, such as e-learning, microlearning, and reskilling and upskilling, that have changed organizations’ approach toward employees’ training and development to perform better. From learning at the moment of need approach to integrating virtual and augmented reality to create better employee-centric learning experiences, L&D service providers are focusing on future-ready and impactful learning programs.
Implementing reskilling and upskilling services can help clients bridge skill gaps and acquire new competencies. This approach boosts job satisfaction, fosters individual career growth, and enables organizations to maintain a competitive edge in the business landscape. According to a LinkedIn 2023 report, 89% of L&D professionals believe that developing employee skills enables organizations to drive the future of work better.
The global learning and development category size was valued at USD 378 billion in 2022. The ecosystem of the L&D industry has changed due to automation in the learning process, such as online services and by implementing e-learning and microlearning in providing training to employees.
Generative AI service providers help to develop and deliver personalized, engaging, and efficient L&D experiences. It automates content creation by rapidly generating text, multimedia elements, and images. For instance, it can develop interactive quizzes and create realistic and contextually relevant scenarios, simulations, and case studies. This reduces the burden on instructional designers and boosts course development. It also helps L&D teams save time and deliver quality personalized learning experiences through real-time feedback and intelligent recommendations.
Microlearning continues to be the key trend in the category. The micro-learning approach breaks down significant content into bite-sized learning chunks that are less than 5 minutes long. Through this, L&D teams can deliver focused and accurate information as per clients’ specific needs. Microlearning can also be customized, resulting in better outcomes and higher client engagement by providing them with requirement-specific content.
Additionally, microlearning can be delivered in various formats, such as videos, interactive modules, and podcasts. Besides, employees seek training tailored to individual needs and aspirations, commonly referred to as personalized learning. L&D service providers can leverage a learning management system (LMS) to provide a centralized platform to deliver and track customized content for each team member. A personalized approach can also be delivered through various methods, such as individual coaching sessions and learning algorithms.
L&D service providers also incorporate game-like elements into their learning and development services, known as the gamification approach. This approach involves adding gaming elements, such as badges, leaderboards, challenges and points, into the training content to make the learning more interactive and engaging. According to the SHRM 2022 report, 25% of the employees believe that gamification makes L&D more effective. The ultimate result of the services depends on the combined achievements of individual employee learning journeys. By focusing on employees and optimizing each experience, service providers can improve the effectiveness of their training programs and thereby achieve clients' objectives.
Supplier Intelligence
“What are the characteristics of the learning and development category?”
The global learning and development category is fragmented. Most of the top companies are competing by providing various services, including training and certifications, online courses on team building, leadership, communication skills, and innovative learning methods, to the clients. End-use organizations seek cost-effective, quality-ensured, and creative learning and development services. As a result, service providers are focusing on providing technology-based services such as e-learning, AI, and microlearning-enabled services. Service providers offer engaging and relevant services to meet the client’s requirements. They are also inclined towards providing sessions in different styles, such as in-person training, online courses, and blended teaching solutions.
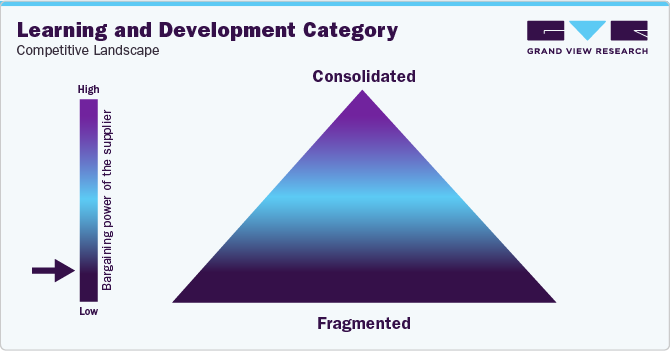
Service providers (suppliers) with skilled trainers, content creators, and technology providers will likely have moderate bargaining power due to multiple options for sourcing content and expertise. However, if a few specialized suppliers have unique offerings, their influence may be more substantial.
Key suppliers covered in the category:
-
Korn Ferry
-
Wildsparq
-
Dale Carnegie
-
FranklinCovey
-
Cognician
-
The Mintable
-
AllenComm
-
360Training
-
Hone
-
Aptimore
Pricing and Cost Intelligence
“What are some of the major cost components in learning and development? How are these components impacting the category?”
Trainers’ salaries, IT costs, facility rental, staff training, marketing and advertising, and others are some cost components in providing L&D services. The trainer’s salary accounts for a significant part of the total cost, as the service providers require a pool of talented people with adequate knowledge, experience, and expertise in the field. The average salary of a L&D trainer in the U.S. can range from USD 50,000 to USD 70,000 per year. The compensation may vary depending on the field's level of experience and expertise. The cost of providing service will be influenced by the materials incorporated into the program. Expenses may arise from printed materials, namely handouts, manuals, or workbooks.
Additionally, integrating technologies, such as software, hardware, or specialized equipment, can contribute to an overall cost increase. The location of the training session also plays a vital role in determining the cost of the service. For instance, if the learning sessions are conducted offsite, the service provider has to incur additional travel, accommodation, and meal expenses for the team. However, it is more cost-effective if the service is provided virtually online.
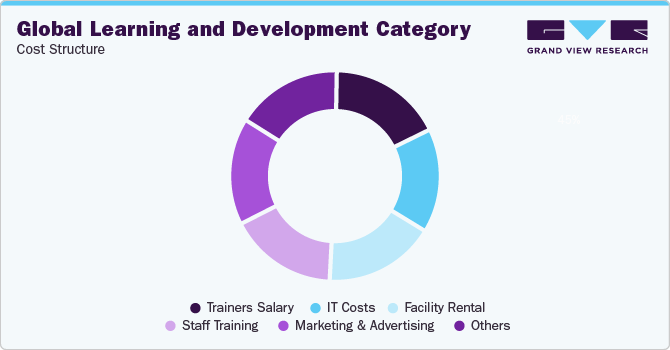
IT costs, such as implementing, maintaining, and licensing online platforms or learning management systems (LMS), can drive the overall cost of services. The service provider can implement an LMS platform to manage and deliver training content if the clients' organization's employees are significantly high. Developing a custom LMS can cost around USD 30,000 to USD 500,000. Similarly, the development cost of an open-source LMS can be around USD 2,000 to USD 30,000. Customization of an on-premises installed or an open-source LMS can cost the service provider around USD 2,000 to USD 20,000. However, the cost can vary based on type, features, development team, and UI/UX design.
The chart below indicates the cost breakdown of developing the LMS platform.
Learning Management System (LMS) Platform Development Cost (2023)
Cost Category
Custom LMS (USD)
On-Premises Installed LMS (USD)
Open-Source LMS (USD)
Development Costs
30,000 - 500,000
-
2,000 - 30,000
Customization Costs
5,000 - 100,000
2,000 - 20,000
2,000 - 20,000
Hosting Costs
1,000 - 10,000/year
500 - 10,000/year
500 - 10,000/year
Training Costs
-
-
-
Support Costs
-
-
-
L&D is expected to witness a high impact on the organization’s workforce. Although there was a slight decrease in the number of L&D leaders’ spending power in 2023 compared to 2022, it still represents an optimistic view over the past seven years. In 2023, around 41% of L&D leaders expect to have more spending power, with global L&D investment expected to be approximately USD 395.2 billion. The investment by the service provider in providing training depends on the client’s budget, type of service required, number of participants, and level of innovation in the service. Rising spending on employees’ L&D by organizations can help service providers offer more advanced and accurate services, satisfying client’s needs.
The report provides a detailed analysis of the learning and development cost structure and the pricing models prominent suppliers adopt in this category.
Sourcing Intelligence
“What are some of the preferred target destinations for learning and development service providers?”
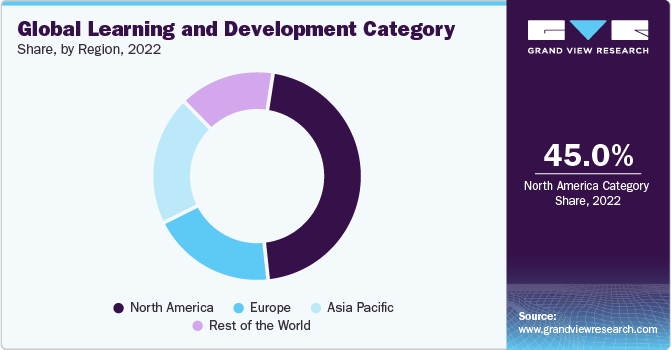
The North American region dominated the L&D industry, accounting for around 45% of the market share in 2022. According to the U.S. Bureau of Labor Statistics 2022 report, 83% of HR managers believe training employees is beneficial to attracting talent, and 86% of HR managers think training employees to retain talent is beneficial. At the same time, around 76% of the employees in the U.S. are likely to stay in a company that offers continuous L&D.
The prevalent training methods in the U.S. involved instructor-led classrooms and a blended approach that combined instructor-led sessions with technology integration. The growing need for skilled workers, driven by a rise in the number of companies, is expected to boost demand for L&D service providers through reskilling/upskilling existing employees.
The U.S., China, India, and Japan stand out as nations with highly skilled workforces and a significant concentration of corporate offices, making them lucrative targets for L&D service providers. These countries, owing to their substantial force and technological hub, are making significant investments in the training and development of employees. For instance, the U.S. witnessed a noteworthy increase of USD 200 million in corporate training expenditure in 2023 compared to the previous year.
In 2023, small U.S. companies with employee counts ranging from 100 to 999 allocated approximately USD 1,420 per learner, while large companies with over 10,000 employees assigned around USD 481 per learner for training. Conversely, the Government of India has established a dedicated department, the Ministry of Skill Development and Entrepreneurship, to enhance the workforce's skill sets. This ministry creates a robust technical and vocational training framework to instill new skills in the country's workforce. It holds the responsibility of coordinating all skill development programs throughout India.
On the other hand, category service providers could also target developing countries such as Switzerland, Luxembourg, and Sweden, which are witnessing an increasing number of IT offices, corporate culture, and demand for reskilling and upskilling existing workforce. Such a rising market for workforce development is anticipated to drive service growth in these countries.
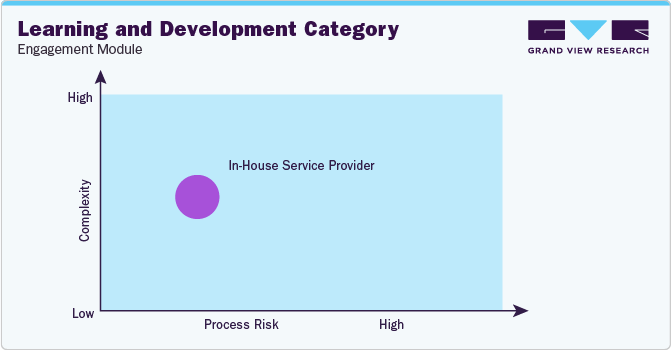
“In this model, the supplier carries out all operations in-house.”
Regarding learning and development service sourcing intelligence, L&D service providers have dedicated internal teams proficiently overseeing the diverse facets of their offerings. This includes adept handling of instructional design, content creation, training delivery, and technology development. These internal teams comprise subject matter experts, instructional designers, trainers, and other seasoned professionals specializing in the L&D. Their wealth of expertise enables them to navigate challenges and setbacks seamlessly. Moreover, maintaining an in-house team proves to be a financially prudent approach for service providers, sparing them the need to recruit external experts, trainers, and developers for each project.
Buyers of the category, such as large corporations and organizations, evaluate service providers based on the service provided and their expertise in the field. Buyers also seek service providers offering personalized learning services, end-to-end services, and objective-oriented solutions. They also take into consideration the technology used by the service providers, the time taken to provide answers and years of experience.
The report also details day one, quick wins, portfolio analysis, key negotiation strategies of critical suppliers, and low-cost/best-cost sourcing analysis.
Learning and Development Procurement Intelligence Report Scope
Report Attribute
Details
Learning and Development Category Growth Rate
CAGR of 3.0% from 2023 to 2030
Base Year for Estimation
2022
Pricing Growth Outlook
5% - 7% (Annually)
Pricing Models
Service-based pricing, competition-based pricing
Supplier Selection Scope
Cost and pricing, past engagements, productivity, geographical presence
Supplier Selection Criteria
Services provided, end-to-end services, project timeline, customization, technology used, global reach, regulatory compliance, operational capabilities, quality measures, certifications, data privacy regulations, and others
Report Coverage
Revenue forecast, supplier ranking, supplier positioning matrix, emerging technology, pricing models, cost structure, competitive landscape, growth factors, trends, engagement, and operating model
Key Companies Profile
Korn Ferry, Wildsparq, Dale Carnegie, FranklinCovey, Cognician, The Mintable, AllenComm, 360Training, Hone, Aptimore
Regional Scope
Global
Historical Datadata
2020 - 2021
Revenue Forecast in 2030
USD 478.9 billion
Quantitative Units
Revenue in USD billion and CAGR from 2023 to 2030
Customization Scope
Up to 48 hours of customization free with every report.
Pricing and Purchase Options
Avail customized purchase options to meet your exact research needs. Explore purchase options
Frequently Asked Questions About This Report
b. The global learning and development category size was valued at approximately USD 378 billion in 2022 and is estimated to witness a CAGR of 3% from 2023 to 2030.
b. The increasing pace of technological advancements such as e-learning, microlearning, and generative AI and the need for upskilling in the rapidly evolving job market are driving the demand for learning and development services.
b. The U.S., China, India, and Japan are the ideal destinations for providing learning and development services.
b. This category is fragmented, with numerous players differentiating by their services, customization, and personalized solutions. Some of the key players are Korn Ferry, Wildsparq, Dale Carnegie, FranklinCovey, Cognician, The Mintable, AllenComm, 360Training, Hone, and Aptimore.
b. Trainers’ salary, IT costs, facility rental, staff training, marketing and advertising, and others are some of the key cost components of this category.
b. When acquiring learning and development services, businesses assess suppliers' capacity to provide diverse learning solutions, customization capabilities, industry-specific expertise, technology infrastructure for delivery, and the ability to offer comprehensive end-to-end services. Additional factors considered include the speed of problem-solving, the company's reputation and industry experience, data transparency practices, and adherence to rigorous standards and guidelines.
Share this report with your colleague or friend.
GET A FREE SAMPLE
This FREE sample includes market data points, ranging from trend analyses to market estimates & forecasts. See for yourself...
Add-on Services
Should Cost Analysis
Component wise cost break down for better negotiation for the client, highlights the key cost drivers in the market with future price fluctuation for different materials (e.g.: steel, aluminum, etc.) used in the production process
Rate Benchmarking
Offering cost transparency for different products / services procured by the client. A typical report involves 2-3 case scenarios helping clients to select the best suited engagement with the supplier
Salary Benchmarking
Determining and forecasting salaries for specific skill set labor to make decision on outsourcing vs in-house.
Supplier Newsletter
A typical newsletter study by capturing latest information for specific suppliers related to: M&As, technological innovations, expansion, litigations, bankruptcy etc.
![gvr icn]()
NEED A CUSTOM REPORT?
We can customize every report - free of charge - including purchasing stand-alone sections or country-level reports, as well as offer affordable discounts for start-ups & universities.
Contact us now to get our best pricing.
![esomar icon]()
ESOMAR certified & member
![ISO]()
ISO Certified
We are GDPR and CCPA compliant! Your transaction & personal information is safe and secure. For more details, please read our privacy policy.
We are committed towards customer satisfaction, and quality service.
Client Testimonials

"The quality of research they have done for us has been excellent..."
ISO Certified


