- Home
- »
- Reports
- »
-
Meetings and Events Procurement Intelligence Report, 2030
![Meetings and Events Procurement Intelligence Report, 2030]()
Meetings and Events Procurement Intelligence Report, 2024 - 2030 (Revenue Forecast, Supplier Ranking & Matrix, Emerging Technologies, Pricing Models, Cost Structure, Engagement & Operating Model, Competitive Landscape)
- Published Date: Apr, 2024
- Base Year for Estimate: 2022
- Report ID: GVR-P-10583
- Format: Electronic (PDF)
- Historical Data: 2020 - 2021
- Number of Pages: 60
Meetings and Events - Procurement Trends
“Increasing emphasis on networking and collaboration, and corporate expansion is driving the growth of the market.”
The procurement of meetings and events services is gaining momentum as businesses are looking for networking opportunities, collaboration, and experiential marketing strategies. The market is expected to grow at a CAGR of 4.1% from 2024 to 2030. The industry is changing in terms of bringing people together, either for personal or business purposes. Trends like the growth of in-person gatherings, virtual discussions, and venue selection to improve attendees' experience are fueling the growth. According to the Nunify Tech 2023 report, around 65% of the companies globally reported an increase in spending on the meetings industry. As digitization accelerates, companies are embracing and utilizing cutting-edge technologies such as AI, virtual reality, gamification, QR codes, and event diagramming, driving development in the sector.
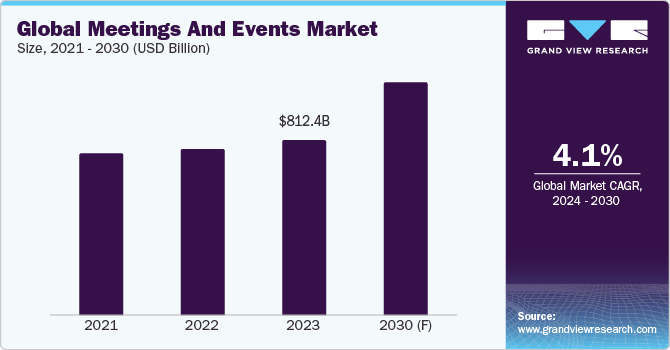
The global meetings and events market size was estimated at USD 812.4 billion in 2023. Nowadays, planners are focusing on making gatherings more dynamic and engaging. As attendees want control over the meeting agenda, vendors/planners are focusing on personalizing the gatherings as per the attendees’ or clients' needs. In-person gatherings are expanding, with 34% higher in-person attendance witnessed in 2023 as compared to 2022, according to the CVENT 2023 report. In-person gatherings help companies connect with the audience and build relationships better. According to the CVENT 2024 report, 86% of the corporate programs currently are conducted in-person as attendees, and many companies believe face-to-face discussions and conferences play a vital role in achieving business goals. This has also resulted in the balance between hybrid and in-person gatherings. According to a survey conducted by vFairs in2023, 88.1% of the respondents (or, companies) have hosted at least 1 virtual event. As a result, this is driving the focus more towards in-person gatherings compared to virtual meetings.
The growing generative AI tools like ChatGPT can help the organizers/planners automate time-consuming tasks such as drafting invitation mail and suggesting gathering themes. It can help category specialists brainstorm ideas, create a compelling keynote speaker introduction, and perform various other tasks. Additionally, AI chatbots can help the attendees to ask questions about the events and receive responses immediately.
The role of mobile applications has transformed from a supplementary feature to an essential tool in ensuring the success of events. There is a notable shift towards leveraging these applications to create more personalized, interactive, and engaging experiences for attendees. Key features like customized agendas, real-time updates, notifications, and integrated networking opportunities in calendars contribute significantly to elevating the overall experience and boosting attendee satisfaction.
Supplier Intelligence
“How is the nature of meetings and events market? Who are the key players?”
This industry is fragmented, due to the issue arising from the Standardized Industrial Code (SIC). The event industry consists of various codes such as code 82301, assigned to ‘activities of exhibition organizers’, and code 56210, assigned to ‘event catering activities. As a result, various businesses relying on and working in this segment do not meet the specified SIC Codes. Due to this mismatch of SIC codes, many businesses/companies are registered with other industries. For instance, AV and production, marketing services, etc., are effectively considered in other industries. Hence, there is no distinct standard for this sector.
It is common for businesses to use events as a secondary source of income, as there is too much overlap. Furthermore, this industry encompasses diverse sub-categories, including conferences and meetings, exhibitions and trade fairs, incentive travel, and corporate outdoor gatherings, among others. All these factors contribute to the fragmentation of the market.
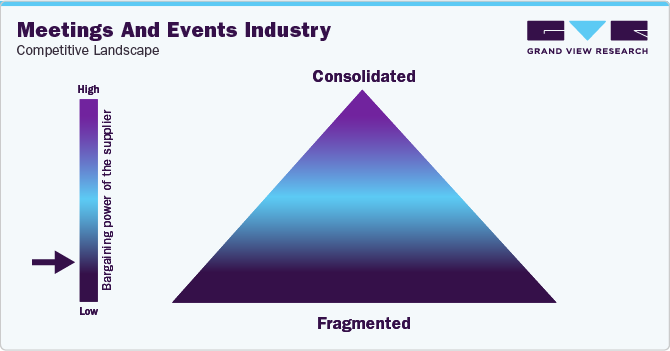
Buyers in this sector include large corporations, organizations, government agencies, and individuals planning any kind of gatherings. The bargaining power of buyers can vary based on factors such as the size of the gathering, the reputation of the planner, and the availability of alternative options. Buyers with large-scale programs or repeat business may have more negotiating power, especially if they can offer better revenue to planners.Collaborating with suppliers during the procurement of meetings and events services is crucial for fostering strong business relationships.
Key service providers in the industry:
-
CWT M&E
-
ATPI Ltd.
-
Informa PLC
-
BCD Travel Services B.V.
-
Cvent Inc.
-
Flight Centre Travel Group Limited
-
Creative Group Inc.
-
360 Destination Group
-
Bizzabo
-
Nunify Tech Inc.
-
Event Solutions
Pricing and Cost Intelligence
“What is the total cost structure associated with meetings and events services? What are the pricing models adopted by the event planning companies?”
Procurement of meetings and events often includes discussions about prices and costs related to different goods, equipment, or services. These discussions help organizations understand market value, negotiate better deals, and manage their budgets effectively. Staff salaries, venue costs, travel and accommodation, and marketing and advertising are among the costs incurred in providing these services. Other costs include IT costs, food and beverage costs, printing branded elements (signage, banners, etc.), and staff training costs. The venue cost for the meeting space can be from USD 950 to USD 1,250 per hour. Similarly, the cost of food and beverages can range between USD 125 to USD 200 per person per day. The overall cost is usually divided into fixed costs and variable costs. For in-person and hybrid gatherings, fixed costs usually include venue, speaker, marketing, and AV equipment, among others. Variable costs comprise accommodation, catering, and others. While organizing the in-person event, the most common expenses incurred by suppliers are food and beverage, audiovisual, decor and labor, staff travel, marketing or promotion, and space rental. Food and beverages account for around 35% - 40% of the total expenses. Audiovisual and décor/labor consist of 10% and 16% expenses, respectively.
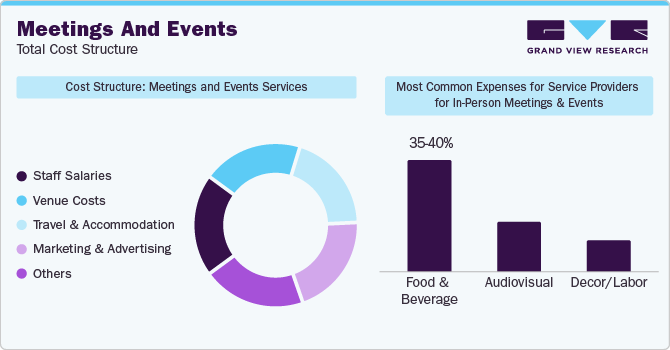
Vendors or companies in this planning sector usually adopt a cost-plus pricing model. Under this model, the selling price is established by adding markup to the overall variable costs. This model is often used by meeting management companies to make a profit from the markup of variable costs of the gatherings. As a result, a single pricing model cannot address the diverse needs of various events, which require different resources and skill sets. Therefore, alternative models such as fixed or hourly pricing are also considered.
The following table indicates an example of a company planning to budget for an in-person event for a single weekend, on-site at a hotel. Approximate event budgets are depicted below in USD in 2023.
Expenses - Example of a Company Planning To Budget for an In-Person Event for a Single Weekend, On-Site at a Hotel (USD)
Variable Expenses
500 People
(USD)
750 People
(USD)
1,000 People
(USD)
Event App
4,000
4,000
5,000
Event Staff
8,000
12,000
16,000
Hotel Rooms (USD per person)
100,000
150,000
200,000
Catering (USD per person)
175,000
262,500
350,000
Total
Additional information upon subscription
Fixed Expenses
Price (USD)
Event Registration/Ticketing Website
2,500
Event Registration/Ticketing Website Design
4,500
Event Marketing
15,000
Mobile Event App Design and Build
4,500
Venue Rental
Additional information upon subscription
Venue Design
Speaker Fees
Total
Organizing an in-person gathering with 500 to 1,000 attendees can consist of some fixed and variable expenses. For instance, in this above-mentioned scenario, hotel rooms for 500 - 1,000 people can range between USD 100,000 - USD 200,000. Similarly, catering expenses can range between USD 262,500 - USD 350,000 for 750 - 1,000 people. Event marketing can cost around USD 15,000. The rates can vary based on the number of attendees, the scale of the occasion, the venue, and other factors.
Sourcing Intelligence
“What are the best sourcing strategies followed by clients? Which countries can be the ideal target destinations for the service providers?”
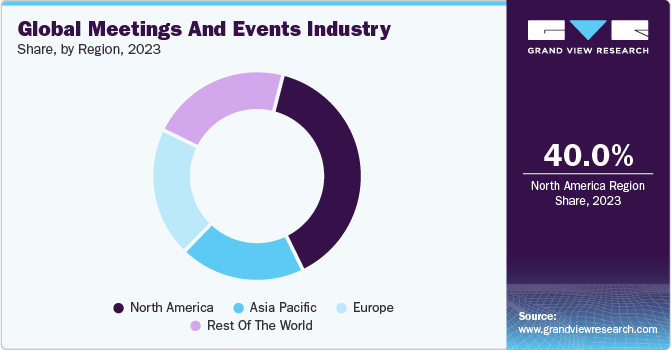
North America and Europe are the major regions that dominated the industry in 2023. The event industry in North America has experienced growth as a result of the growing popularity of cities such as Florida, Nevada, and Texas as desirable destinations. According to Meetings & Incentives Worldwide Inc. 2023 report, the industry in the U.S. generated USD 100 billion in travel spending in 2022. International Congress and Convention Association 2023 report states that the U.S. emerged as the top country for association gatherings in 2022, hosting 24% more meetings than Spain, which ranked second. As of August 2023, the U.S. was increasingly the most dominant market for trade shows and conferences with 81% of trade shows more than the U.K.
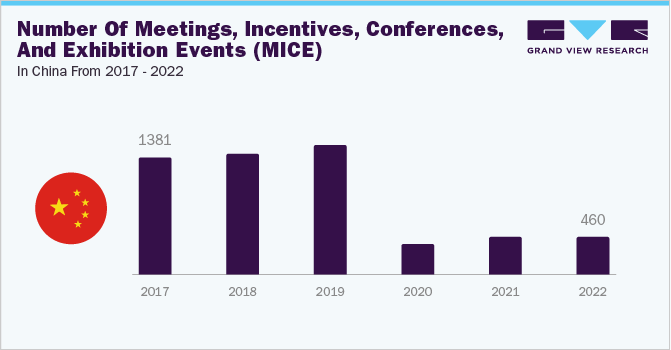
China, India, and Brazil are emerging as prominent destinations for meetings services. The industry in these countries is experiencing growth fueled by rising disposable incomes, urbanization, and a growing interest in experiential events. Additionally, the increasing popularity of corporate gatherings, trade shows, and technology conferences, particularly in China and India, is further propelling this segment's expansion. China is witnessing unprecedented growth in its business travel sector, emerging as the fastest-expanding market globally. At the same time, the nation's infrastructure catering to event professionals is undergoing significant development.
India, on the other hand, is expected to boost its presence in the global MICE (Meetings, Incentives, Conferences, and Exhibitions) sector, organized an industry roundtable in November 2023. The Ministry of Tourism and Government of India organized an event where CEOs and senior leaders from different industries assembled to discuss India's potential as a world-class destination for MICE. The discussions and deliberations were aimed at exploring the opportunities to promote India as a preferred destination for multiple gatherings.
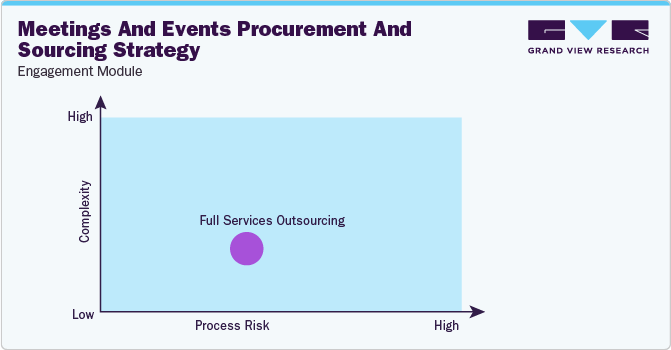
“In the full services outsourcing model, the clients outsource the complete operation/manufacturing to single or multiple companies.”
In terms of meetings and events sourcing and procurement intelligence, more and more corporations and organizations are outsourcing their meeting services to professional organizers specializing in planning and gatherings. Outsourcing the services offers the latest meeting technologies such as advanced audiovisual technologies and can increase attendance. Some clients also utilize solutions provided by the service providers for annual meetings and other gatherings. For instance, Morningstar employs Cvent’s comprehensive Event Marketing and Management solution to strategize and advertise their yearly worldwide Morningstar Investment Conferences. As part of their procurement strategies, these companies seek providers with end-to-end solutions, with the latest technologies and attendees and gatherings management solutions.
The report also provides details regarding day one, quick wins, portfolio analysis, key negotiation strategies of key suppliers, and low-cost/best-cost sourcing analysis. In the report, we have tried to provide a holistic industry perspective, an overview of the supplier landscape - the presence of different types of players and the competitive pressure within the industry as a whole (PORTER’s). Service providers must invest in proper venue and use of advanced technology in the event for a better audience experience. As a result, technology is a significant cost component. Similarly, the supply chain practices under sourcing are also covered. One such instance is the engagement model which encompasses all the business processes conducted within an organization. It is an integral aspect of the company's operations and plays a crucial role in its success.
Meetings and Events Procurement Intelligence Report Scope
Report Attribute
Details
Meetings and Events Market Growth Rate
CAGR of 4.1% from 2024 to 2030
Base Year for Estimation
2023
Pricing Growth Outlook
6% - 7% (increase (Annually)
Pricing Models
Cost plus pricing, fixed pricing, hourly pricing, competition-based pricing
Supplier Selection Scope
Cost and pricing, past engagements, productivity, geographical presence
Supplier Selection Criteria
Types of events, end-to-end solutions, virtual & hybrid solutions, attendee and catering management, experience, time taken to design an event, geographical presence, operational capabilities, and others
Report Coverage
Revenue forecast, supplier ranking, supplier matrix, emerging technology, pricing models, cost structure, competitive landscape, growth factors, trends, engagement, and operating model
Key Companies Profiled
CWT M&E; ATPI Ltd.; Informa PLC; BCD Travel Services B.V.; Cvent Inc.; Flight Centre Travel Group Limited; Creative Group Inc.; 360 Destination Group; Bizzabo; Nunify Tech Inc.; Event Solutions
Regional Scope
Global
Revenue Forecast in 2030
USD 1,076.3 billion
Historical Data
2021 - 2022
Quantitative Units
Revenue in USD billion and CAGR from 2024 to 2030
Customization Scope
Up to 48 hours of customization free with every report.
Pricing and Purchase Options
Avail customized purchase options to meet your exact research needs. Explore purchase options
Frequently Asked Questions About This Report
b. The global meetings and events market size was valued at approximately USD 812.4 billion in 2023 and is estimated to witness a CAGR of 4.1% from 2024 to 2030.
b. The need for networking opportunities, business collaborations, and experiential marketing strategies in various industries is transforming the meeting and event industry. Additionally, the rise of virtual and hybrid event formats in response to global circumstances is driving the growth of this industry.
b. According to the LCC/BCC analysis, China, India, and Brazil are some of the ideal emerging countries that can be targeted for meetings and event services.
b. This industry is fragmented with the presence of numerous players. Some of the key players are CWT M&E, ATPI Ltd., Informa PLC, BCD Travel Services B.V., Cvent Inc., Flight Centre Travel Group Limited, Creative Group Inc., 360 Destination Group, Bizzabo, Nunify Tech Inc., and Event Solutions.
b. Staff salaries, venue costs, travel and accommodation, and marketing and advertising are some of the key cost components in the meetings and events industry. The other costs include IT costs, food and beverage costs, printing branded elements, and staff training costs.
b. Large organizations, as part of their procurement strategy, often look for events service providers that offer end-to-end solutions. They consider factors such as the types of events the provider has experience with, whether they offer virtual and hybrid solutions, and their ability to manage attendees and catering. Additionally, expertise in the field, efficiency in designing events, geographical presence, and operational capabilities are also taken into account.
Share this report with your colleague or friend.
GET A FREE SAMPLE
This FREE sample includes market data points, ranging from trend analyses to market estimates & forecasts. See for yourself...
Add-on Services
Should Cost Analysis
Component wise cost break down for better negotiation for the client, highlights the key cost drivers in the market with future price fluctuation for different materials (e.g.: steel, aluminum, etc.) used in the production process
Rate Benchmarking
Offering cost transparency for different products / services procured by the client. A typical report involves 2-3 case scenarios helping clients to select the best suited engagement with the supplier
Salary Benchmarking
Determining and forecasting salaries for specific skill set labor to make decision on outsourcing vs in-house.
Supplier Newsletter
A typical newsletter study by capturing latest information for specific suppliers related to: M&As, technological innovations, expansion, litigations, bankruptcy etc.
![gvr icn]()
NEED A CUSTOM REPORT?
We can customize every report - free of charge - including purchasing stand-alone sections or country-level reports, as well as offer affordable discounts for start-ups & universities.
Contact us now to get our best pricing.
![esomar icon]()
ESOMAR certified & member
![ISO]()
ISO Certified
We are GDPR and CCPA compliant! Your transaction & personal information is safe and secure. For more details, please read our privacy policy.
We are committed towards customer satisfaction, and quality service.
Client Testimonials

"The quality of research they have done for us has been excellent..."
ISO Certified


