- Home
- »
- Reports
- »
-
Translation Services Sourcing & Cost Intelligence Report, 2030
![Translation Services Sourcing & Cost Intelligence Report, 2030]()
Translation Services Procurement Intelligence Report, 2023 - 2030 (Revenue Forecast, Supplier Ranking & Matrix, Emerging Technologies, Pricing Models, Cost Structure, Engagement & Operating Model, Competitive Landscape)
- Published Date: Feb, 2024
- Base Year for Estimate: 2022
- Report ID: GVR-P-10574
- Format: Electronic (PDF)
- Historical Data: 2020 - 2021
- Number of Pages: 60
Translation Services Category Overview
“Technological advancements combined with increased globalization and e-learning are driving this category’s growth.”
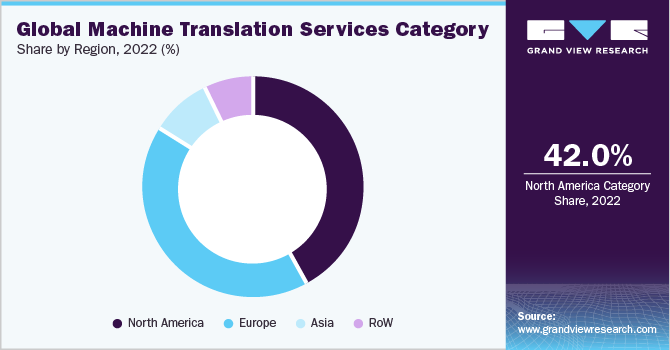
The translation services category is expected to grow at a CAGR of 4% from 2023 to 2030. The need for these services is only growing due to increased globalization and interconnectedness. There is a greater demand than ever for precise and trustworthy interpretations for business, vacation, or personal communications. Growth in the e-learning segment is further aiding category expansion as people are constantly trying to develop new skills. The category can be classified into two heads - machine translation (MT) and human-assisted translations. Machine translation has become increasingly prevalent with the development of artificial intelligence (AI), natural language processing (NLP), and computer power. There are five main types of machine translation, namely, Hybrid Machine Translation (HMT), Rule-based Machine Translation (RBMT), Statistical Machine Translation (SMT), Example-Based Machine Translation (EBMT), and Neural Machine Translation (NMT). Out of these, SMT dominated the MT services segment, accounting for between 65% - 73% of the total share in 2022.
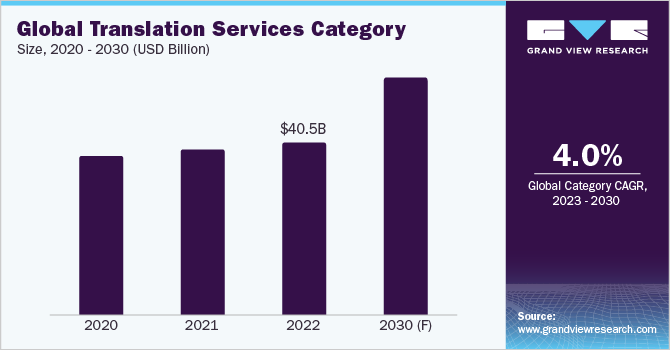
The global translation services category was estimated at USD 40.5 billion in 2022. Leading companies such as Google, Amazon, and Microsoft continue using advanced analytics, and ML algorithms to enhance their MT platform capabilities. There is an increasing preference for hybrid MT-QE systems. The use cases of the quality estimation (QE) algorithm will increase significantly to train NMT engines for complex fields such as law and pharmaceuticals. A survey conducted in 2020 found that following the pandemic, the demand for medical translation services increased by almost 49%. The telehealth and medical interpretation sectors saw robust and steady demand in 2022 as accurate patient translations enabled medical professionals to obtain accurate information.
According to translators, in 2023, utilizing translation software helped in increasing their productivity by at least 30% - 40%. MT helps companies reduce their translation costs by 80% - 90% that arise from irrelevant email communication, human mistakes, and time spent on updating and searching databases. To maximize global sales potential, companies are considering translating their websites into the languages of the top four economies, namely, the U.S., China, Japan, and Germany. By doing so, companies can potentially access up to 50% - 80% of worldwide sales. Local or native language interpretations thus play a very important role, from a brand connection perspective. According to Webinar Care, in 2023, 86% of localized or regional mobile advertisements performed better than their English counterparts. Click-through rates and conversion rates also increased by 42% and 22% respectively.
Supplier Intelligence
“What is the nature of the translation services category? Who are some of the leading players?”
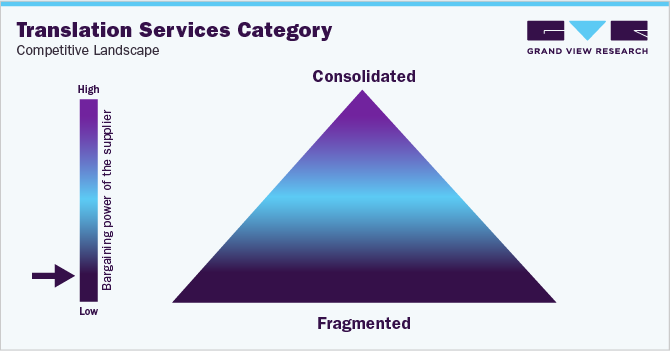
The global translation services category is highly fragmented. The supplier landscape consists of different types of players such as website, interpretation, machine, and/or audio/video translation. The translators operate in three markets-regional, local, and global. According to industry experts, with the presence of so many varied players, there will be a lack of consolidation, especially in the language and translation industry as the category is ever-growing and very large. The sector would continue to rely heavily on human translators despite quickly evolving and improved technology, which would make economies of scale-and hence consolidation-more difficult. All such factors reduce the bargaining power of the suppliers.
In this category, the local markets are much more adaptable and flexible concerning small-scale tasks owing to more direct interactions with the clients. In terms of service requirements, the local market is much more fragmented and accessible. This creates an environment where translators themselves, rather than clients or agencies, can have more control over the process of providing services. In such cases, the bargaining power of buyers is high.
The translation industry is uncontrolled and unregulated to a large extent. Most interpretation/linguist services can be provided without any state body controlling the service. The only exception is in Finland, where the authorized linguist services are supervised by the Finnish National Agency for Education. Services are controlled by a strict licensing system based on exams or specific documented training. Similarly, certain standards such as ISO 17000 or ISO18587 obligate ISO service providers only while a range of vendors can act otherwise freely.
Key suppliers covered in the category:
-
TransPerfect Global, Inc.
-
Lionbridge Technologies, Inc.
-
LanguageLine Solutions (Teleperformance SE)
-
Semantix
-
Welocalize, Inc.
-
Lingotek, Inc.
-
Yamagata Corporation
-
RWS Group
-
Argos Translations Sp. z o.o.
-
Keywords Studios Plc
Pricing and Cost Intelligence
“What is the total cost associated with providing translation services? What are the main elements influencing the cost?”
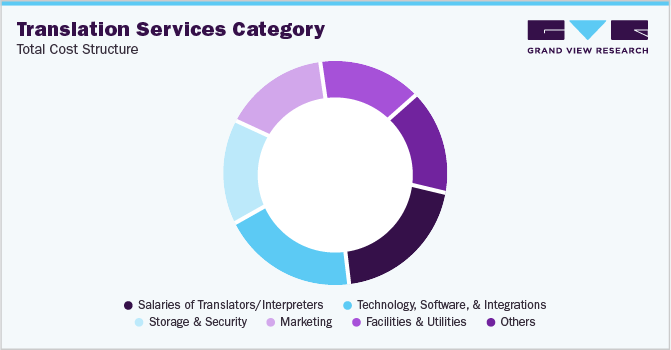
The total cost of translation services can include key components such as the salaries of different translators or interpreters, technology, software and integrations, storage and security, marketing, facilities, and utilities. Salaries of translators and technology form the largest cost components in this category. Professional translation will normally range between USD 0.09 and USD 0.35 per source word as of 2023. As a result, the price of a professional or competent interpretation for a document with 10,000 words might differ significantly, from USD 900 to USD 3,500. In the translation industry, the language pairs, the type of industry and project, the number of pages, the duration of the project, and the type of content are a few variables that can impact the total cost significantly. For instance, the cost of translating more complicated papers or projects that need specialized knowledge, such as legal or medical interpretation, can be much higher, often reaching USD 0.50 per word or more.
Then, for language pairs, the cost of a translation using a common language combination will be lower than that of a translation using a rare or unique combination. For example, Chinese, Japanese, and Arabic can be expensive to translate due to the presence of a high number of characters, time-consuming effort, and a limited pool of qualified translators. In China, there are four main languages-Mandarin, Wu, Cantonese, and Min. Similarly, in Japan, factors such as context-heavy content, the presence of honorifics, significant grammar, and sentence structures make it difficult even for technologically improved machines. With all such complexities, MT may result in meaningless or unusable text, which further adds to the difficulty. As a result, the total cost of service increases.
The total cost structure associated with this service is shown in the chart below:
Some of the highest-paying interpretation languages in 2022 were German, French, Arabic, Dutch, and Chinese. German is closely associated with the business world, especially in the financial sector. Hence translators earn good money in this language. For instance, in 2022, in the U.S., the average annual income of a German translator was around USD 50,000 - USD 60,000 annually compared to the UK, where the average income (for the German translator) is around USD 43,000 - USD 45,000 annually. French translators, in the U.S., on average in 2022, earned around USD 19.5 - USD 22 per hour depending on projects. In the U.S., there is a high demand for Arabic-to-English translation, and as a result, interpreters or linguists can earn USD 20 - USD 25 per hour.
The price of category services is determined using a variety of methods. The usual methods involve evaluating the number of pages, words (or volume), or hours. But sometimes these models may not be able to encompass the full range of work. Some of the other prevalent pricing models include tiered and competitive pricing. MT helps vendors largely reduce the overall costs as traditional translation will be always more expensive than machines. For instance, as of 2023, for a small batch of content, traditional translation charges can range between USD 1,500 to USD 3,000 per 10,000 words. On the other hand, MT, for a similar batch, can range between USD 0.10 to USD 0.20 per 10,000 characters.
The report provides a detailed analysis of the cost structure and the pricing models adopted by prominent suppliers in this category.
Sourcing Intelligence
“What kind of strategies are considered in this category?”
It has been observed that before 2019, most large end-user corporations outsourced their translation of big international marketing materials to advertising agencies instead of directly selecting pure-play language/linguist service providers. This was due to the widespread misperception of translation being a “faithful language transfer process” that forbids content modification. However, over the last few years, with the advent of technological advancements, organizations have started to engage with more translation agencies and use hybrid outsourcing as their preferred engagement model. These professional agencies use the latest software and have the (target language) native translators/linguists who help companies reach a wider market. Additionally, these specialized companies possess the knowledge to align the translation with the vocabulary, tone, and style of the source material, ensuring that the intended message is conveyed accurately. Hence, localization helps increase sales, create more brand-loyal customers, and drive better brand integrity. For instance, RWS Group is a specialized company that can provide interpretations across 260+ languages with high accuracy.
Businesses today are looking beyond their borders to grow, and translation services have been a major partner in achieving this goal. According to a 2022 study, more than 65% of consumers (online buyers) want to engage with brands that have content in consumer’s native or local languages. The major tasks chosen for outsourcing include documents, marketing articles, websites, and entertainment media.
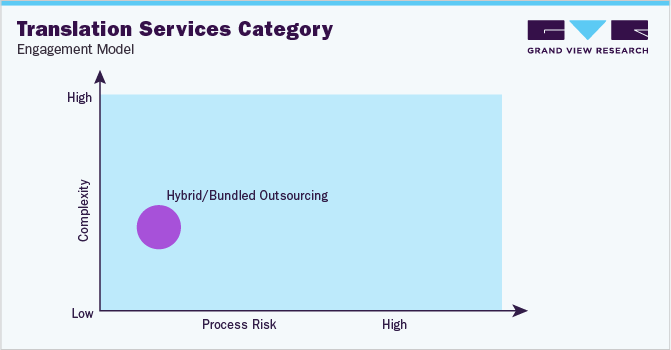
“In the hybrid outsourcing model, the client outsources some parts of the overall operation to third parties. Generally, critical operations are carried out in-house by the client.”
Under translation services sourcing intelligence, Singapore, Netherlands, Denmark, Sweden, the U.S., the UK, China, and India are the most preferred countries. India's economic expansion and steady social advancement demonstrate the country's importance to the language & interpretation sector. One of the industries in India that has grown the quickest is translation, as more businesses want to establish themselves in this country. India is regarded as the second-largest English-speaking nation after the U.S. as of 2022. India is recognized for its linguistic diversity and variation, which necessitates hiring translators for enterprise. The availability of cheap labor further adds to its advantage. For instance, in India, translators’ salaries, on average, are around USD 150 - USD 500 monthly compared to the U.S., where it is around USD 3,600 - USD 5,000 monthly as of November 2023.
There are more than 30,000 vendors in this category worldwide. Hence decisions regarding vendors/agency selection become very important. During selection, it is essential to evaluate suppliers based on the recent technologies or software used for interpretations, whether the supplier is financially secure before entering into long-term contracts, accredited and certified (such as ISO 9001 or ISO 17100 certification for professional translation services), whether the agencies have relevant regional office locations, native-speaking translators (of the target language), and details or case studies on industry specialization, and client references for the end-user companies.
The report also provides details regarding day one, quick wins, portfolio analysis, key negotiation strategies of key suppliers, and low-cost/best-cost sourcing analysis.
Translation Services Procurement Intelligence Report Scope
Report Attribute
Details
Translation Services Category Growth Rate
CAGR of 4% from 2023 to 2030
Base Year for Estimation
2022
Pricing Growth Outlook
10% - 15% (Annually)
Pricing Models
Volume (words)-based, hourly rate, cost plus, and competitive pricing model
Supplier Selection Scope
Cost and pricing, past engagements, productivity, geographical presence
Supplier Selection Criteria
Localization and types of translation services, AI or proprietary platforms, marketing or legal translation, e-learning translation, software localization services, DTP and other services, operational capabilities, quality measures, certifications, data privacy regulations, and others
Report Coverage
Revenue forecast, supplier ranking, supplier positioning matrix, emerging technology, pricing models, cost structure, competitive landscape, growth factors, trends, engagement, and operating model
Key Companies Profiled
TransPerfect Global, Inc., Lionbridge Technologies, Inc., LanguageLine Solutions (Teleperformance SE), Semantix, Welocalize, Inc., Lingotek, Inc., Yamagata Corporation, RWS Group, Argos Translations Sp. z o.o., and Keywords Studios Plc
Regional Scope
Global
Revenue Forecast in 2030
USD 55.4 billion
Historical Data
2020 - 2021
Quantitative Units
Revenue in USD million and CAGR from 2023 to 2030
Customization Scope
Up to 48 hours of customization free with every report.
Pricing and Purchase Options
Avail customized purchase options to meet your exact research needs. Explore purchase options
Frequently Asked Questions About This Report
b. The translation services category is highly fragmented. Some of the leading players include TransPerfect Global, Inc., Lionbridge Technologies, Inc., LanguageLine Solutions (Teleperformance SE), Semantix, Welocalize, Inc., Lingotek, Inc., Yamagata Corporation, RWS Group, Argos Translations Sp. z o.o., and Keywords Studios Plc.
b. The key components are the salaries of different translators or interpreters, technology, software and integrations, storage and security, marketing, facilities, and utilities. Salaries of translators and technology form the largest cost components in this category.
b. During selection, it is essential to evaluate suppliers based on the recent technologies or software used for translations, whether the supplier is financially secure before entering into long-term contracts, accredited and certified (such as ISO 9001 or ISO 17100 certification for professional translation services), whether the agencies have relevant regional office locations, native-speaking translators (of the target language), and details or case studies on industry specialization, and client references for the end-user companies.
b. The global translation services category size was valued at USD 40.5 billion in 2022 and is estimated to witness a CAGR of 4% from 2023 to 2030.
b. Increased globalization and interconnectedness, greater demand than ever for precise and trustworthy translations for business, vacation, or personal communications and the growth in the e-learning segment are some of the factors driving growth.
b. Some of the prevalent pricing models are based on volume (words), hourly rates, number of pages, tiered, and competitive pricing. Per word and per hour are the two most frequent pricing structures used in this industry.
Share this report with your colleague or friend.
GET A FREE SAMPLE
This FREE sample includes market data points, ranging from trend analyses to market estimates & forecasts. See for yourself...
Add-on Services
Should Cost Analysis
Component wise cost break down for better negotiation for the client, highlights the key cost drivers in the market with future price fluctuation for different materials (e.g.: steel, aluminum, etc.) used in the production process
Rate Benchmarking
Offering cost transparency for different products / services procured by the client. A typical report involves 2-3 case scenarios helping clients to select the best suited engagement with the supplier
Salary Benchmarking
Determining and forecasting salaries for specific skill set labor to make decision on outsourcing vs in-house.
Supplier Newsletter
A typical newsletter study by capturing latest information for specific suppliers related to: M&As, technological innovations, expansion, litigations, bankruptcy etc.
![gvr icn]()
NEED A CUSTOM REPORT?
We can customize every report - free of charge - including purchasing stand-alone sections or country-level reports, as well as offer affordable discounts for start-ups & universities.
Contact us now to get our best pricing.
![esomar icon]()
ESOMAR certified & member
![ISO]()
ISO Certified
We are GDPR and CCPA compliant! Your transaction & personal information is safe and secure. For more details, please read our privacy policy.
We are committed towards customer satisfaction, and quality service.
Client Testimonials

"The quality of research they have done for us has been excellent..."
ISO Certified


