- Home
- »
- Reports
- »
-
Waste Management Procurement Intelligence Report, 2030
![Waste Management Procurement Intelligence Report, 2030]()
Waste Management Procurement Intelligence Report, 2023 - 2030 (Revenue Forecast, Supplier Ranking & Matrix, Emerging Technologies, Pricing Models, Cost Structure, Engagement & Operating Model, Competitive Landscape)
- Published Date: Jan, 2024
- Base Year for Estimate: 2022
- Report ID: GVR-P-10572
- Format: Electronic (PDF)
- Historical Data: 2020 - 2021
- Number of Pages: 60
Waste Management Category Overview
“Stringent government regulations on waste disposal are fueling the category’s growth.”
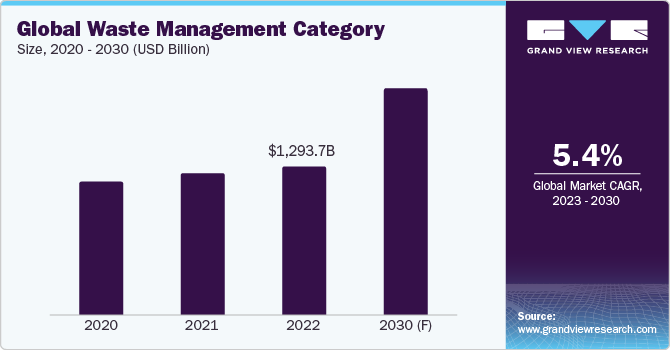
The global waste management category is anticipated to grow at a CAGR of 5.4% from 2023 to 2030. Factors that influence the growth include stringent government regulations for effective management of waste, rising global population, increased commercialization and industrialization, continuous development in urban & rural transportation, and rise in e-waste due to technological advancements. Waste production tends to grow with urbanization due to higher consumption of packaging materials. Consequently, there's a greater demand for the services offered in the category. In addition, technological advancements have increased the effectiveness of waste management practices thereby reducing their harmful environmental impact. However, the absence of necessary infrastructure for waste collection and separation can hinder the category’s growth.
With the increase in construction projects across the globe, urban localities are utilizing more materials for construction and demolition.In certain places, much of the waste stream from these construction / demolition activities gets illegally deposited on land or in naturally occurring drainage systems, including water, thus, violating the regulations meant to protect public health, industry, and environment.In addition,businesses and residents are disposing of millions of tons of building waste each year in solid waste disposal. This is being supplemented by the development of smart cities to promote sustainable economic growth. The quantity of waste produced by buildings is significantly influenced by macroeconomic variables, which encompassessocietal consumption habits, and risks (both man-made and natural). All these factors are anticipated to fuel the growth of the global category, with the requirement of effective and efficient waste management services.
The global waste management category was estimated at USD 1,293.7 billion in 2022. With a market share of more than 61.9%, the collection segment dominated the industry. Waste collection involves sorting and packing waste, choosing an appropriate location, preparing it for waste storage at a minimum distance from the point of generation, and maintaining the waste. The garbage collection providers need to take care of regular cleaning and maintenance of these storage places. Appropriate precautions are required to prevent garbage from spilling or leaking during transportation. For instance, during transit, the liquid waste must be sealed and kept leak-free. In addition, both hazardous and non-hazardous waste need to be delivered straight to the recycling facility. However, transportation of hazardous waste must only be carried out in vehicles that meet safety regulations. During the projection period, the disposal segment is predicted to grow at the highest CAGR of 5.9%.
Technologies that are driving the category’s growth include artificial intelligence (AI), robotics, internet of things (IoT), big data & analytics, blockchain, and advanced recycling. Waste management is a multi-step activity that includes planning for sorting, pickup, and trucking. The process is laborious because of the large amount of garbage that needs to be handled. Workflows, getting integrated with AI turns the operations more efficient and automates the process of waste management. AI-enabled autonomous garbage collection vehicles can prevent driver injuries. Tracking of waste bins in real-time can be made possible with IoT-based waste management. It enables dumpsters to get filled without being overflowed, allowing for prompt waste collection and disposal. IoT-based temperature sensors monitor dumpster temperatures to avoid fires and explosions.
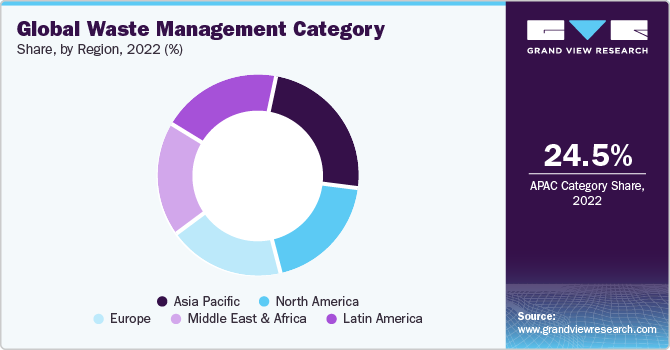
Asia Pacific dominates the global category, holding 24.5% of the global revenue share. The region is rapidly becoming more urbanized with millions of people relocating to cities every year. This trend has led to increased production of garbage in metropolitan areas and is putting pressure on the trash management infrastructure and services. In addition, changing consumption patterns and the rising middle-class population in various countries have led to many waste categories, including packaging waste, construction debris, and electronic waste (e-waste).There's a good chance that government programs like the Swachh Bharat Mission (India) and the zero waste plans of various nations will increase public knowledge of trash management. It is therefore expected to positively affect the regional market’s growth.Furthermore, few nations in the region are investing in technologies to generate energy using waste, with an objective to address the issue of waste management and generate clean energy.
Supplier Intelligence
“What best describes the nature of the waste management category? Who are some of the main participants?”
The global waste management category exhibits a moderately consolidated landscape with the presence of a few large players dominating the space. Large market participants offer services for garbage collection, transportation, and disposal and are vertically integrated across the supply chain. Due to the optimization of operating costs and growth in profit margins, these enterprises are able to capture a sizeable portion of the market. The category is extremely competitive with numerous players being focused on developing cutting-edge technologies to recycle and reuse the garbage produced across numerous industries and households. Key players are implementing a range of business expansion tactics to increase their footprint both locally and internationally, such as product portfolio expansions, distribution network expansions, and mergers & acquisitions.
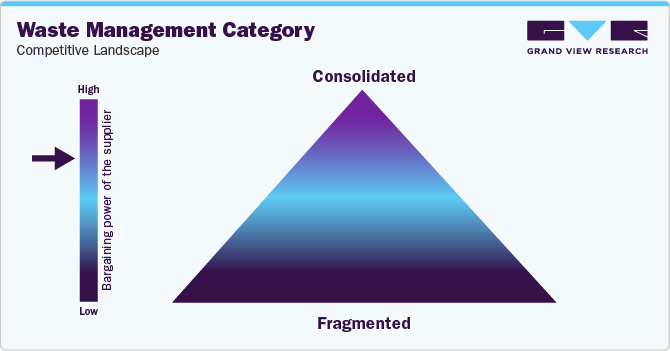
Buyers in the industry possess high negotiating power since there are few switching costs, plenty of substitutes, and few differences between the service providers. If consumers are dissatisfied with the services of one player, they can simply switch to a rival. As a result, the service providers stay under constant pressure to retain their clients by offering premium services at reasonable prices. In addition, buyers find it simpler to move to a more economical choice when alternatives such as nearby landfills and other waste management services are readily available. Furthermore, large customers like governments, commercial companies, and industrial enterprises have even more negotiating strength since they produce a lot of garbage, and they can get better terms and lower pricing.
Key suppliers covered in the category:
-
Biffa Ltd.
-
Clean Harbors, Inc.
-
Covanta Holding Corporation
-
Daiseki Co., Ltd.
-
FCC Environmental
-
Hitachi Zosen Corporation
-
Remondis SE & Co. KG
-
Republic Services
-
Stericycle, Inc.
-
SUEZ SA
-
Valicor Environmental Services
-
Veolia Environnement SA
-
Waste Connections, Inc.
-
Waste Management, Inc.
Pricing and Cost Intelligence
“What is the cost structure for waste management? What variables affect the prices?”
The cost structure of the global waste management category is constituted by machinery & equipment, labor, rent & utilities, logistics, and maintenance & repair, and other costs. Other costs can be further divided into administrative expenses, depreciation, repayment of loans, insurance, and regulatory certifications. Management of solid waste is represented by a net cost which can be reduced by optimizing processes and implementing suitable recycling.
The variables that contribute to the waste management services for commercial facilities include the location of waste disposal area of a business enterprise, volume of the waste generated by a business, nature of the waste (hazardous / non-hazardous), frequency of the waste collection, cost of the container, cost of the collection, cost of transfer, and cost of landfill. The charge for collection of waste with a volume between 19 and 64 gallons, with pickups occurring once a week, ranges between USD 29.9 to USD 59.9 whereas waste with a volume of over 89 gallons with five days a week pickup would be charged between USD 71.9 to USD 499.
Companies operating in the industry employ one of many price structures. A fixed fee-for-service model is a popular pricing structure that ensures a service provider will get the approved amount of money specified in the contract and have a predetermined pricing for the services stated. Weight-based / volume-based pricing is another important pricing structure wherein consumers are charged according to the weight or volume of waste that has to be processed or recycled.
The cost structure is broken down in the accompanying chart. Other costs can depend on multiple cost components, which have been illustrated below:
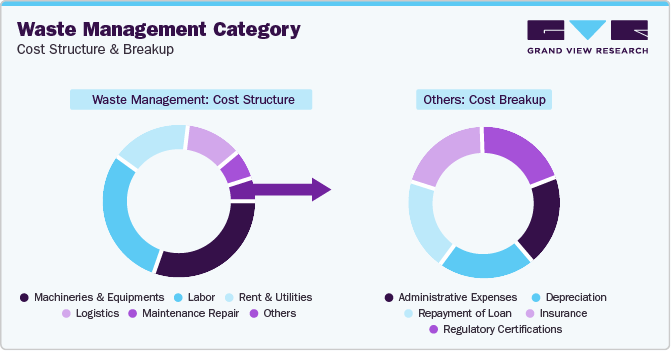
The report provides a detailed analysis of the cost structure and the pricing models adopted by prominent suppliers in this category.
Sourcing Intelligence
“How do waste management providers engage? What is the type of engagement model?”
In terms of sourcing intelligence for the global waste management category, buyers of these services typically follow a full services outsourcing model to engage with their service providers. They outsource the entire waste management operation rather than handling it in-house. Relying on a third-party waste management service provider has several advantages; the key among them is their ability to provide an extensive array of services to suit diverse business demands. They can offer a full range of services irrespective of the amount and frequency of garbage. In addition, they cover grab lorries, refuse bins, trade waste bins, and sized skips to mention a few examples. They can also modify the services they offer as a business scales up or down.
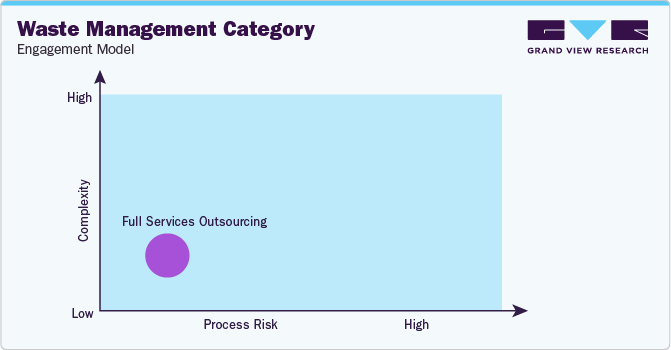
“In the full services outsourcing model, the client outsources the complete operation/manufacturing to single or multiple companies.”
Outsourcing supports business enterprises (buyers) in effective disposal of their wastes. Majority of the service providers aim to recycle over 89.9% of all waste that is collected, thus, the environmental impact of the waste generated by a business enterprise is significantly decreased. This is made possible by their specialized recycling facilities, which effectively filter garbage into appropriate recycling categories. Business enterprises, particularly those handling hazardous wastes such as solvents, low-level radioactive materials, pesticides, batteries, and asbestos always prefer to outsource their waste management as hazardous material management and disposal needs to be adhered to regulations and done safely and effectively. Waste specialists assist in making sure that this is done by alleviating the burden and eliminating the dangers associated with managing hazardous waste, from identification through collection and treatment, by utilizing the newest technologies in their hazardous waste facilities.
India is the preferred low-cost / best-cost country for sourcing waste management solutions. A large amount of waste is sent from wealthy countries to developing countries because of cheaper export costs rather than recycling locally within the nation. In 2022, a few of the wealthy nations based out of Europe and some Asia nations such as the Philippines (an unexpected addition with over 79,950 tons of garbage export) and Japan were among the largest exporters of plastic garbage. To combat the effects of an overreliance on plastics, commonly referred to as the "sachet economy," the nation frequently associated with plastic land and sea pollution has turned to exports. Businesses that offer cutting-edge machinery, inventive technologies, and economical waste management systems and solutions, particularly for waste sorting, recycling batteries, plastic, tires, and e-waste, construction waste management, landfill design and technology, and waste-to-energy solutions will have plenty of opportunities in India.
The report also provides details regarding day one, quick wins, portfolio analysis, key negotiation strategies of key suppliers, and low-cost/best-cost sourcing analysis.
Waste Management Category Procurement Intelligence Report Scope
Report Attribute
Details
Waste Management Category Growth Rate
CAGR of 5.4% from 2023 to 2030
Base Year for Estimation
2022
Pricing Growth Outlook
5% - 10% increase (Annually)
Pricing Models
Fixed pricing, weight-based / volume-based pricing
Supplier Selection Scope
Cost and pricing, past engagements, productivity, geographical presence
Supplier Selection Criteria
Industries served, certifications, employee strength, geographic service provision years in service, industrial waste management, municipal waste management, medical waste management, e-waste management, and others
Report Coverage
Revenue forecast, supplier ranking, supplier matrix, emerging technology, pricing models, cost structure, competitive landscape, growth factors, trends, engagement, and operating model
Key Companies Profiled
Biffa Ltd., Clean Harbors, Inc., Covanta Holding Corporation, Daiseki Co., Ltd., FCC Environmental, Hitachi Zosen Corporation, Remondis SE & Co. KG, Republic Services, Stericycle, Inc., SUEZ SA, Valicor Environmental Services, Veolia Environnement SA, Waste Connections, Inc., and Waste Management, Inc.
Regional Scope
Global
Revenue Forecast in 2030
USD 1,970.4 billion
Historical Data
2020 - 2021
Quantitative Units
Revenue in USD billion and CAGR from 2023 to 2030
Customization Scope
Up to 48 hours of customization free with every report.
Pricing and Purchase Options
Avail customized purchase options to meet your exact research needs. Explore purchase options
Frequently Asked Questions About This Report
b. The global waste management category size was valued at approximately USD 1,293.7 billion in 2022 and is estimated to witness a CAGR of 5.4% from 2023 to 2030.
b. Stringent government regulations for effective management of waste, rising population across the globe, increased commercialization and industrialization activities, continuous development in urban & rural transportation, and rise in e-waste due to technological advancements. are driving the growth of the category.
b. According to the LCC/BCC sourcing analysis, India and Germany are the ideal destinations for sourcing waste management.
b. This category is moderately consolidated with high level of competition. Some of the key players are Biffa Ltd., Clean Harbors, Inc., Covanta Holding Corporation, Daiseki Co., Ltd., FCC Environmental, Hitachi Zosen Corporation, Remondis SE & Co. KG, Republic Services, Stericycle, Inc., SUEZ SA, Valicor Environmental Services, Veolia Environnement SA, Waste Connections, Inc., and Waste Management, Inc.
b. Machineries & equipment, labor, rent & utilities, logistics, and maintenance & repair, and other costs are the major cost components of Waste Management category. Other costs can be further bifurcated into administrative expenses, depreciation, repayment of loan, insurance, and regulatory certifications.
b. Reviewing the transparency and environmental credentials of the service provider, assessing the service quality and customer support of the service provider, searching a reliable service provider based on reviews by other customers, and comparing the prices offered by different service providers are some of the best sourcing practices considered in this category.
Share this report with your colleague or friend.
GET A FREE SAMPLE
This FREE sample includes market data points, ranging from trend analyses to market estimates & forecasts. See for yourself...
Add-on Services
Should Cost Analysis
Component wise cost break down for better negotiation for the client, highlights the key cost drivers in the market with future price fluctuation for different materials (e.g.: steel, aluminum, etc.) used in the production process
Rate Benchmarking
Offering cost transparency for different products / services procured by the client. A typical report involves 2-3 case scenarios helping clients to select the best suited engagement with the supplier
Salary Benchmarking
Determining and forecasting salaries for specific skill set labor to make decision on outsourcing vs in-house.
Supplier Newsletter
A typical newsletter study by capturing latest information for specific suppliers related to: M&As, technological innovations, expansion, litigations, bankruptcy etc.
![gvr icn]()
NEED A CUSTOM REPORT?
We can customize every report - free of charge - including purchasing stand-alone sections or country-level reports, as well as offer affordable discounts for start-ups & universities.
Contact us now to get our best pricing.
![esomar icon]()
ESOMAR certified & member
![ISO]()
ISO Certified
We are GDPR and CCPA compliant! Your transaction & personal information is safe and secure. For more details, please read our privacy policy.
We are committed towards customer satisfaction, and quality service.
Client Testimonials

"The quality of research they have done for us has been excellent..."
ISO Certified


