
- Home
- »
- Research
- »
-
Chemicals Monthly Pricing Data & Analysis – August 2026
![Chemicals Monthly Price Assessment – August 2026Report]()
Chemicals Monthly Price Assessment – August 2026
Organic Chemicals (Alcohols & Glycols, Amines & Nitrogenous Organics, Aromatics & Olefins, and more), Inorganic Chemicals (Alkalis & Bases, Mineral Acids, Inorganic Salts, and more), and Specialty Chemicals (Oxidants & Persulphates)
Chemicals Pricing Intelligence - Executive Summary
Chemicals pricing intelligence covers organic, inorganic, and specialty chemicals. Chemical markets as a whole recorded mixed but selective movement during August 2026. For instance, in the organic chemicals segment, aromatics & olefins showed the clearest improvement during the latter part of the month. Benzene, which is a crucial feedstock, declined during early August before recovering strongly as supply availability tightened. In addition, maintenance activity, lower import arrivals, reduced port inventories, and interruptions to normal logistics supported several aromatic commodities movements.
Tight benzene availability and maintenance supported related intermediates. However, downstream buyers remained cautious in several markets. The monomers & resin intermediates such as methylene diphenyl diisocyanate (MDI) received support from plant maintenance and higher benzene costs. China’s manufacturing activity also remained below at par in August owing to weakened domestic industrial demand.
Inorganic chemicals remained a bit more stable than the organic segment. Sulphuric acid continued weakening through August, while other mineral acids also followed the same trajectory. Other inorganic groups including halogens fluorochemicals, inorganic salts, alkalis bases, and more also showed mild weakening as the downstream demands tumbles. Specialty chemicals showed narrower movement, reflecting their more application-specific demand profile.
Key Price Developments & Insights
-
Aromatics and selected intermediates recovered after early August weakness. Benzene, Toluene, Phenol, and others strengthened mid-month in China as inventories tightened and maintenance constrained supply. Amid this group, Toluene witnessed a massive surge across China, India, and Europe.
-
Methanol strengthened on tighter availability in China. However, in other geographic regions, including India, Europe, and western countries, local buyers remained on the sidelines, leading to weakened or relatively stable local prices.
-
Among monomers & intermediates, MDI received temporary support from maintenance and rising benzene costs, particularly in China. However, weak local downstream demand restricted sustained pricing gains throughout the month.
-
Inorganic chemicals showed a bit of divergent movement, with the majority of its groups, including mineral acids, inorganic salts, alkalis & bases, and boron & silicon compounds, portraying a restricted or negative trend in August 2026.
-
Regional supply-chain conditions continued to adjust according to the Middle Eastern routing risks. Recently, it was announced that an alternative route to developed which can bypass the conflicting Strait of Hormuz sea route.
Top Performing Chemicals Commodity
-
Top Mover: Toluene
-
Average MoM Growth (top 3 geographies): 37.9%
-
Volatility Level: High

Organic Chemicals – Pricing Trends, August 2026
Organic chemicals recorded mixed movement during August 2026. Benzene, toluene, and selected aromatics recovered strongly as the domestic producers adjusted the price rates. For example, Indian producers of toluene Bharat Petroleum Corporation Limited (BPCL) hiked the prices for the local markets. Similarly, in China’s Shandong region, the prices climbed by nearly 5% on week-over-week basis from 17th August to 24th August 2026. For other groups such as alcohols & glycols, Methanol strengthened during the end of August as Strait of Hormuz and Middle East conflict continues to squeeze normal trade movement. On the consumption side, the staged recovery in August 2026 especially for gasoline additives outmatched the incoming supply, thereby pushing the prices by the end of the month.
Inorganic Chemicals – Pricing Trends, August 2026
Inorganic chemical markets remained slightly stable to weak during August 2026. The sulphuric acid prices in China stayed weak through much of the month. The local copper smelters reported almost USD 8 per ton downgraded prices for the sulphuric acid. Moreover, on the supply side a major local producer announced maintenance of its biggest production lines of from 20th August to next 35 days. Thereby, directly wiping roughly 50,000 tons of sulphuric acid for the short term period. This is likely to push the price movement in the positive direction for the coming next month.
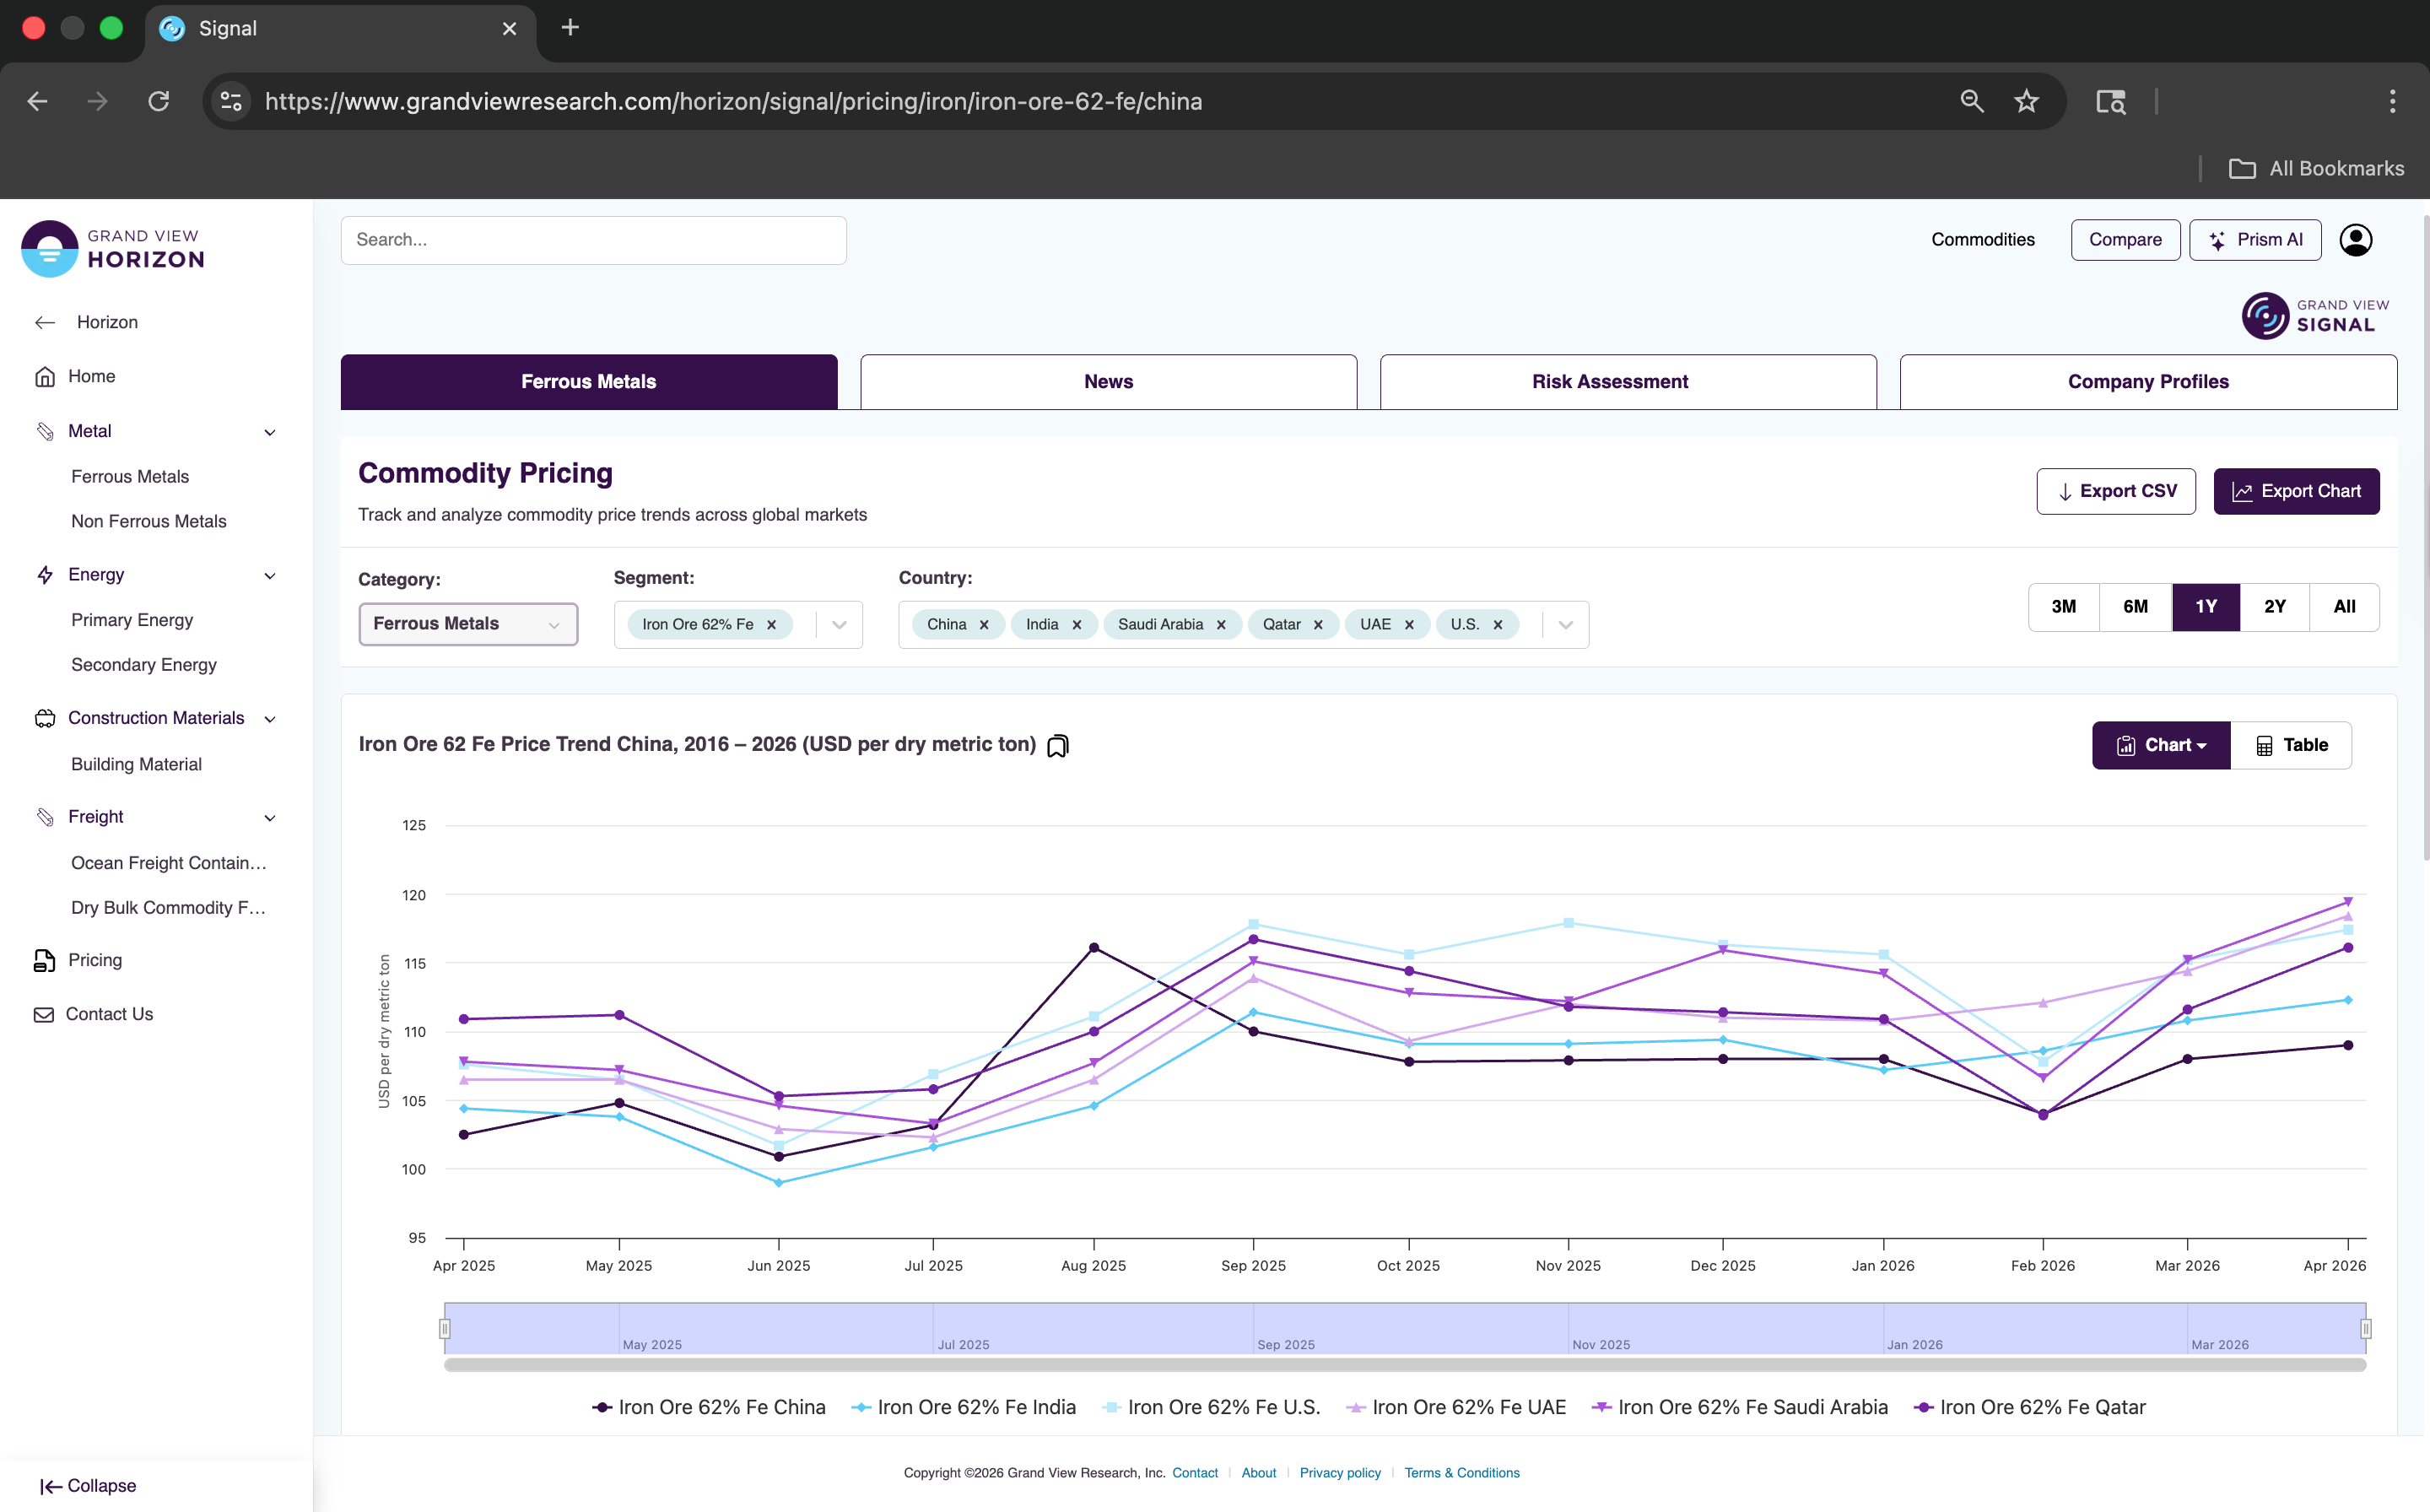
 Pricing Intelligence Platform
- Category & commodity wise real-time price trends and movements
- Latest and impact-making market drivers
- Geographic coverage across key countries
- Impact and Forecasting based on Geopolitical Scenarios.
Specialty Chemicals – Pricing Trends, August 2026
Specialty chemicals remained comparatively stable during August 2026. Sodium hypochlorite, sodium persulfate, and ammonium persulfate moved within relatively narrow ranges as procurement remained linked to immediate requirements from water treatment, disinfection, textiles, and metal-processing applications. These products were less exposed to the stronger feedstock and supply-driven movements seen across major organic chemical chains.
Chemicals Price Direction, By Geography And Chemical Group, September 2026
Geography
Organic
Inorganic
Specialty
China
0.7%
0.3%
0.3%
India
France
Germany
UK
Europe
U.S.
Saudi Arabia
UAE
Qatar
Egypt
Morocco
Chemicals Pricing - Key Drivers
-
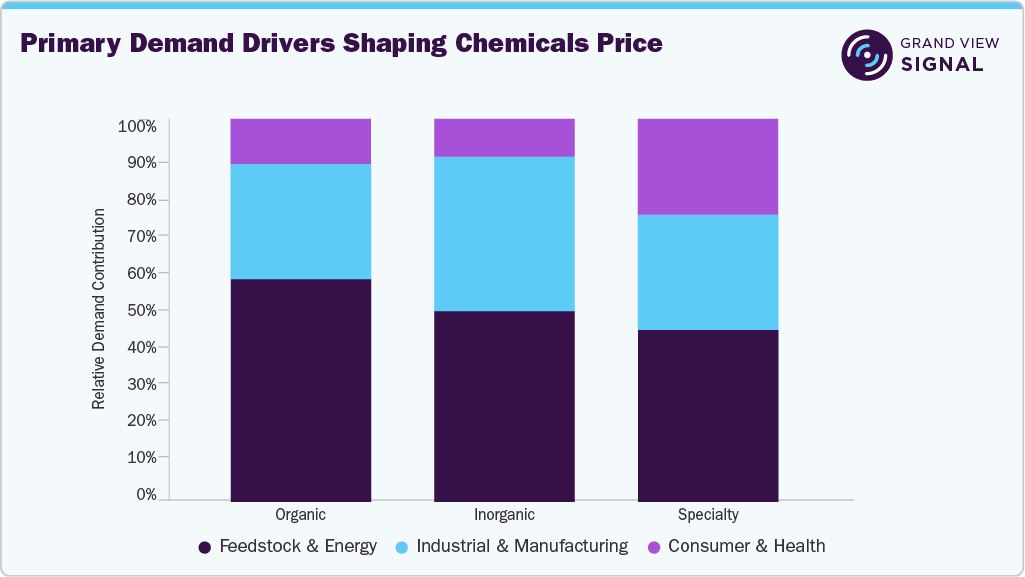
Feedstock volatility and Middle Eastern logistics disruption - Crude oil, naphtha, and other hydrocarbon feedstocks have an important influence on chemical production cost. The Middle Eastern conflict continued to impact vessel movements across the Strait of Hormuz. This indirectly encouraged suppliers and buyers to explore alternative arrangements. In addition, the latest surge in the conflict with US and Iran exchanging blows further weakened the market sentiments for the commodities moving through this sea route. The clear visible impact is more prominent across the organic segment vis-à-vis alcohols & glycols commodities like methanol, ethylene glycol, and others.
-
Chinese plant maintenance - Physical availability became one of the strongest short-term chemical price drivers during August. Many of the organic and inorganic chemical commodities observed plant maintenance events leading to a slight surge in the local Chinese chemical sector. For example, Wanhua Chemical announced to start maintenance drive for its MDI facility located at Yantai industrial park from 10th August 2026. The maintenance operations are projected to continue for 45 days. This facility holds a production capacity of 1.1 million tons per year of MDI. The closure news directly pushed the demand for the product as buyers scrambled to secure supply, thereby directly pushing the prices by the end of August 2026.
-
Tightening availability of methanol - Methanol strengthened because supply contracted faster than demand. Methanol imports and domestic production both declined during parts of August, while port arrivals were severely disrupted by the ongoing Middle Eastern conflict. This tightened inventory supported stronger purchasing interest from the buyers end. In addition, as the conflict became worsened the import volumes dropped sharply thereby, impacting the domestic inventory levels especially for the Asian countries.
Get in-depth driver impact analysis on chemical prices.
Request Free Access
Access Grand View Signal.-
Weak downstream demand and margin pressure - Downstream consumption remained the main restraint on a wider chemicals rally. China’s manufacturing PMI improved slightly during August, increasing by 0.6 points as compared to the previous month. Across products such as MDI and toluene, tighter supply supported prices but downstream users continued purchasing cautiously as the margins remained weak. European chemical producers faced similar limitations, with low-capacity utilization and high operating costs. As a result, August price strength remained concentrated in products facing identifiable physical tightness rather than spreading across the entire chemicals complex.
-
Trade policy, localization, and regional chemical investment - Governments and chemical producers continued focusing on improving regional supply security during August. India advanced investment, chemical-park, and innovation initiatives intended to strengthen domestic chemicals and petrochemicals manufacturing. Egypt continued developing higher-value phosphate-processing and fertilizer capacity around the Suez Canal Economic Zone. Meanwhile, U.S.-Canada trade tensions increased uncertainty for the highly integrated North American chemical supply chain. These developments reinforced the broader shift toward regional production, alternative sourcing, and stronger domestic chemical value chains.
Chemicals - Commodity Coverage
Organic Chemicals
The organic chemicals category covers alcohols and glycols, amines and nitrogenous organics, aromatics and olefins, monomers and resin intermediates, organic acids and anhydrides, plasticizers and phthalates, and solvents, ketones, and esters. During August 2026, pricing was mixed but generally firmer across several important chains. Benzene, methanol and selected downstream intermediates recovered after early weakness as maintenance, inventory tightening and reduced import availability supported physical markets. However, weak downstream margins prevented the improvement from becoming uniform.
Organic Chemicals Pricing - Key influencers
-
Crude oil, naphtha, benzene, propylene, and methanol costs
-
Plant maintenance, operating rates, and inventory availability
-
Import arrivals and regional logistics
-
Demand from plastics, resins, coatings, textiles, and pharmaceuticals
-
Downstream margins and inventory-management decisions
Get historical, current, and forecast organic chemicals price assessments.
Request Free Access
Access Grand View Signal.Inorganic Chemicals
The inorganic chemicals category covers alkalis and bases, halogens and fluorochemicals, industrial minerals and fillers, inorganic salts, mineral acids, and sulfur and carbon products. August conditions remained divided. Mineral acids were comparatively weak as compared to the other groups owing to the slightly low demand levels and precautious government policies to stabilize domestic inventory levels.
Inorganic Chemicals Pricing - Key influencers
-
Sulphur, salt, phosphate rock, fluorspar, energy, and mineral costs
-
Chlor-alkali, acid, and ammonia operating rates
-
Demand from alumina, glass, fertilizers, mining, and water treatment
-
Inventory availability and regional production changes
-
Chemical shipping flows
Get historical, current, and forecast inorganic chemicals price assessments.
Request Free Access
Access Grand View Signal.Specialty Chemicals
The specialty chemicals category covers oxidants & persulphates. This category covers ammonium persulfate, sodium persulfate, sodium hypochlorite, and hydrogen peroxide. Prices remained comparatively stable during August because consumption was primarily connected to specific industrial applications rather than large-volume feedstock trading.
Specialty Chemicals Pricing - Key influencers
-
Water-treatment and disinfection requirements
-
Polymerization and resin-production activity
-
Electronics, textiles, and metal-processing demand
-
Electricity and raw material costs
Get historical, current, and forecast specialty chemicals price assessments.
Request Free Access
Access Grand View Signal.Regional Commentary
China - China’s chemical market recorded mixed but increasingly firm conditions across several organic products during August. Benzene and methanol weakened in the opening part of the month before rebounding strongly during mid-August, supported by tighter availability, plant maintenance schedules, and lower inventories. The overall demand environment remained uneven: manufacturing conditions improved from July but stayed below the expansion threshold, reinforcing the view that much of August’s chemical price strength was caused by product-specific supply conditions rather than broad industrial restocking.
India - India continued focusing on strengthening domestic chemicals and petrochemicals manufacturing during August. Government initiatives highlighted investment in petroleum, chemicals and petrochemical regions, development of new chemical parks and stronger industry-academia cooperation for technology commercialization. These measures are aimed at improving domestic capacity and reducing supply-chain vulnerability over time. For near-term chemical procurement, however, Indian users remained exposed to international feedstock prices, freight conditions, and the availability of imported intermediates, particularly for petrochemical and pharmaceutical supply chains.
Europe - European chemical markets remained constrained by structural competitiveness issues during August. High energy and raw material costs, international competition and low utilization rates continued affecting basic chemicals and petrochemicals. Supply disruption elsewhere provided temporary support to selected European producers and improved demand for some exports, but the broader operating environment remained fragile. The region therefore continued to face a divergence between temporary supply-led opportunities and weak structural competitiveness.
France - France’s chemical sector remained under significant pressure during August. Industrial capacity utilization remained well below the level generally required for sustainable plant economics, while the broader European industry continued losing production capacity and global market share. Petrochemicals were particularly exposed to competition from lower-cost producing regions. These conditions kept French producers focused on competitiveness, energy costs, maintaining strategic production and preserving investment capacity rather than pursuing aggressive output expansion.
Germany - Germany showed one of the clearer improvements in European chemical sentiment during August. Industry assessments indicated a sharp improvement in current business conditions, supported partly by supply disruptions in Asia and the Middle East that increased demand for German chemical products. However, the improvement came from a weak base: chemical production remained substantially below earlier levels and capacity utilization was still low. High gas costs, carbon costs, and structural competitiveness challenges therefore continued to limit the strength of the recovery.
UK - The UK chemical industry entered August with improving activity but continued facing significant cost pressure. The latest industry survey released during the month showed stronger second-quarter sales, exports, and production, with international markets providing most of the improvement. However, energy and raw-material costs continued rising faster than activity for many producers, domestic demand remained softer and companies stayed cautious on hiring and capital investment. This left UK chemical conditions improved but still vulnerable to costs and uneven downstream demand.
Get region-wise chemical price assessment.
Request Free Access
Access Grand View Signal.U.S. - U.S. chemical-market conditions remained influenced by industrial demand, competitive feedstock economics, and growing trade-policy uncertainty. The highly integrated North American supply chain faced additional uncertainty during August after U.S. and Canadian negotiators failed to prevent retaliatory duties. Canada remained an important destination for U.S. chemical exports, making changes in cross-border tariffs relevant to production planning, sourcing, and regional competitiveness. Wider excess capacity in global chemical markets also maintained pressure on producers to protect margins and export outlets.
Saudi Arabia - Saudi Arabia’s chemical and petrochemical supply chains continued operating against a disrupted Middle Eastern logistics environment during August. Security concerns around the Strait of Hormuz encouraged greater use of alternative crude and feedstock routes and increased the importance of Saudi Arabia’s ability to move energy supplies through infrastructure outside the Strait. For chemical producers, maintaining reliable feedstock and export logistics remained important as regional vessel traffic stayed below normal levels.
UAE - The UAE’s logistics role became increasingly important during August as Gulf suppliers sought routes that reduced exposure to the Strait of Hormuz. Fujairah was used as an alternative transfer and loading location for Saudi crude destined for Asian buyers, reinforcing the UAE’s role as a regional energy and feedstock logistics hub. This infrastructure provided additional flexibility to chemical and petrochemical supply chains at a time when normal Gulf shipping remained disrupted.
Egypt - Egypt continued advancing its strategy of moving further downstream in phosphate and chemical processing during August. The government reviewed plans to accelerate development of a phosphate-fertilizer plant in the Suez Canal Economic Zone, with the project intended to increase domestic value addition from mineral resources. This supported the wider development of Egypt’s phosphate, phosphoric-acid, and fertilizer-related chemical value chain rather than simply exporting raw mineral material.
Morocco - Morocco’s chemical industry remained closely linked to its integrated phosphate-processing chain during August. Downstream conversion and export activity remained important, with Moroccan triple superphosphate shipments returning to the U.S. market following temporary trade relief. The development demonstrated continuing demand for Morocco’s value-added phosphate products and reinforced the importance of sulfur, phosphoric-acid processing, fertilizer production, and international shipping conditions to the country’s wider chemicals value chain.
Analyst Commentary
“Chemical markets recorded selectively firmer but highly differentiated movement during August 2026. Organic chemicals showed the clearest improvements, followed by inorganic chemicals which remained more mixed. Europe continued facing high costs and low-capacity utilization, while Middle Eastern logistics remained an important supply-chain influence. Overall, August pricing was driven mainly by product-specific availability, feedstock costs, plant operating rates, inventories, and logistics.”
Senior Chemicals Analyst
Frequently Asked Questions
Toluene emerged as the top-performing chemicals commodity, outperforming its counterparts on the back of stronger order momentum in China.
China, Europe, and India were the primary contributors to toluene price performance.
Toluene prices increased by more than 13% on a MoM basis in China owing to high crude prices and limited spot availability.
Toluene prices in China are in elevated mode with heightened level of volatility amid ongoing demand surges.
![Key questions answered by the report]()
-


Coverage
Data Depth
200
Commodities
Multiple
Geographies
6 Months
Forecast
10 Years
Historic Data
Get Free Newsletter
This free newsletter offers a hint of our pricing commodity coverage encompassing executive summary, drivers, and scope of research.
Get FREE NewsletterWe are committed towards customer satisfaction, and quality service.
"The quality of research they have done for us has been excellent."
