
- Home
- »
- Research
- »
-
Energy Monthly Pricing Data & Analysis – August 2026
![Energy Monthly Price Assessment – August 2026Report]()
Energy Monthly Price Assessment – August 2026
Primary Energy (Coal Products, Fossil Fuels, Nuclear Fuel) and Secondary Energy (Power, Refined Petroleum Products, Secondary Coal Products)
Energy Pricing Intelligence - Executive Summary
Energy markets recorded highly volatile movement during August 2026 as persistent Middle East disruptions, weather-driven power demand, and uneven regional fuel demand pulled prices in different directions. Crude oil remained extremely volatile and finished the month slightly higher amid restricted shipment through Strait of Hormuz trade corridor. Renewed military escalation between the US and Iran at month-end pushed crude sharply higher again, demonstrating that physical shipping risk remained more influential on market sentiments.
Natural gas and LNG remained comparatively tighter. Reduced Qatari LNG availability and historically low European storage levels kept the global gas market sensitive to flexible cargo supply. The European storage injections improved late in the month as Asian cooling demand eased amid heavy rains across China and India.
Coal and related commodities surged in August 2026 owing to the ongoing supply disruptions reported from Australian and Chinese mines. The government crackdown on the coal mines in China further plummeted the operational rates, thereby leading to a surge in prices. Secondary energy markets also remained uneven as electricity demand surged in India amid high humidity and rising cooling needs. The overall electricity demand in the country touched more than 169 billion units in August 2026.
Key Price Developments & Insights
-
Crude oil and natural gas remained volatile amid ongoing conflict in Middle East. Additional OPEC+ supply and weaker demand expectations were offset by persistent Strait of Hormuz disruption and renewed late-month military escalation.
-
OPEC+ approved another production increase for September, completing the rollback of a major layer of voluntary supply cuts and adding to expectations of greater producer availability.
-
Natural gas and LNG remained tight owing to the reduced Qatari outputs. The export volumes plummeted to drastically low levels as military conflict brought the Strait of Hormuz trade route to standstill.
-
Electricity and coal markets received weather-related support, with European heatwaves restricting nuclear and wind generation while Indian coal inventories at several power plants fell to critical levels.
-
Refined petroleum products remained tighter than crude in several markets, as Middle Eastern refinery disruptions, Russian fuel-supply constraints and altered shipping routes redirected diesel trade toward alternative suppliers.
Top Performing Energy Commodity
-
Top Mover: Liquified Natural Gas
-
Average MoM Growth (top 3 geographies): 35.2%
-
Volatility Level: Elevated
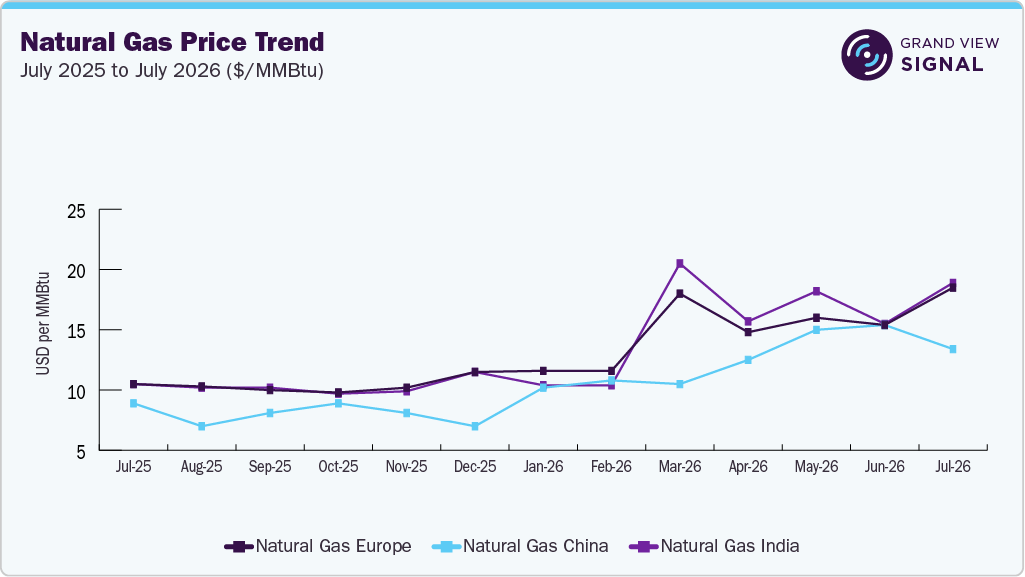
Primary Energy – Pricing Trends, August 2026
Primary energy commodities displayed elevated movement during August. Crude oil moved strongly amid geopolitical conflicts and disrupted trade movement. The September OPEC+ production increase reinforced expectations of greater producer availability. However, disrupted Gulf shipping and renewed U.S.-Iran hostilities prevented a sustained decline and triggered a sharp late-month rebound.
Natural gas prices movement differed highly across different geographies. European price levels reached almost 8 times more expensive than the U.S. domestic levels. The key factor behind this transatlantic gap is high import dependency of the Europe versus overabundance of gas resources in the U.S. Natural gas price movement for the next six months is expected to remain elevated until structural solution of the ongoing Middle East conflict is achieved.
The coal products prices climbed steadily in August across countries including India, China, and others. The Shanxi coal mine incident pushed the Chinese government to crackdown on the safety levels of the domestic coal mines. This led to the closure or diminished operational rates for the local coal mines, thus pushing the domestic price levels.
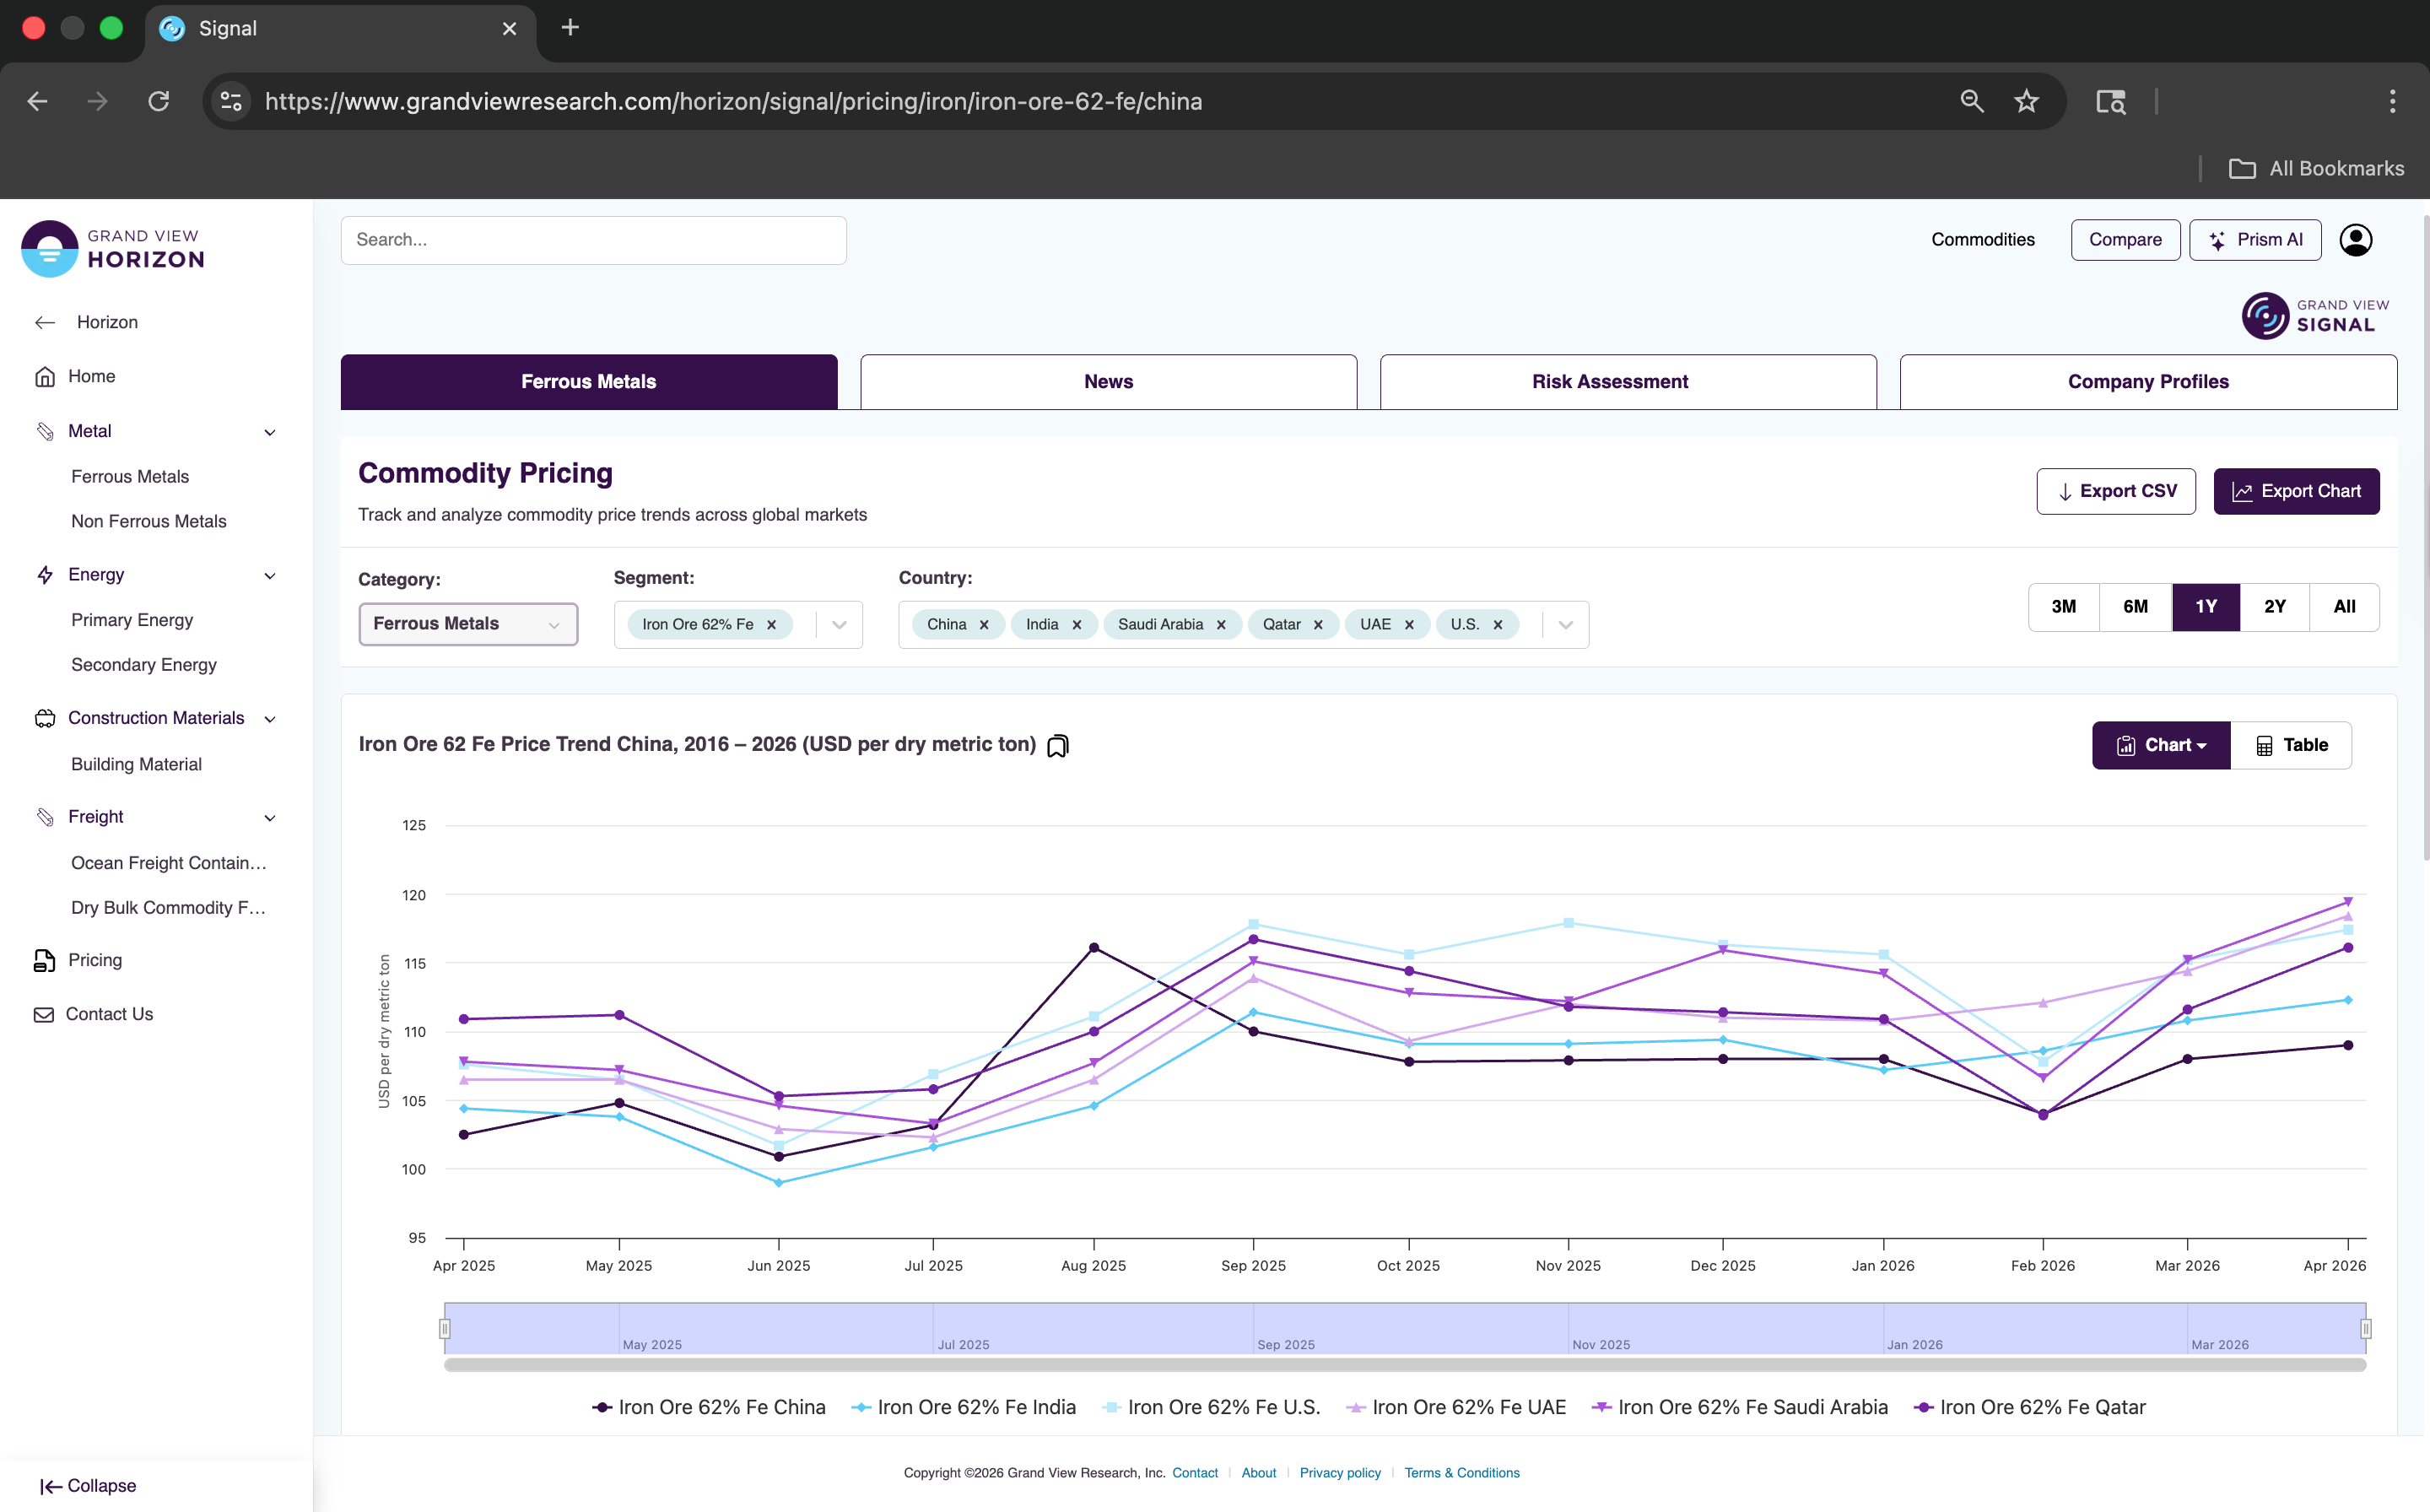
 Pricing Intelligence Platform
- Category & commodity wise real-time price trends and movements
- Latest and impact-making market drivers
- Geographic coverage across key countries
- Impact and Forecasting based on Geopolitical Scenarios.
Secondary Energy – Pricing Trends, August 2026
Secondary energy commodities remained uneven during August. Refined petroleum products did not fully follow the monthly crude direction as restricted liquified natural gas (LNG) tankers movement through Strait of Hormuz took its toll. Asian importers including China slashed its import levels amid soaring price levels. The Asian spot LNG prices during the last week of August touched nearly USD 23 per MMBtu, forcing buyers to slash imports.
Electricity prices remained sensitive to extreme temperatures and generation availability. European heatwaves along with increased cooling demand and reduced French nuclear generation pushed temporary price levels. Indian power demand also remained elevated while coal inventories tightened at numerous thermal plants. Marine fuels continued responding to shipping route risk, voyage length, and bunker availability around major energy-trade corridors.
Energy Price Direction, By Geography And Group, September 2026
Geography
Primary Energy
Secondary Energy
China
1.1%
2.4%
India
Europe
U.S.
Saudi Arabia
UAE
Qatar
Egypt
Morocco
Energy Pricing - Key Drivers
-
Higher producer supply competed with persistent Middle East crude risk - Crude oil remained caught between increasing producer availability and continuing geopolitical disruption during August. OPEC+ approved an additional production increase of roughly 188,000 barrels per day for September, completing the rollback of a major layer of voluntary cuts introduced in 2023. The decision added downward pressure by increasing expected supply at a time when demand indicators, particularly from China, remained relatively weak. However, actual market availability remained constrained by disruptions to Gulf shipping and the continued conflict involving Iran. Transit through the Strait of Hormuz remained below normal. Crude prices therefore weakened during periods of diplomatic optimism but rebounded when military risk increased. The renewed escalation at the end of August showed that route security, export reliability, and insurance conditions remained critical pricing factors.
-
LNG disruption and low European storage sustained gas-market tightness - LNG markets remained more physically constrained than crude oil during August. Qatari LNG exports continued operating far below normal levels because of restrictions and security risks affecting passage through the Strait of Hormuz. This removed a major source of flexible supply from the global market and increased reliance on U.S. and alternative LNG producers. Europe entered August with historically weak seasonal storage coverage, increasing sensitivity to cargo availability ahead of winter. Storage injections accelerated later in the month as Asian cooling demand eased and more LNG became available for Europe, but inventories remained comparatively low. Buyers therefore continued balancing winter-security requirements against elevated procurement costs.
Get in-depth driver impact analysis on energy prices.
Request Access
Access Grand View Signal.-
Extreme heat tightened electricity supply and increased dispatchable fuel demand - Weather remained an important power-market driver during August. A severe European heatwave increased air-conditioning demand while simultaneously restricting electricity supply. High river temperatures and low water levels forced reductions in French nuclear generation, while weak wind output reduced renewable availability in Germany. Day-ahead electricity prices consequently rose sharply during the most stressed periods. Similar pressure emerged in India, where high cooling requirements coincided with tighter coal availability at thermal plants. Renewable generation continued expanding and helped reduce fossil-fuel consumption during favorable conditions, but grid operators still required gas, coal, hydro and nuclear capacity for periods of low renewable output and peak demand. August therefore demonstrated that rapid renewable growth does not eliminate short-term sensitivity to weather, dispatchable generation and fuel inventories.
-
Coal retained strategic support as utilities managed fuel-security risk - Coal remained important for power-system reliability during August despite continued renewable expansion. India experienced one of the clearest examples, as heavy rainfall disrupted coal mining and railway movement while elevated electricity demand reduced inventories at power plants. By late August, dozens of coal-fired facilities were operating with critically low stocks, increasing pressure on generators and fuel logistics. Elsewhere in Asia and Europe, high gas and LNG prices encouraged continued availability of coal generation as a hedge against imported-gas risk. The support remained selective rather than globally uniform because strong renewable production reduced coal use during favorable weather periods. Nevertheless, the broader Middle East energy shock reinforced the value utilities placed on diversified generation portfolios and domestically available fuels when international gas and oil supply becomes less dependable.
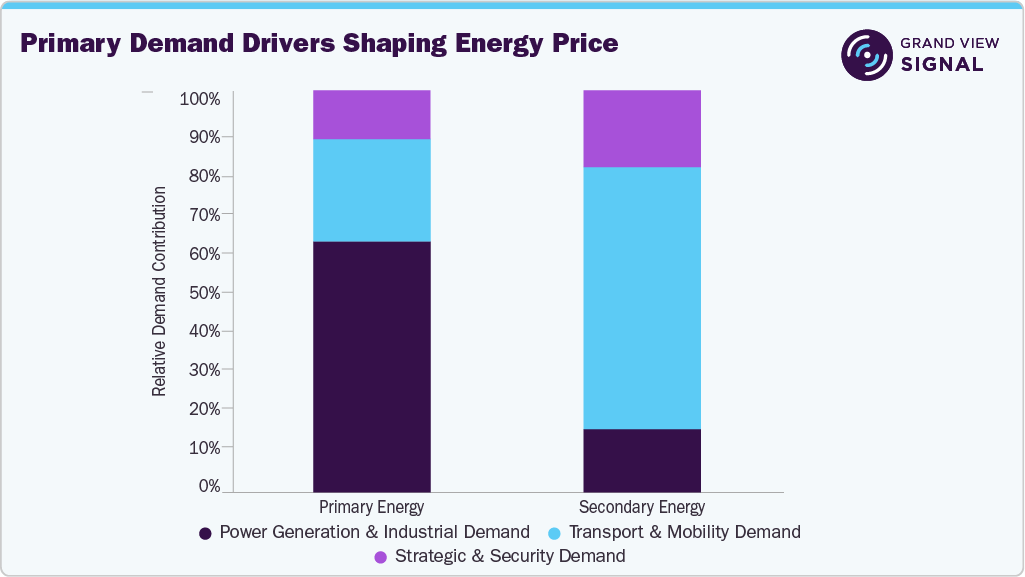
Energy - Commodity Coverage
Primary Energy
Primary energy covers steam coal, coking coal, hard coking coal, low-sulfur coking coal, crude oil, natural gas, and uranium. August conditions reflected continued Middle East supply risk, greater OPEC+ output expectations, restricted LNG availability, and weather-related pressure on coal-fired power generation.
Primary Energy Pricing - Key influencers
-
OPEC+ production policy
-
Strait of Hormuz supply and shipping risk
-
LNG availability and European gas storage
-
Coal inventories and electricity requirements
-
Long-term nuclear fuel security
Get historical, current, and forecast primary energy price assessments.
Request Access
Access Grand View Signal.Secondary Energy
Secondary energy covers electricity, propane, LNG, VLSFO, marine gas oil, and quasi first grade coke. August prices were influenced by refinery availability, summer power demand, changing trade flows, and continued disruption to international shipping routes.
Secondary Energy Pricing - Key influencers
-
Refinery outages and refined-product supply
-
Extreme heat and cooling demand
-
Gas, coal, and renewable generation availability
-
Shipping-route and bunker-fuel requirements
-
Regional fuel inventories
Get historical, current, and forecast secondary energy price assessments.
Request Access
Access Grand View Signal.Regional Commentary
China - China’s energy market remained mixed during August. Manufacturing conditions improved modestly but remained below the expansion threshold. Crude oil demand remained comparatively weak, limiting global demand expectations, while power requirements from advanced manufacturing and digital infrastructure remained high. Continued renewable expansion also reduced dependence on imported fossil fuels in parts of the power system.
India - India’s power market faced increasing coal-supply pressure during August. Heavy monsoon rainfall disrupted mining and rail transportation while strong cooling demand reduced inventories at thermal power plants. Approximately 45 facilities were classified as having critically low coal stocks. Refiners also sought additional spot crude supplies while paying closer attention to routes exposed to Red Sea and Strait of Hormuz risk. These conditions kept fuel security and procurement flexibility central to the market.
Europe - European energy markets remained highly sensitive to gas storage and weather. Gas inventories entered August at unusually low seasonal levels. A major heatwave temporarily lifted electricity prices as high temperatures reduced French nuclear availability. In addition, weakened German wind generation and increased cooling demand further pressurized the domestic tariff levels. Energy costs therefore remained sensitive to both imported LNG availability and domestic generation constraints.
U.S. - The U.S. remained increasingly important to global gas supply during August as LNG exports continued at a record 2026 pace, helping replace part of the reduction in Qatari supply. Higher export demand strengthened the connection between domestic natural gas prices and international LNG markets.
Saudi Arabia - Saudi Arabia remained central to global crude supply through its role in OPEC+ and its ability to redirect oil flows during Gulf disruption. Production policy continued shifting toward higher output, while ongoing use of the East-West Pipeline helped maintain export flexibility away from the Strait of Hormuz. Upstream and gas development programmes also continued progressing, supporting the Kingdom’s ability to expand supply capacity over the medium term.
Get region-wise energy price assessment.
Request Access
Access Grand View Signal.UAE - The UAE remained an important crude-production, logistics, and bunkering center during August. Upstream operators continued focusing on maintaining production efficiency and operational continuity despite regional risk, including broader deployment of digital monitoring across drilling operations. The country’s diversified export infrastructure and Fujairah logistics hub remained important in reducing direct dependence on Strait of Hormuz transit for selected energy flows.
Egypt - Egypt focused on securing electricity-generation fuel during August as temperatures pushed national power demand to record levels. Peak electricity load reached approximately 40.2 GW during the mid-month heatwave, while gas and alternative fuel supplies were managed to maintain grid stability. Authorities also accelerated development work on new offshore gas resources as part of efforts to strengthen domestic production and reduce longer-term import requirements.
Morocco - Morocco’s energy system continued balancing imported-fuel exposure with rapid renewable expansion during August. Renewable capacity accounted for more than 46% of the national generation fleet, reducing some dependence on imported fossil fuels while increasing the importance of storage, grid flexibility and dispatchable generation. Coal and imported petroleum products nevertheless remained relevant to supply security and system balancing.
Qatar - Qatar remained one of the most disrupted major LNG suppliers during August as shipping constraints through the Strait of Hormuz continued to restrict exports. The reduction in Qatari LNG availability increased reliance on alternative suppliers, particularly the U.S., and kept European and Asian gas buyers sensitive to flexible cargo availability. Export reliability and shipping access therefore remained the main influences on Qatar’s energy market.
Analyst Commentary
“Energy markets remained highly differentiated during August 2026. higher OPEC+ supply expectations and weaker demand signals competed with persistent disruption around the Strait of Hormuz. Natural gas and LNG remained comparatively tighter because Qatari supply stayed constrained. European inventories remained low despite improved late-month injections. Coal retained selective support where utilities faced high power demand and fuel-security concerns, particularly in India. Overall energy-market direction remained dependent on Gulf shipping security, OPEC+ production, LNG availability, European storage progress, refinery operations, power demand, and regional fuel inventories.”
Senior Energy Analyst
Frequently Asked Questions
Liquefied natural gas (LNG) emerged as the top-performing energy commodity, outperforming other energy segments on the back of surging demand and restricted supplies.
Europe registered one of the strongest performances in liquified natural gas prices in August 2026.
Liquefied natural gas prices in Europe increased by over 17% on a MoM basis, indicating that the regional buyers are actively looking for contract agreements for a flexible supply.
Price movement remained highly volatile with recorded an average of over 13% growth in the last three months.
![Key questions answered by the report]()
-


Coverage
Data Depth
200
Commodities
Multiple
Geographies
6 Months
Forecast
10 Years
Historic Data
Get Free Newsletter
This free newsletter offers a hint of our pricing commodity coverage encompassing executive summary, drivers, and scope of research.
Get FREE NewsletterWe are committed towards customer satisfaction, and quality service.
"The quality of research they have done for us has been excellent."
