
- Home
- »
- Research
- »
-
Rubber Monthly Pricing Data & Analysis – August 2026
![Rubber Monthly Price Assessment – August 2026Report]()
Rubber Monthly Price Assessment – August 2026
Natural Rubber (RSS3) and Synthetic Rubber (Nitrile Rubber and Polybutadiene Rubber)
Rubber Pricing Intelligence - Executive Summary
Rubber markets recorded stable movement during August 2026. Natural rubber weakened initially during the opening part of the month before strengthening progressively. Supply concerns remained important as rainfall disrupted tapping across parts of Southeast Asia and domestic Chinese producing regions. Natural rubber inventories at Qingdao continued to decline with downstream buyers resisting paying higher prices. Tire manufacturers largely maintained requirement based procurement rather than aggressive inventory building.
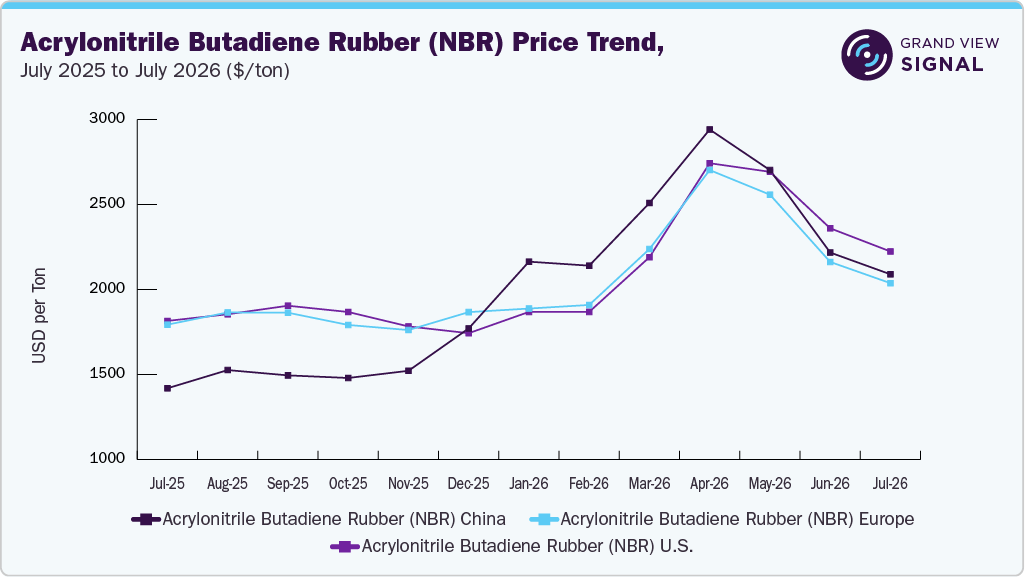
Synthetic rubber recorded steady movement led by butadiene rubber (BR). BR remained relatively stable during early August before rising sharply through the middle and later parts of the month. The rise was supported by butadiene feedstock costs strengthening and tighter spot availability. Acrylonitrile butadiene rubber (NBR) followed a steadier pattern during the first half before gradually strengthening as feedstock costs supported producer offers.
Demand across the wider rubber chain remained uneven. Tire sector operating rates in China improved modestly during August. However, high raw material costs and weaker-than-expected product shipments continued limiting restocking. India maintained comparatively resilient tire demand while manufacturers faced tighter natural rubber availability and higher input costs. European replacement tire demand showed improvement, while the U.S. tire industry entered the month with a weaker full-year shipment outlook. Overall, August rubber pricing was shaped primarily by physical natural rubber availability, synthetic-rubber feedstock costs, inventories, and producer operating decisions rather than a broad acceleration in end-user demand.
Key Price Developments & Insights
-
Natural rubber strengthened after a softer opening to August, with late-month support coming from continued inventory drawdown and weather-related interruptions.
-
BR recorded steadier movement within the covered rubber segment, rising sharply during the middle and later parts of August as butadiene costs increased and available supply tightened.
-
NBR followed a more gradual upward pattern, with firmer feedstock replacement costs supporting offers while weak industrial purchasing restricted the extent of the increase.
-
Regional natural-rubber markets remained differentiated, with Indian domestic sheet-rubber conditions comparatively firm in late August while buyers across major consuming markets remained cautious at elevated raw-material costs.
-
Tire demand provided underlying support but remained uneven, as replacement markets proved more resilient in several regions while original equipment and other automotive-linked demand remained less consistent.
Top Performing Rubber Commodity
-
Top Mover: Acrylonitrile Butadiene Rubber (NBR)
-
Average MoM Growth (top 3 geographies): 1.9%
-
Volatility Level: Stable
Natural Rubber – Pricing Trends, August 2026
Natural rubber moved from early August softness into a progressively firmer second half. Rainfall across key producing regions disrupted tapping and slowed the expected seasonal increase in new rubber availability. In China, Qingdao inventories continued to decline during the month as the buyers sentiments improved slightly. Tire operating rates improved modestly, but downstream manufacturers remained cautious because high raw-material costs were difficult to pass through fully. The resulting market was therefore supported by weather and inventory conditions while still restrained by disciplined downstream procurement.
 Pricing Intelligence Platform
- Category & commodity wise real-time price trends and movements
- Latest and impact-making market drivers
- Geographic coverage across key countries
- Impact and Forecasting based on Geopolitical Scenarios.
Synthetic Rubber – Pricing Trends, August 2026
Synthetic rubber strengthened more clearly during August, particularly across the BR market. Higher butadiene costs, reduced prompt availability, and producer price adjustments supported a sharp mid-to-late-month rise. BR temporarily corrected when crude-linked sentiment weakened, but production reductions at selected plants helped maintain a comparatively firm supply balance. NBR followed a steadier increase from the middle of August as higher feedstock replacement costs encouraged stronger producer quotations, although purchasing from seals, hoses, footwear, cable, and other industrial-rubber applications remained largely tied to confirmed requirements.
Rubber Price Direction, By Geography And Rubber Group, September 2026
Geography
Natural Rubber
Synthetic Rubber
China
0.3%
0.4%
India
France
Germany
UK
Europe
U.S.
Saudi Arabia
UAE
Qatar
Egypt
Morocco
Rubber Pricing - Key Drivers
-
Weather disruption and tightening natural-rubber inventories - Natural-rubber supply remained sensitive to weather during August. Southeast Asian producing regions entered a seasonally stronger tapping period, but recurring rainfall disrupted field activity and limited the speed at which additional rubber reached the market. Similar weather interruptions affected output in parts of China. At the same time, natural rubber inventories in Qingdao continued to decline, reducing some of the stock pressure that had previously limited price increases. These conditions supported firmer natural rubber prices even though imports and seasonal production were beginning to improve. Tire producers remained cautious at higher raw material costs and largely continued purchasing according to production requirements. This combination of weather-sensitive supply and gradual inventory drawdown provided support without creating a broad shortage-driven buying cycle.
-
Rising butadiene costs and tighter BR supply - Butadiene became the strongest immediate cost driver for synthetic rubber during August. Feedstock availability tightened as maintenance reduced supply and spot material became less readily available. Higher butadiene replacement costs compressed BR production economics and encouraged producers and traders to increase offers during the middle of the month. Supply conditions tightened further late in August when selected high-cis BR facilities began reducing production. Although crude-price fluctuations triggered a temporary market correction, the combination of elevated butadiene costs and lower expected BR output prevented a deeper decline. The sharp BR movement therefore reflected feedstock and supply pressure more strongly than a comparable improvement in tire demand.
-
NBR cost support versus weak industrial demand - NBR experienced a more controlled improvement than BR. Feedstock-related cost pressure strengthened during the second half of August and several producer quotations moved higher. However, the NBR market remained constrained by weak downstream purchasing, producing a gradual rather than abrupt rise. Demand remained spread across automotive seals and hoses, industrial gaskets, footwear, cable products, rollers, and other oil-resistant applications. This broader application base provided consistent underlying consumption, but users continued avoiding speculative inventory building. NBR pricing consequently reflected a balance between stronger production costs and requirement-based industrial procurement.
Get in-depth driver impact analysis on rubber prices.
Request Free Access
Access Grand View Signal.-
Uneven tire demand and cautious inventory management - Tire demand remained the largest consumption driver for natural rubber and BR, but market conditions differed substantially by region and channel. In China, tire operating rates improved modestly during August as maintenance activity declined and winter-tire production increased, yet high raw-material prices and weaker-than-expected shipments limited output growth. Buyers therefore maintained disciplined raw-material inventories. India's tire industry showed stronger underlying demand, with manufacturers operating at high utilization levels and continuing capacity investment despite higher natural-rubber and crude-linked input costs. In Europe, the latest available second-quarter replacement-market data released during August showed broader improvement across tire categories, while original-equipment demand remained less consistent. The U.S. tire market remained softer, with the latest full-year industry forecast released in August indicating lower total shipments than in 2025. These regional differences prevented rubber consumption from developing into a uniform global demand cycle.
-
Tire manufacturing localization, recycling, and supply-chain regulation - Structural changes in tire manufacturing and end-of-life rubber management continued reshaping regional rubber demand during August. New tire-manufacturing projects advanced in North Africa, including proposed and planned passenger-car tire capacity in Egypt and Morocco. These developments are future sources of rubber demand rather than additions to August physical consumption, but they reinforce the gradual localization of tire manufacturing closer to regional automotive markets. Recycling and traceability requirements also became more important. A new interim compliance approach for waste-tire exports from England took effect from the beginning of August, increasing reporting and verification requirements across the waste-rubber chain. At the same time, European tire producers continued expanding recycled-material applications. These developments did not determine August raw-rubber prices directly but affected recycling economics, sourcing requirements, and the longer-term structure of rubber demand.
Rubbers Coverage
Natural Rubber
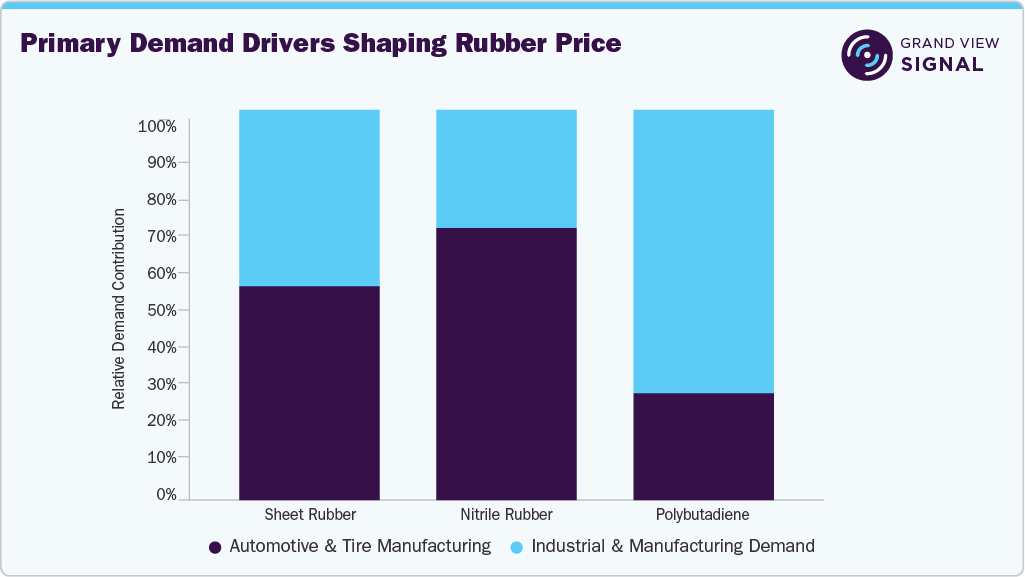
The natural rubber category covers sheet rubber. It is used primarily in tires, automotive components, conveyor belts, footwear, and technical rubber products where elasticity, strength and resistance to repeated deformation are required.
Natural Rubber Pricing - Key influencers
-
Weather and tapping conditions in major producing regions
-
Physical inventories and import availability
-
Tire manufacturing and replacement-market demand
-
Regional freight, currency, and procurement conditions
Get historical, current, and forecast natural rubber price assessments.
Request Free Access
Access Grand View Signal.Synthetic Rubber
The synthetic rubber category covers nitrile and polybutadiene based rubber. BR is used mainly in tires, footwear and products requiring flexibility and abrasion resistance. NBR is used across oil-resistant seals, hoses, gaskets, rollers, footwear, cable products, and industrial applications.
Synthetic Rubber Pricing - Key influencers
-
Butadiene and acrylonitrile replacement costs
-
Producer maintenance and operating-rate changes
-
Tire and automotive-component production
-
Industrial-rubber demand and available inventories
Get historical, current, and forecast synthetic rubber price assessments.
Request Free Access
Access Grand View Signal.Regional Commentary
China - China recorded the clearest August strengthening across the covered rubber products. Natural rubber moved higher through the second half as Qingdao inventories declined and rainfall interrupted supply. The domestic tire producers continued requirement based purchasing. BR strengthened substantially as butadiene costs increased and supply tightened, while NBR followed a steadier late month rise. Manufacturing conditions improved from July but remained uneven, limiting a broader demand-led rally.
India - India's natural-rubber market remained comparatively firm during late August as domestic tire manufacturers faced tight raw-material availability and elevated input costs. Tire-sector demand remained resilient across replacement and original-equipment channels, encouraging continued capacity utilization and investment. Weather risk also remained important after weaker August rainfall increased concern around agricultural conditions and future rubber cultivation.
Europe - European rubber demand received support from an improving replacement-tire market. The latest available second-quarter data released during August showed growth across the principal replacement categories, with consumer and truck-related segments improving. Nevertheless, original-equipment demand remained more uneven, while elevated energy, logistics and raw-material costs continued influencing tire-production economics.
France - France followed the wider European pattern of firmer replacement activity but uneven automotive demand. The tire sector continued emphasizing higher-performance and specialized applications during August, supporting technology-intensive rubber consumption rather than broad volume growth. Wider raw material and manufacturing costs remained an important constraint on producer margins.
Germany - Germany's tire sector maintained comparatively strong profitability despite weak global vehicle production. Premium tire demand provided support, but producers entered the second half of the year expecting higher raw material costs as elevated oil prices increased synthetic-rubber and other material expenses. The market therefore combined resilient higher-value tire demand with continued cost pressure.
UK - The UK rubber value chain faced tighter waste-tire compliance requirements during August. From the beginning of the month, exporters moved to a new interim reporting and verification approach covering waste-tire shipments and treatment facilities. This increased traceability and compliance requirements across recycling and export channels, although the measure did not directly change virgin-rubber pricing.
Get region-wise rubber price assessment.
Request Free Access
Access Grand View Signal.U.S. - The U.S. tire market remained comparatively cautious. An industry forecast released during August projected lower total tire shipments for 2026 than in the previous year, with weakness concentrated particularly in replacement categories. This limited expectations for a strong acceleration in rubber consumption even as synthetic-rubber production costs remained exposed to crude oil and petrochemical feedstocks.
Saudi Arabia - No major new domestic rubber-production change was identified during August. The most relevant development was continued investment in Red Sea logistics infrastructure, including additional terminal development at Jeddah, which strengthened the country's capacity to manage imported automotive, tire and industrial cargoes. The development supports supply-chain efficiency but should not be treated as a direct August rubber-price driver.
UAE - The UAE rubber market remained primarily linked to imported tires, vehicles, and industrial rubber products. During August, Gulf supply chains increasingly focused on ports and routes that reduced exposure to the Strait of Hormuz, strengthening the importance of eastern UAE logistics infrastructure. This provided greater trade flexibility but did not represent a new source of domestic natural or synthetic rubber production.
Egypt - Egypt advanced plans for additional domestic tire manufacturing during August, including a proposed passenger-car and light-commercial-vehicle tire facility intended to reduce import dependence. The project remains a future capacity development rather than current production. If implemented, it would expand the country's longer-term demand base for natural rubber, synthetic rubber, carbon black, and other tire inputs.
Morocco - Morocco continued strengthening its position as an emerging tire-production hub. During August, a planned passenger-car radial tire project completed important overseas investment approvals, allowing work on site approval and local establishment to advance. The project represents future rubber demand rather than August physical consumption, but it reinforces the expansion of Morocco's automotive and tire-manufacturing supply chain.
Analyst Commentary
“Rubber markets strengthened overall during August 2026, but the drivers differed across natural and synthetic products. Natural rubber moved from early weakness into a firmer second half as rainfall disrupted tapping and Qingdao inventories continued to decline. BR recorded the strongest increase as tighter butadiene supply raised feedstock costs and selected producers reduced output. On the other hand, NBR strengthened more gradually as cost support was balanced by cautious industrial demand. Overall, August rubber pricing was driven more by physical availability, feed stock costs, inventories, and producer operating decisions than by a broad acceleration in downstream demand.”
Senior Rubber Analyst
Frequently Asked Questions
Acrylonitrile butadiene rubber (NBR) emerged as the top-performing rubber commodity, outperforming its counterparts on the back of stronger demand momentum.
China was the primary contributor to NBR price performance as the domestic cracker units shutdown caused butadiene prices to shoot upwards.
NBR prices increased by 4.8% on a MoM basis in China, indicating a strong tie-up with the feedstock prices primarily butadiene.
The NBR prices in China are in mild elevated mode with surging butadiene and crude oil prices.
![Key questions answered by the report]()
-


Coverage
Data Depth
200
Commodities
Multiple
Geographies
6 Months
Forecast
10 Years
Historic Data
Get Free Newsletter
This free newsletter offers a hint of our pricing commodity coverage encompassing executive summary, drivers, and scope of research.
Get FREE NewsletterWe are committed towards customer satisfaction, and quality service.
"The quality of research they have done for us has been excellent."
